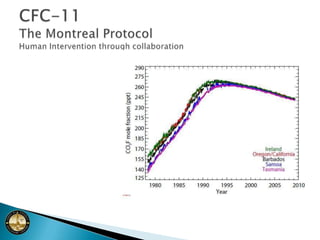
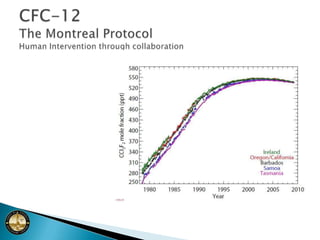
Climate change discussion and various scientific viewpoints weave a matrix of knowledge in an incredibly complex global environment. Carbon dioxide sequestration is part of the matrix of environmental solutions that will accelerate our ability to develop and deploy green renewable energy.
Rising Seas and Solutions, Sigma Xi LecturePaul H. Carr
Miami Beach becomes a flood zone during King High Tides. The melting of Greenland, mountain glaciers, and thermal expansion is raising sea levels four times faster than in 1900. Sea level rises of 2 to 6 feet are predicted by the end of the century. Flood highs from hurricanes Sandy and Katrina were ~ 10 feet.
The article “Treading Water” in the February 2015 National Geographic tells how Dutch Docklands LLC sees profit not loss from rising sea levels. They are building floating homes in Miami, FL. A floating classroom could assure Eckerd Colleges's long-term future. It would provide a place to meet in the event of flooding by the 10-foot ocean surges that accompany hurricanes.
Dr. Carr describes how increasing greenhouse gases, mostly carbon dioxide from the burning of fossil fuels, trap the radiation that is warming our planet. Advances in non-carbon emitting energy sources can reduce global warming. Solar PV panels are now generating electricity at $0.07/kWhr, less than the national utility average of $0.12kWhr. Rising sea levels are a better measure of global warming than atmospheric temperature, as 90% of our planet’s heat content is in our oceans.
Severe concerns over the consequences of climate change may lead us to make a forced choice between energy and environment. Averting such a crisis will be difficult, because fossil energy resources are an essential part of the world’s energy supply and climate change is mainly driven by the build-up of carbon dioxide in the atmosphere.
Carbon capture and sequestration is a boon in a carbon constrained world and a study of this topic may help us understand more about this process and its importance in today's world. In this presentation, I have tried to highlight the important steps involved in the overall process of carbon capture and sequestration and it is supported by some graphs.
Prime Carbon: Soil Enhancement & Carbon Sequestration ProgramCarbon Coalition
Deborah Burden is CEO Prime CArbon. She explains how Australia's first regional carbon trading scheme works. This presentation was given at the Carbon Farming Expo & Conference Orange 18-19 November, 2008. Orange is in new South Wales, Australia.
KKKH4284 URBAN PLANNING OF SUSTAINABLE DEVELOPMENT
TASK 6 : GLOBAL WARMING
LECTURERS :
PROF. IR. DR. RIZA ATIQ ABDULLAH O.K RAHMAT
DR. NAZRI BORHAN
DR. NORLIZA MOHD AKHIR
about...Carbon sequestration, Co2 capture technology, types of carbon sequestration, Co2 separation, carbon sources and carbon sinks, benefits of soil sequestration of carbon, conclution.
Carbon sequestration is the process involved in carbon capture and the long-term storage of atmospheric carbon dioxide (CO
2)[1] and may refer specifically to:
"The process of removing carbon from the atmosphere and depositing it in a reservoir."[4] When carried out deliberately, this may also be referred to as carbon dioxide removal, which is a form of geoengineering.
Carbon capture and storage, where carbon dioxide is removed from flue gases (e.g., at power stations) before being stored in underground reservoirs.
Natural biogeochemical cycling of carbon between the atmosphere and reservoirs, such as by chemical weathering of rocks.
As a result of our consumer culture lifestyle, we are polluting the earth and slowly changing its temperature. As a result, weather patterns will be less predictable and water level will rise significantly
Climate change is an extended change in the Earth’s regular pattern of atmospheric conditions and its fluctuations
Global warming is caused by an enhanced greenhouse effect mostly caused by anthropogenic activity
Global Climatic Disruption and its Impact on Victoria and CaliforniaLarry Smarr
10.05.20
High Definition Remote Presentation to the
Monash Undergraduate Research Projects Abroad (MURPA) Program, Located at Monash University, Australia
Title: Global Climatic Disruption and its Impact on Victoria and California
Irvine, CA
Climate Change: Current Status, Impacts and Solutions by Mario MolinaWILD Foundation
Dr. Mario Molina, Nobel Laureate and Foundation of the Mario Molina Center, presented in the Friday (6 November) WILD9 Plenary on "Climate Change, Energy and Wilderness," specifically speaking on 'Climate Change: The Current Status, Potential Impacts and What we can do."
The IMF warns that human fortunes will “evaporate like water under a relentless sun” if climate change is not checked. “It’s nice for people to talk about two degrees,” says Bill Gates, a philanthropist and investor. “But we don’t even have the commitments that are going to keep us below four degrees of warming.”
Alarmist?
On the contrary - my review has changed my world view and it's not a comfortable feeling.
But you know what's funny ? I mean odd not humourous - this site only allows me to file this paper under 'science'!
The money view - between “5 and 20 per cent of global GDP every year now and forever"
Polar Political Economy, Climate Change, and the ArcticGordon M. Groat
A layman's perspective on the emerging polar political economy and how climate change in the Arctic will be a driving factor in the development of polar politics and economic change.
Evolving Collaboration Patterns in North American Research Using Advanced Collaborative GRID Infrastructures : A Canadian Perspective Based on Co-Linking of High Performance Research GRIDs
A paper that examines unharvested computational overhead (CPU cycles) typically found in most large institutions, especially universities and colleges.
Instructions for Submissions thorugh G- Classroom.pptxJheel Barad
This presentation provides a briefing on how to upload submissions and documents in Google Classroom. It was prepared as part of an orientation for new Sainik School in-service teacher trainees. As a training officer, my goal is to ensure that you are comfortable and proficient with this essential tool for managing assignments and fostering student engagement.
June 3, 2024 Anti-Semitism Letter Sent to MIT President Kornbluth and MIT Cor...Levi Shapiro
Letter from the Congress of the United States regarding Anti-Semitism sent June 3rd to MIT President Sally Kornbluth, MIT Corp Chair, Mark Gorenberg
Dear Dr. Kornbluth and Mr. Gorenberg,
The US House of Representatives is deeply concerned by ongoing and pervasive acts of antisemitic
harassment and intimidation at the Massachusetts Institute of Technology (MIT). Failing to act decisively to ensure a safe learning environment for all students would be a grave dereliction of your responsibilities as President of MIT and Chair of the MIT Corporation.
This Congress will not stand idly by and allow an environment hostile to Jewish students to persist. The House believes that your institution is in violation of Title VI of the Civil Rights Act, and the inability or
unwillingness to rectify this violation through action requires accountability.
Postsecondary education is a unique opportunity for students to learn and have their ideas and beliefs challenged. However, universities receiving hundreds of millions of federal funds annually have denied
students that opportunity and have been hijacked to become venues for the promotion of terrorism, antisemitic harassment and intimidation, unlawful encampments, and in some cases, assaults and riots.
The House of Representatives will not countenance the use of federal funds to indoctrinate students into hateful, antisemitic, anti-American supporters of terrorism. Investigations into campus antisemitism by the Committee on Education and the Workforce and the Committee on Ways and Means have been expanded into a Congress-wide probe across all relevant jurisdictions to address this national crisis. The undersigned Committees will conduct oversight into the use of federal funds at MIT and its learning environment under authorities granted to each Committee.
• The Committee on Education and the Workforce has been investigating your institution since December 7, 2023. The Committee has broad jurisdiction over postsecondary education, including its compliance with Title VI of the Civil Rights Act, campus safety concerns over disruptions to the learning environment, and the awarding of federal student aid under the Higher Education Act.
• The Committee on Oversight and Accountability is investigating the sources of funding and other support flowing to groups espousing pro-Hamas propaganda and engaged in antisemitic harassment and intimidation of students. The Committee on Oversight and Accountability is the principal oversight committee of the US House of Representatives and has broad authority to investigate “any matter” at “any time” under House Rule X.
• The Committee on Ways and Means has been investigating several universities since November 15, 2023, when the Committee held a hearing entitled From Ivory Towers to Dark Corners: Investigating the Nexus Between Antisemitism, Tax-Exempt Universities, and Terror Financing. The Committee followed the hearing with letters to those institutions on January 10, 202
The Roman Empire A Historical Colossus.pdfkaushalkr1407
The Roman Empire, a vast and enduring power, stands as one of history's most remarkable civilizations, leaving an indelible imprint on the world. It emerged from the Roman Republic, transitioning into an imperial powerhouse under the leadership of Augustus Caesar in 27 BCE. This transformation marked the beginning of an era defined by unprecedented territorial expansion, architectural marvels, and profound cultural influence.
The empire's roots lie in the city of Rome, founded, according to legend, by Romulus in 753 BCE. Over centuries, Rome evolved from a small settlement to a formidable republic, characterized by a complex political system with elected officials and checks on power. However, internal strife, class conflicts, and military ambitions paved the way for the end of the Republic. Julius Caesar’s dictatorship and subsequent assassination in 44 BCE created a power vacuum, leading to a civil war. Octavian, later Augustus, emerged victorious, heralding the Roman Empire’s birth.
Under Augustus, the empire experienced the Pax Romana, a 200-year period of relative peace and stability. Augustus reformed the military, established efficient administrative systems, and initiated grand construction projects. The empire's borders expanded, encompassing territories from Britain to Egypt and from Spain to the Euphrates. Roman legions, renowned for their discipline and engineering prowess, secured and maintained these vast territories, building roads, fortifications, and cities that facilitated control and integration.
The Roman Empire’s society was hierarchical, with a rigid class system. At the top were the patricians, wealthy elites who held significant political power. Below them were the plebeians, free citizens with limited political influence, and the vast numbers of slaves who formed the backbone of the economy. The family unit was central, governed by the paterfamilias, the male head who held absolute authority.
Culturally, the Romans were eclectic, absorbing and adapting elements from the civilizations they encountered, particularly the Greeks. Roman art, literature, and philosophy reflected this synthesis, creating a rich cultural tapestry. Latin, the Roman language, became the lingua franca of the Western world, influencing numerous modern languages.
Roman architecture and engineering achievements were monumental. They perfected the arch, vault, and dome, constructing enduring structures like the Colosseum, Pantheon, and aqueducts. These engineering marvels not only showcased Roman ingenuity but also served practical purposes, from public entertainment to water supply.
Acetabularia Information For Class 9 .docxvaibhavrinwa19
Acetabularia acetabulum is a single-celled green alga that in its vegetative state is morphologically differentiated into a basal rhizoid and an axially elongated stalk, which bears whorls of branching hairs. The single diploid nucleus resides in the rhizoid.
Honest Reviews of Tim Han LMA Course Program.pptxtimhan337
Personal development courses are widely available today, with each one promising life-changing outcomes. Tim Han’s Life Mastery Achievers (LMA) Course has drawn a lot of interest. In addition to offering my frank assessment of Success Insider’s LMA Course, this piece examines the course’s effects via a variety of Tim Han LMA course reviews and Success Insider comments.
Model Attribute Check Company Auto PropertyCeline George
In Odoo, the multi-company feature allows you to manage multiple companies within a single Odoo database instance. Each company can have its own configurations while still sharing common resources such as products, customers, and suppliers.
Palestine last event orientationfvgnh .pptxRaedMohamed3
An EFL lesson about the current events in Palestine. It is intended to be for intermediate students who wish to increase their listening skills through a short lesson in power point.
2024.06.01 Introducing a competency framework for languag learning materials ...Sandy Millin
http://sandymillin.wordpress.com/iateflwebinar2024
Published classroom materials form the basis of syllabuses, drive teacher professional development, and have a potentially huge influence on learners, teachers and education systems. All teachers also create their own materials, whether a few sentences on a blackboard, a highly-structured fully-realised online course, or anything in between. Despite this, the knowledge and skills needed to create effective language learning materials are rarely part of teacher training, and are mostly learnt by trial and error.
Knowledge and skills frameworks, generally called competency frameworks, for ELT teachers, trainers and managers have existed for a few years now. However, until I created one for my MA dissertation, there wasn’t one drawing together what we need to know and do to be able to effectively produce language learning materials.
This webinar will introduce you to my framework, highlighting the key competencies I identified from my research. It will also show how anybody involved in language teaching (any language, not just English!), teacher training, managing schools or developing language learning materials can benefit from using the framework.
Synthetic Fiber Construction in lab .pptxPavel ( NSTU)
Synthetic fiber production is a fascinating and complex field that blends chemistry, engineering, and environmental science. By understanding these aspects, students can gain a comprehensive view of synthetic fiber production, its impact on society and the environment, and the potential for future innovations. Synthetic fibers play a crucial role in modern society, impacting various aspects of daily life, industry, and the environment. ynthetic fibers are integral to modern life, offering a range of benefits from cost-effectiveness and versatility to innovative applications and performance characteristics. While they pose environmental challenges, ongoing research and development aim to create more sustainable and eco-friendly alternatives. Understanding the importance of synthetic fibers helps in appreciating their role in the economy, industry, and daily life, while also emphasizing the need for sustainable practices and innovation.
Macroeconomics- Movie Location
This will be used as part of your Personal Professional Portfolio once graded.
Objective:
Prepare a presentation or a paper using research, basic comparative analysis, data organization and application of economic information. You will make an informed assessment of an economic climate outside of the United States to accomplish an entertainment industry objective.
How to Make a Field invisible in Odoo 17Celine George
It is possible to hide or invisible some fields in odoo. Commonly using “invisible” attribute in the field definition to invisible the fields. This slide will show how to make a field invisible in odoo 17.
4. Earth Systems This is a physically Impossible view of Earth imaged by Galileo Orbiter taken directly over the South Pole. Why is this view physically impossible? Image creditNASA/JPL
5. Greenhouse Gases (GHG’s) such as CO2 Solar Insolation & Milankovitch Cycles What causes an Ice Age?
8. PrecessionMilankovitch Cyclesand Glaciation Credit: Montana State University Department of Earth SciencesDr. William W. LockeA hypertext for the appreciation of glaciers, and how they work By the students in Geology 445 Glacial Geology - Spring, 1999
11. Grinnell Glacier in 1940 Grinnell Glacier taken from the Grinnell Glacier Overlook off the Highline Trail, Glacier National Park. The view of Grinnell Glacier taken circa 1940 shows the early formation of Upper Grinnell Lake, a pro-glacier lake visible at the terminus of the glacier.
12. Grinnel Glacier in 2005 The lake continues to enlarge as the glacier recedes. Icebergs can be seen floating in Upper Grinnell Lake. This this photo was taken in 2005. Credit: Blase Reardon US Geological Survey
14. Solar activity & Orbital Centricity The Sun observed by SUMER instrument on the SOHO satellite on March 2-4, 1996. (Source:SOHO - SUMER Instrument).
15. Volcanic Activity Volcanic eruptions may send ash and sulphate gas high into the atmosphere. The sulphate may combine with water to produce tiny droplets (aerosols) of sulphuric acid, which reflect sunlight back into space. Large eruptions reach the middle stratosphere (19 miles to 30 kilometres high). At this altitude, the aerosols can spread around the world.
17. Clouds Water vapour is the most abundant greenhouse gas Cloud feedback could accelerate global warming. Fewer low level clouds mean that more sunlight reaches Earth’s surface, leading to further warming. Credit: Goddard Space Flight Center - EOS Project Science Office
18. Increasing PopulationIncreased Protein Consumption = increased Methane Credit: University of Hawaii at Manoa College of Tropical Agriculture and Human ResourcesCTAHR Exchange – C. Y. HuSustainable Agriculture
19. CO2 carbon dioxide CH4Methane N2O Nitrous oxide High GWP (global warming potential) gas HFC’s hydrofluorocarbons PFCs perfluorocarbons SF6 sulphur hexafluoride * To name some Complexity
21. Can we really make a difference? The Montreal Protocol demonstrates what can be achieved with global perspective, effective collaboration, and prudent stewardship.
22. Ozone depletion cooperation 2006 World Meteorological Organization/United Nations Environment Programme Scientific Assessment of Ozone Depletion concluded the ozone hole recovery would be masked by annual variability for the near future and the ozone hole would fully recover in approximately 2065. Full Recovery estimated 2065
25. Why are CO2 and CH4 so important?Carbon dioxide and Methane We know about CO2 and CH4 We can mitigate through human intervention Methane Gas (CH4)has significant potential to damage to Earth’s Atmosphere There could be 400 Gigatons of Methane locked in the frozen Arctic Tundra
26. Methane released from the Arctic Methane has significant capacity to accelerate global warming We do not know if there is a tipping point in atmospheric composition It is possible that Methane can contribute to a chain reaction that could alter the fundamental composition of atmospheric gases
45. Capture CO2 at the point of creation Coal fired electric power generation plants CO2 emissions from synthetic fuel generation Sequester (store) CO2 Requires significant government and industry support Policy to advance case for cost recovery of infrastructure Alberta’s CO2 Initiatives
70. Future Fuels and EmissionsNational Centre for Upgrading TechnologyUpgrading Catalyst Development NetworkUS Department of EnergyOil Sands Tailings Research Facility University of British Columbia University of Saskatchewan University of Ottawa University of Western Ontario Laval University University of New Brunswick
71. Alberta Applied & Basic Research Methanogenic in situ production Chemistry based solutions Enhanced biogenic remediation
72. 1 typical car annual = 5.5 tonnes 100 watt light bulb annual = .9 tonnes Upgrading and refining 10 barrels of bitumen = 1 tonne Carbon footprint perspective
73. Carbon dioxide sequestration infrastructure deployed is world class, leveraging years of experience with clean coal and EOR use for CO2 through the Weyburn-Midale Project Economic prosperity requires energy resources and hydrocarbons will be part of the matrix that will evolve into clean renewable energy – research will accelerate that process Positives
74. Research Collaboration is Vital International Collaboration is Crucial Interdisciplinary Networking Enhances Science Real Investment (Both Intellectual and Financial) Creates Real Transitional Pathways Towards Green Renewable Energy Solving Oil Sands Issues Creates Intellectual Property Value and Represents Globally Exportable Green Solutions Oil sands future
Editor's Notes
This learning module was produced by the Leduc #1 Energy Discovery Centre with the assistance of a grant from the Government of Alberta Department of Energy.The Leduc #1 Energy Discovery Centre preserves Alberta’s energy history and boasts one of the largest indoor and outdoor displays in the World. Leduc #1 houses Canada’s largest drilling bit experience. Leduc #1 is also a national historic site, home of the World famous Leduc #1 Discovery Well. Programs are provided by interpretive guides, energy industry veterans, and volunteers with extensive experience in the energy industry. The facility covers topics ranging from geology and history to natural resources like Alberta’s oilsands, natural gas, and oil.Leduc #1 Energy Discovery Centre also provides adult education course on a range of current topics including:Climate Change & Carbon Dioxide SequestrationEconomic Impact of Alberta’s OilsandsH2S (Hydrogen sulphide) Water Use and Alberta’s OilsandsAlternative EnergyGroups can be booked in advance. The average program length is 2 hours. The Leduc #1 Energy Discovery Centre can also provide lectures at your location on any of these topics.CONTACT:Leduc #1 Energy Discovery Centre#6, 20 Haven Ave.Devon, Alberta T9G 2B9 Toll Free: 866-987-4323Fax: 780-987-4365E-mail: info@leducnumber1.comLocated on Highway 60 just 1 kilometre south of Highway 19 (about 10 minutes from the Edmonton International Airport)
A statement issued 7 June 2005 by the National Science Academies of the United States, United Kingdom, France, Russia, Germany, Japan, Italy, Canada, Brazil, China and India, begins with the following;There will always be uncertainty in understanding a system as complex as the world’s climate. However, there is now strong evidence that significant global warming is occurring. The evidence comes from direct measurements of rising surface air temperatures and subsurface ocean temperatures and from phenomena such as increases in average global sea levels, retreating glaciers, and changes to many physical and biological systems. It is likely that most of the warming in recent decades can be attributed to human activities (IPCC 2001). This warming has already led to changes in the Earth's climate.What Causes Climate Change?Climate change is enormously complex. We know it is caused by Earth (natural causes) and Human systems a.k.a. anthropological impact. Emissions of gases, aerosols, and various pollutants combined with anthropological changes in global ecosystems weave an intricate and complex fabric of climate change accelerators (CCA).Earth systems, i.e. (natural causes) contribute to climate change primarily via planetary positioning relative to the sun and variance of solar output. It is also impacted by volcanic activity and other naturally occurring geological events.Of the human generated greenhouse gases, it is CO2 that represents the largest human system contribution to climate change.
Climate change is a result the interwoven fabric of Earth and Human systems. No one solution can possibly resolve the issue. The only logical solutions are to fund and conduct research in the environmental sciences and take actionable steps designed to reduce the human contribution to climate change. We’ve all heard that a journey of a thousand miles begins with a single step. The precise impact human changes will have upon complex global ecosystems are impossible to fully predict. As such, existing technologies like CO2 sequestration represent progress in the quest to reduce global greenhouse gases. No one solution can resolve climate change, but action, research, extending technologies, and reducing human contribution to climate change are part of a matrix for success. In Alberta, the government has funded 2 billion dollars to pursue CO2 emission reductions through a variety of investments. Alberta has joined with the federal government and corporate partners to accelerate development of one of the largest scale CO2 sequestration projects in the World designed to sequester CO2from coal based electricity generation. This represents a unique opportunity to advance technology and codify our expanding knowledge base. Developing projects and taking aggressive action to compete globally with Canadian technology will likely produce economic advancement regionally and internationally. Solid outcomes include reducing CO2 emissions that equate to taking millions of cars off the road are positive steps. Alberta can also produce synthetic crude from the oilsands with a smaller production carbon footprint than a barrel of Saudi Light by leveraging various production techniques combined with sequestration.
This image is beautiful – but it’s not an image we are widely familiar with. I show this for two reasons. First, it demonstrates that humanity is capable of great science. The second reason is that it clearly demonstrates that humans are extraordinarily gifted at thinking “outside” the box when faced with challenging tasks.This view of the Earth shows a wonderfully unique but physically impossible view of the southern hemisphere and Antarctica. While a spacecraft could find itself directly over the Earth's pole, roughly half of the image should be in darkness! This view was created by mosaicing together several images taken by Galileo over a 24 hour period and projecting them as they would be seen from above the pole. The continents of South America, Africa, and Australia are respectively seen at the middle left, upper right, and lower right. The slightly bluish ice and snow of Antarctica include large ice shelves (upper left, lower middle), a broad fan of broken offshore pack ice (lower left and middle) and continental glaciers protruding into the sea (lower right).Most spacecraft traveling near the Earth's poles are in very low Earth orbit, and cannot acquire panoramic shots like this one. Galileo's view of the southern hemisphere, combined with the spacecraft's special spectral properties (four separate narrowband filters that measure the brightness of reflected light at specific infrared wavelengths), led to a number of unique observations. For example, Galileo's cameras distinguished between ice and high stratospheric clouds, allowing scientists to study the correlation between these clouds and growth of the ozone hole.This image and other images and data received from Galileo are posted on the World Wide Web, on the Galileo mission home page at URL http://galileo.jpl.nasa.gov. Image Credit: NASA/JPL Image Addition Date: 1997-09-10nental glaciers protruding into the sea (lower right). The regularly spaced weather systems are prominent.
There is evidence that greenhouse gas levels fell at the start of ice ages and rose during the retreat of the ice sheets, but it is difficult to establish cause and effect. Greenhouse gas levels may also have been affected by other factors which have been proposed as causes of ice ages, such as the movement of continents and volcanism. The Snowball Earth hypothesis maintains that the severe freezing in the late Proterozoic was ended by an increase in CO2 levels in the atmosphere, and some supporters of Snowball Earth argue that it was caused by a reduction in atmospheric CO2. The hypothesis also warns of future Snowball Earths.The August, 2009 edition of Science provides further evidence that changes in solar insolation provide the initial trigger for the Earth to warm after an Ice Age, with secondary factors like increases in greenhouse gases accounting for the magnitude of the change. The insolation into a surface is largest when the surface directly faces the Sun. As the angle increases between the direction at a right angle to the surface and the direction of the rays of sunlight, the insolation is reduced in proportion to the cosine of the angle.William Ruddiman has proposed the earlyanthropocene hypothesis, according to which the anthropocene era, as some people call the most recent period in the Earth's history when the activities of the human race first began to have a significant global impact on the Earth's climate and ecosystems, did not begin in the 18th century with the advent of the Industrial Era, but dates back to 8,000 years ago, due to intense farming activities of our early agrarian ancestors. It was at that time that atmospheric greenhouse gas concentrations stopped following the periodic pattern of the Milankovitch cycles. In his overdue-glaciation hypothesis Ruddiman states that an incipient ice age would probably have begun several thousand years ago, but the arrival of that scheduled ice age was forestalled by the activities of early farmers.Clark, Peter U.; Dyke, Arthur S.; Shakun, Jeremy D.; Carlson, Anders E.; Clark, Jorie; Wohlfarth, Barbara; Mitrovica, Jerry X.; Hostetler, Steven W. et al. (2009), "The Last Glacial Maximum", Science325 (5941): 710–714
Milankovitch CyclesEccentricity – Eccentricity is not favourable to glaciation – periodicity 100,000 yearsEccentricity changes the shape of the Earth's orbit around the Sun. This constantly fluctuating, orbital shape ranges between more and less elliptical (0 to 5% ellipticity) on a cycle of about 100,000 years. These oscillations alter the distance from the Earth to the Sun, thus changing the distance the Sun's short wave radiation must travel to reach Earth, subsequently reducing or increasing the amount of radiation received at the Earth's surface in different seasons.Current Status: 3% variance estimated between nearest and farthest point and probably increases the solar energy received in Jan by aprox. 6%> than July. The most elliptical orbit would create a 20 to 30% greater range between nearest and furthest point a.k.a. Aphelion (furthest point) and Perihelion (closest point).Axial Tilt – Axial tilt is not favourable to glaciation – periodicity 41,000 yearsToday the Earth's axial tilt is about 23.5 degrees, which largely accounts for our seasons. Because of the periodic variations of this angle the severity of the Earth's seasons changes. With less axial tilt the Sun's solar radiation is more evenly distributed between winter and summer. However, less tilt also increases the difference in radiation receipts between the equatorial and polar regions. One hypothesis for Earth's reaction to a smaller degree of axial tilt is that it would promote the growth of ice sheets. This response would be due to a warmer winter, in which warmer air would be able to hold more moisture, and subsequently produce a greater amount of snowfall. In addition, summer temperatures would be cooler, resulting in less melting of the winter's accumulation. At present, axial tilt is in the middle of its range.Precession - precession is in the glacial mode – periodicity 23,000 yearsPrecessionis the Earth's slow wobble as it spins on axis. This wobbling of the Earth on its axis can be likened to a top running down, and beginning to wobble back and forth on its axis. The precession of Earth wobbles from pointing at Polaris (North Star) to pointing at the star Vega. When this shift to the axis pointing at Vega occurs, Vega would then be considered the North Star. This top-like wobble, or precession, has a periodicity of 23,000 years.Credit: Montana State University Department of Earth Sciences, Dr. William W. LockeA hypertext for the appreciation of glaciers, and how they work By the students in Geology 445 Glacial Geology - Spring, 1999
Glacier Deterioration : Pederson Glacier and the Muir and Riggs Glaciers in Alaska
Glacier deterioration in the South Cascade range in Washington, USA.
The Grinnell Glacier in Montana, USA
Glacier deterioration is well documented. This photo was taken by Blase Reardon of the U.S. Geological Survey.
When the Larsen B Ice Shelf in Antarctica collapsed in 2002, the event appeared to be a sudden response to climate change, and this long, fringing ice shelf in the north west part of the Weddell Sea was assumed to be the latest in a long line of victims of Antarctic summer heat waves linked to Global Warming.Prof. Neil Glasser of Aberystwyth University, working as a Fulbright Scholar in the US, and Dr. Ted Scambos of University of Colorado’s National Snow and Ice Data Centre, in the Journal of Glaciology, say that the shelf was already teetering on collapse before the final summer.“Ice shelf collapse is not as simple as we first thought,” said Professor Glasser, lead author of the paper. “Because large amounts of meltwater appeared on the ice shelf just before it collapsed, we had always assumed that air temperature increases were to blame. But our new study shows that ice-shelf break up is not controlled simply by climate. A number of other atmospheric, oceanic and glaciological factors are involved. For example, the location and spacing of fractures on the ice shelf such as crevasses and rifts are very important too because they determine how strong or weak the ice shelf is”.The study is important because ice shelf collapse contributes to global sea level rise, albeit indirectly. “Ice shelves themselves do not contribute directly to sea level rise because they are floating on the ocean and they already displace the same volume of water. But when the ice shelves collapse the glaciers that feed them speed up and get thinner, so they supply more ice to the oceans,” Prof. Glasser explained.Professor Glasser acknowledges that global warming had a major part to play in the collapse, but emphasises that it is only one in a number of contributory factors, and despite the dramatic nature of the break-up in 2002, both observations by glaciologists and numerical modeling by other scientists at NASA and CPOM (Centre of Polar Observation and Modeling) had pointed to an ice shelf in distress for decades previously. “It’s likely that melting from higher ocean temperatures, or even a gradual decline in the ice mass of the Peninsula over the centuries, was pushing the Larsen to the brink”, said co-author Ted Scambos of University of Colorado’s National Snow and Ice Data Centre.
Much of the energy that drives the various Earth systems (climate systems, ecosystems, hydrologic systems, etc.) originates from the Sun. Solar energy is created at the core of the Sun when hydrogen atoms are fused into helium by nuclear fusion. For each second of this nuclear process, 700 million tons of hydrogen are converted into 695 million tons of helium. The remaining 5 million tons are turned into electromagnetic energy that radiates from the Sun's surface out into space.The radiative surface of the Sun, or photosphere, has an average temperature of about 58,00 Kelvins...Apx. (57,726 C or 103,940 F)The Earth's orbital path varies in the degree to which it is circular. This change in its "eccentricity" varies between 0.00 and 0.06 on a 100,000 year cycle. When the eccentricity equals 0.00 the orbital path is circular and when it is 0.06 the orbital path is slightly elliptical. The current value is 0.0167 and is not favourable to glaciation.
Volcanic ActivityVolcanic dust blasted into the atmosphere causes temporary cooling. The amount of cooling depends on the amount of dust put into the air, and the duration of the cooling depends on the size of the dust particles. Particles the size of sand grains fall out of the air in a matter of a few minutes and stay close to the volcano. These particles have little effect on the climate. Tiny dust-size ash particles thrown into the lower atmosphere will float around for hours or days, causing darkness and cooling directly beneath the ash cloud, but these particles are quickly washed out of the air by the abundant water and rain present in the lower atmosphere. However, dust tossed into the dry upper atmosphere, the stratosphere, can remain for weeks to months before they finally settle. These particles block sunlight and cause some cooling over large areas of the earth.Volcanic eruptions may send ash and sulphate gas high into the atmosphere. The sulphate may combine with water to produce tiny droplets (aerosols) of sulphuric acid, which reflect sunlight back into space. Large eruptions reach the middle stratosphere (19 miles to 30 kilometres high). At this altitude, the aerosols can spread around the world.A massive volcanic eruption can cool the Earth for one or two years. The 1982 El Chichon eruption and the 1991 Pinatubo eruption caused the globally averaged surface temperature to cool less than 1°F.
Volcanoes that release large amounts of sulphur compounds like sulphur oxide or sulphur dioxide affect the climate more strongly than those that eject just dust. The sulphur compounds are gases that rise easily into the stratosphere. Once there, they combine with the (limited) water available to form a haze of tiny droplets of sulphuric acid. These tiny droplets are very light in color and reflect a great deal of sunlight for their size. Although the droplets eventually grow large enough to fall to the earth, the stratosphere is so dry that it takes time, months or even years to happen. Consequently, reflective hazes of sulphur droplets can cause significant cooling of the Earth for as long as two years after a major sulphur-bearing eruption. sulphur hazes are believed to have been the primary cause of the global cooling that occurred after the Pinatubo and Tambora eruptions. For many months, a satellite tracked the sulphur cloud produced by Pinatubo. The image shows the cloud about three months after the eruption.Volcanoes also release large amounts of water and carbon dioxide. When these two compounds are in the form of gases in the atmosphere, they absorb heat radiation (infrared) emitted by the ground and hold it in the atmosphere. This causes the air below to get warmer. Therefore, you might think that a major eruption would cause a temporary warming of the atmosphere rather than a cooling. However, there are very large amounts of water and carbon dioxide in the atmosphere already, and even a large eruption doesn't change the global amounts very much. In addition, the water generally condenses out of the atmosphere as rain in a few hours to a few days, and the carbon dioxide quickly dissolves in the ocean or is absorbed by plants. Consequently, the sulphur compounds have a greater short-term effect, and cooling dominates. However, over long periods of time (thousands or millions of years), multiple eruptions of giant volcanoes, such as the flood basaltvolcanoes, can raise the carbon dioxide levels enough to cause significant global warming.
Changes in clouds result from changes in the distribution of water vapour, temperature, and winds. The effects of global warming on these factors are complex and not well understood. Met Office (UK gov) atmospheric research modeling predicts that low-level cloud cover over a test area decreased under global warming, creating positive feedback. This is apparently due to an increase in sea-surface temperatures and weakening of the large-scale atmospheric circulation. While this provides a significant step in understanding the link between low-level cloud and climate change, there are still no conclusive answers according to the Met Office.Further research indicates that aerosols may also play a role in cloud formation. Tiny aerosol particles can “seed” clouds by providing the “nuclei” around which cloud droplets are formed. High concentrations of some aerosol types may affect the character of clouds by causing many tiny droplets to form rather than a few big ones. Clouds with more tiny droplets reflect more solar energy and tend to produce less rainfall. This spectacular “blue marble” image is a detailed true-color image of the entire Earth. Using a collection of satellite-based observations, scientists and visualizers stitched together months of observations of the land surface, oceans, sea ice, and clouds into a seamless, true-color mosaic of every square kilometre of our planet. These images are freely available to educators, scientists, museums, and the public.Much of the information contained in this image came from a single remote-sensing device-NASA’s Moderate Resolution Imaging Spectroradiometer, or MODIS. Flying over 700 km above the Earth onboard the Terra satellite, MODIS provides an integrated tool for observing a variety of terrestrial, oceanic, and atmospheric features of the Earth. The land and coastal ocean portions of these images are based on surface observations collected from June through September 2001 and combined, or composited, every eight days to compensate for clouds that might block the sensor’s view of the surface on any single day. Two different types of ocean data were used in these images: shallow water true color data, and global ocean color (or chlorophyll) data. Topographic shading is based on the GTOPO 30 elevation dataset compiled by the U.S. Geological Survey’s EROS Data Center. MODIS observations of polar sea ice were combined with observations of Antarctica made by the National Oceanic and Atmospheric Administration’s AVHRR sensor—the Advanced Very High Resolution Radiometer. The cloud image is a composite of two days of imagery collected in visible light wavelengths and a third day of thermal infra-red imagery over the poles. Terra/MODIS Visualization Date2002-02-08 The Visible Earth is part of the EOS Project Science Office, Goddard Space Flight Center.Low Level Met Office Credit: Clement, A.C., Burgman, R. and Norris, J.R., 2009: Observational and model evidence for positive low-level cloud feedback. Science, 325, 460-464, DOI: 10.1126/science.1171255 .
Methane (CH4) is the second largest GHG that is produced due to human activity. In addition to the methane produced from the increasing demand for protein in developing countries, land is often deforested in order to accommodate the production of protein, thus accelerating climate change.
CO2 CO2 is still, after significant scientific analysis, widely considered to be the largest contributing factor to climate change. Scientists have estimated the contribution to warming made by a range of gases, dust and solar radiation. They have a high level of certainty that greenhouse gases contribute the most to warming, with increases in CO2 as the greatest contributor with about 1.4 watts/meter2.Aerosols Methane, nitrous oxide, and halocarbons make smaller contributions. Scientists have a lower level of certainty about the contributions of reductions in stratospheric ozone and increases in tropospheric aerosols, which cool the Earth by 0.3 watts/meter2 and 0.9 watts/meter2 respectively. Solar radiation may also contribute to warming but scientists have a very low certainty about the level of this contribution.
Human Systems - CO2CO2 accounts for approximately 70% of anthropogenic contribution to GHG’s. The image above shows the estimated impact from the preindustrial era to the present, measured in watts/metre2.Other major anthropogenic emissions include Methane (CH4), Nitrous Oxide (N2O), and various gases that have a high global warming potential (GWP).
Clearly, there can be positive change and the human species is capable of making positive changes that do have global impact. The Montreal Protocol is an important example of this.
The Vienna Convention for the Protocol of the Ozone layer treaty was opened for signature on September 16, 1987, and entered into force on January 1, 1989As a result of the Montreal Protocol and its amendments, the concentrations of ozone-depleting substances in the lower atmosphere (troposphere) peaked around 1995 and are decreasing in both the troposphere and stratosphere. It is estimated these gases reached peak levels in the Antarctica stratosphere in 2001. However, these ozone-depleting substances typically have very long lifetimes in the atmosphere (more than 40 years). As a result of this slow decline, the ozone hole is estimated to annually very slowly decrease in area by about 0.1 to 0.2 percent for the next five to 10 years. This slow decrease is masked by large year-to-year variations caused by Antarctic stratospheric weather fluctuations. The recently completed 2006 World Meteorological Organization/United Nations Environment Programme Scientific Assessment of Ozone Depletion concluded the ozone hole recovery would be masked by annual variability for the near future and the ozone hole would fully recover in approximately 2065.http://www.nasa.gov/vision/earth/lookingatearth/ozone_record.html
CFC-11 levels have peaked and decreased. This represents the value of global collaboration.Although there are now quantitative constraints on the global magnitude of the emissions of some GHG’s, only educated guesses can be made as to the relative importance of their individual sources: enteric (cattle, etc.) and soil (rice, etc.) methanogens, biomass burning, fossil fuel mining, clathrates, etc. for CH4; soil and oceanic denitrifiers, biomass and fossil fuel combustion, etc. for N2O.The Montreal Protocol demonstrates that human systems intervention is possible and can achieve positive results.
CFC-12 stabilization and reduction is also seen
Some scientists estimate400 gigatons of methane locked in the frozen arctic tundra may be enough to start a chain reaction. The kind of warming the Arctic Council predicts is sufficient to melt the clathrates and release substantial quantities of greenhouse gas into the atmosphere.A growing body of data shows that more methane is emanating from the rapidly thawing Arctic Ocean than previously thought. This has caught the attention of many climate scientists. There are concerns that vast releases of huge quantities of sub-sea Arctic methane long trapped by a permafrost layer could accelerate climate change at unprecedented rates. In recent years, climate scientists have been concerned about a so-called “methane time bomb” on land, which would be detonated when warming Arctic temperatures melt permafrost and cause frozen vegetation in peat bogs and other areas to decay, releasing methane and carbon dioxide. Now come fears of a methane time bomb, part two, this one bursting from the sea floor of the shallow Arctic continental shelf. The Arctic sea floor contains a rich, decayed layer of vegetation from earlier eras when the continental shelf was not underwater.
This scenario could ultimately lead to mass extinction most planetary species, including humans.According to Gregory Ryskin, associate professor of chemical engineering at Northwestern University, "explosive clouds of methane gas, initially trapped in stagnant bodies of water and suddenly released, could have killed off the majority of marine life and land animals and plants at the end of the Permian era" — long before dinosaurs lived and died. Ryskin believes that methane may have been the driving force in previous catastrophic changes of the earth's climate, where 95 percent of marine species and 70 percent of land species were lost in - geologically speaking - the blink of an eye.Once triggered, this cycle could result in runaway global warming. Strong geologic evidence suggests something similar has happened at least twice before.The most recent of these catastrophes occurred about 55 million years ago in what geologists call the Paleocene-Eocene Thermal Maximum (PETM), when methane burps caused rapid warming and massive die-offs, disrupting the climate for more than 100,000 years.The granddaddy of these catastrophes occurred 251 million years ago, at the end of the Permian period, when a series of methane burps came close to wiping out all life on Earth.More than 94 percent of the marine species present in the fossil record disappeared suddenly as oxygen levels plummeted and life teetered on the verge of extinction. Over the ensuing 500,000 years, a few species struggled to gain a foothold in the hostile environment. It took 20 million to 30 million years for even rudimentary coral reefs to re-establish themselves and for forests to regrow. In some areas, it took more than 100 million years for ecosystems to reach their former healthy diversity.
Clearly, carbon dioxide sequestration is not the silver bullet solution to the quantity and magnitude of issues caused by climate change. Regardless of the arguments for and against the relative factors that impact global climate change, the fact that it is happening is indisputable. Glacial deterioration and polar ice cap deterioration are both well documented. Accordingly, it becomes increasingly clear that humanity must seek, through science, rational policy, and political solutions, a logical strategy to mitigate and reduce the human driven components of global climate change.
As of March 2009, CO2 in the Earth’s Atmosphere was at a concentration of 387 parts per million by volume. Carbon dioxide has no liquid state at pressures below 5.1 atmospheres. At 1 atmosphere (near mean sea level pressure), the gas deposits directly to a solid at temperatures below -78 °C and the solid sublimes directly to a gas above -78 °C. In its solid state, carbon dioxide is commonly called dry ice.
Why the Fluctuation in the Annual Cycle?Atmospheric concentrations of carbon dioxide fluctuate slightly with the change of the seasons, driven primarily by seasonal plant growth in the Northern Hemisphere. Concentrations of carbon dioxide fall during the northern spring and summer as plants consume the gas, and rise during the northern autumn and winter as plants go dormant, die and decay. Due to human systems such as the combustion of fossil fuels and deforestation, the concentration of atmospheric carbon dioxide has increased by about 35% since the industrial age. Emissions of CO2 by human activities are currently more than 130 times greater than the quantity emitted by volcanoes, amounting to about 27 billion tonnes per year.The oceansThere is about 50 times as much carbon dissolved in the oceans in the form of CO2 and carbonic acid, bicarbonate and carbonate ions as exists in the atmosphere. The oceans act as an enormous carbon sink, having "absorbed about one-third of all human-generated CO2 emissions to date.” Gas solubility decreases as the temperature of water increases and therefore the rate of uptake from the atmosphere decreases as ocean temperatures rise.Most of the CO2 taken up by the ocean forms carbonic acid in equilibrium with bicarbonate and carbonate ions. Some is consumed in photosynthesis by organisms in the water, and a small proportion of that sinks and leaves the carbon cycle. Increased CO2 in the atmosphere has led to increasing acidity (strictly, decreasing alkalinity) of seawater and there is some concern that this may adversely affect organisms living in the water. In particular, with decreasing alkalinity, the availability of carbonates for forming shells decreases.
Ice Core data supports the trend progression of data points gathered since 1958 at Mauna Loa.Analysis of proxy records, such as gas bubbles trapped in glacial ice, at a variety of places throughout the world suggests that the atmospheric concentration of CO2 has varied considerably over geologic time but generally remained in the range 280 +/- 10 ppm for several thousand years prior to the onset of the industrial era. Over the 420,000 years preceding the industrial era the concentration appears not to have exceeded 300 ppm (Barnola et al., 1999)An Italian monitoring site on Lampedusa Island, just south of Sicily, shows an increase from 360.8 ppm in 1993 to 371.3 ppm in 2000 (Chamard et al., 2001)(Figure1), and the CDIAC data files (http://cdiac.esd.ornl.gov) contain records from over 50 different sampling sites. It seems clear that the atmospheric concentration of CO2 is increasing and that it is now in a range that has not been experienced for perhaps 20 million years (IPCC, 2001).Source: THE INCREASING CONCENTRATION OF ATMOSPHERIC CO2: HOW MUCH, WHEN, AND WHY?Gregg Marland and Tom Boden, Environmental Sciences DivisionOak Ridge National Laboratory
The reason this slide is shown is, simply put, to put an exclamation mark on the complexity of climate change. The leaked emails prior to the Copenhagen meetings are an example of the high profile nature of the subject. It underscores mounting political importance of the issue for various levels of government.Carbon sinks are different ways that carbon dioxide is taken out of the atmosphere. Plants and algae take carbon dioxide out of the atmosphere and the oceans absorb carbon dioxide. These different mechanisms are referred to as carbon sinks. For millennia, the system of carbon sinks around the planet maintained a relative balance in the system.The last few centuries have ushered in a rapid growth in carbon dioxide emissions, largely from coal and subsequent to the coal age, oil and gas have added to the growth. Rapidly growing economic capacity in coal driven energy regions are placing strong and rapid upward pressure on carbon dioxide emissions. Additional deforestation also places stress on carbon dioxide sinks.Rainforests and oceans are the world’s most prodigious carbon sinks and absorb half the carbon dioxide humans release into the atmosphere.
This picture shows the Earth’s carbon “metabolism”, the rate at which plants absorbed carbon out of the atmosphere during the years 2001 and 2002. The map shows the global, annual average of the net productivity of vegetation on land and productivity of the oceanic carbon sink. Simply stated, the largest carbon sink rates of consumption are in Red and Yellow where carbon absorption rates can range from 2 to 3 kilograms of carbon consumed per square kilometre annually. Green areas reflect intermediate rates of carbon absorption. Blue and Purple areas represent lower rates of absorption while the areas of grey, such as the Arctic or Antarctic, are at the bottom of the scale.Although tropical rainforests are the chief carbon sinks on Earth, oceanic organisms still absorb about the same amount, making the ocean roughly as productive as the land. Unfortunately, climate change is reducing ocean life and as such, lessening the impact oceans have on the global carbon cycle.
The coastal waters of the Eastern Pacific are productive because wind and ocean currents allow nutrient-rich water from deep in the ocean to rise to the surface. The cold, rising water carries phosphates and nitrates, which act as fertilizer to the phytoplankton that grow in the sunlit waters at the ocean’s surface. Since phytoplankton are the base of the food chain, areas that support large phytoplankton blooms tend to have large fish populations.Off the coast of Vancouver Island, phytoplankton blooms tend to happen when winds blow down the coast from the north. The winds push the ocean’s surface water west, out to sea. Deep water rises up to replace the wind-blown surface water, and it carries the nutrients needed to support phytoplankton blooms.Charles G. Trick, et al, from the University of Western Ontario investigated everal species of diatoms and the genus Pseudonitzschia. This genus was found to produce domoic acid. Phytoplankton use this acid to fuel growth, but it is also highly toxic to many marine mammals and humans. Large blooms of Pseudonitzschia in coastal waters have implicated the toxin in the poisoning of sea lions via tainted shellfish. Studies suggest that when such phytoplankton blooms occur in mid-ocean waters, they do not produce the toxin. The mid-ocean water finding was disputed by Dr. Trick who said his Pseudonitzschia collected in mid-ocean and subjected to shipboard experiments produced plenty of domoic acid. 'We found there is a lot of toxin out there,' he said. These two viewpoints underscore the intense complexity of global oceanic ecosystems.
This slide gives you an idea of the amount of CO2 emissions per fuel type and adjusted for an equivalent heating value.
Contrast emissions data from 4 countries (USA, Italy, Norway, and China) Illustrate how the different countries and their varying economies and access to resources are reflected in their CO2 emissions. The table shows that per capita emissions from the USA are nearly 3 times those of the 2 European countries and 9 times those of China. Part of the differences among countries is seen in row 3 of the table, which reveals that China is the most dependent on coal while Norway derives a large fraction of its total energy supply from non-fossil sources. Row 4 of Table 2 gives insight into the structures and efficiencies of the economies. Countries with larger contributions from the primary and heavy, and hence energy-intensive, industries will have high emissions per unit of GDP while those in which the information and service industries play a larger role will have lower emissions per unit of GDP. Similarly, an economy characterized by low efficiency will have higher emissions per unit of GDP.
The US, as the second largest producer of CO2 emissions, will likely continue to battle with emissions, especially from coal fired electricity. The US Department of Energy notes that technological advancements have been realized in the last five years, the United States is eager to demonstrate carbon capture and storage technology on commercial plants that when operational, will be the cleanest coal-fired plants in the world.With such a huge part of the US electric power complex being fuelled by coal, and given that the US has the largest coal reserves in the World, it is likely that the US will continue to seek to establish clean coal technologies that, if modeled after existing clean coal plants in the US, may well involve extensive carbon dioxide capture and sequestration technologies.
China's GDP carbon dioxide emissions will rise with the growth of a middle class and wealth generation created by economic prosperity - China is likely to build a lot of coal fired plants.Other countries, like India, where coal is a primary fuel for energy, will continue to advance economically and increase their GDP carbon dioxide production - and they are equally likely to build more coal driven energy plants in order to accelerate economic growthPer GDP carbon dioxide production in the USA during the last decade has remained fairly constant, this pattern is repeated across most of the developed countries.Recent data indicates the growth in China's CO2 emissions are far outpacing previous estimates, making the goal of stabilizing atmospheric greenhouse gases even more difficult, according to a new analysis by economists at the University of California, Berkeley, and UC San Diego.Previous estimates, including those used by the Intergovernmental Panel on Climate Change (IPCC), say the region that includes China will see a 2.5 to 5 percent annual increase in CO2 emissions, the largest contributor to atmospheric greenhouse gases, between 2004 and 2010. The new UC analysis puts that annual growth rate for China to at least 11 percent for the same time period.
China emits more CO2 than any other country and it is growing emissions faster than any other country. Recent studies indicate that between 2004 and 2010, China’s emission growth rate will be closer to 11% instead of the forecasted 2.5 to 5% used in various protocols including Kyoto. Conservative forecasts place Chinese CO2 emission growth to be 600 million metric tonnes more than in the year 2000. This 600 million additional tonnes compares to the 116 million metric tons of emission reductions pledged by all the countries that signed the Kyoto Protocol.The United states was the largest single emitter of CO2 until 2006 when China took over as the leading carbon dioxide emitting country. China currently produces over 70% of its energy requirements through coal generated power and over 80% of China's electricity is derived from coal. China now builds the equivalent of two new coal-fired 500 Megawatt power plants every week. China leverages coal due to the abundance of the resource and also because it is far less expensive to use compared to an energy unit derived from gas or petroleumChina has the third largest coal reserves in the World. For China, coal is very cost effective per unit of energy compared to other energy alternatives. China gives priority to economic growth and is unlikely to agree to absolute ceilings. Given the population of China, it is likely they will advocate for per capita emissions.
The United States had the most emissions until 2006. Analyzed on a per capita basis, both Canada and the United States produce carbon dioxide at a rate nearly four times that of China on a per capita basis.This figure reflects 2002 data, but shows CO2 emissions on a per capita basis. It is probably a good reflection of why certain nations look to the per capita calculation when seeking to set carbon emission limits or goals. It is interesting to note Canada in a prominent position both in the OECD data from 2007 and in the United Nations data from 2002. This is largely due to a relatively small population size compared to the energy industry output and the creation of CO2 emissions.
OECD dataThe United States had the most emissions until 2006. Analyzed on a per capita basis, both Canada and the United States produce GHG’s at a rate nearly four times that of China on a per capita basis.
This is an image that conveys carbon dioxide emissions on a per capita basis. The “redder” the colour, the higher the gross emissions per capita.
This graph gives a view of how it looks with US, BRIC, and a few other countries that have significant emissions.Note that China and the United States drive about half the emissions on a global scale.
The most attractive method, from an environmental standpoint, is to capture the emissions at the point of creation, i.e. capture it at the smokestack. The TransAlta project will use technology designed to capture CO2 at the smokestack. This is a process designed by Alstrom and has demonstrated potential to capture over 90% of CO2 emissions.Sequestration and storage may be done in a variety of ways given the properties of CO2. Additionally, the removal of CO2 from commercial processes may result in significant economic impact by way of economic activities associated with infrastructure development. Enhanced technologies through research and development combined with continuing collaboration between business and government will continue to decelerate Alberta’s CO2 emissions.
Version of Supercritical Extraction Process.
CO2 at atmospheric temperatures and pressures assumes the form of a gas. Yet it can be pressurized to behave as a solid a.k.a. (dry ice) and may, under conditions of pressure and temperature, assume liquid properties and even supercritical fluid properties.
Carbon dioxide sequestration really means putting the CO2 in a place where it is stored and won't escape into the atmosphere. In the energy industry, CO2 sequestration is a method that captures, and delivers CO2 to storage sites in formations where the CO2 could be maintained on a geological time scale.Carbon dioxide can be sequestered in salt beds or dissolved in saline zones. In addition, it may be used to enhance coal bed methane production. A technique called enhanced oil recovery (EOR) involves injecting CO2 into a pay zone where oil recoverability can be enhanced, extending the life of various oilfields such as the Pembina field. EOR can extend the productivity from conventional formations throughout Alberta while reducing costs associated with CO2 sequestration via revenue streams from the additional conventional oil production, spurring further economic growth.
Carbon dioxide may be sequestered or “stored” in underground water formations where the water is brackish and has no practical use. Such brackish water deposits are not used for agricultural irrigation and are not suitable for human consumption. These sites provide geologically suitable storage sites for carbon dioxide storage.Enbridge is one company that fields core competencies that match the skill sets required for carbon dioxide sequestration. Carbon dioxide can be liquefied and pipelined, activities core to Enbridge, et al. Enbridge, et al, also have a great deal of experience in storing natural gas underground as part of existing gas distribution systems.
Another Visual of how carbon dioxide can be managed by putting it back in to formations deep in the Earth.
Initial sequestration truck line – currently in ERCB approval process (Spring 09) will begin at the site where the largest carbon dioxide growth will be experienced in Canada and will move the liquid carbon dioxide to points in the Central Alberta basin for geological sequestration and enhanced oil recovery operations.Impact Potential330,000 cars off the road initially2,600,000 cars off the road at capacityCapacity = 40,000 tonnes per dayThe ACTL is the world’s largest carbon capture and storage(CCS) project. Enhance Energy and North West Upgrading Inc. Have signed the letter of intent offered in June by the Government of Alberta. The Government of Alberta has awarded the AlbertaCarbon Trunk Line (ACTL) project $495 million. The ACTL was also awarded a total of $63.3 million fromthe Government of Canada’s ecoENERGY Technology Initiative and the Clean Energy Fund.
Leveraging carbon dioxide sequestration, the growth in oil-sands carbon emissions can be turned back to the point where the carbon footprint of a barrel of Canadian synthetic crude will be smaller than the carbon footprint of a barrel of Saudi Light.
In 1992 the Intergovernmental Panel on Climate Change (IPCC) constructed and analyzed 6 scenarios, i.e. 6 possible paths for future emissions of greenhouse gases (see IPCC, 1995). Over the 6 scenarios CO2 emissions in the year 2100 ranged from 4.6 x 10⁹ to 35.8 x 10⁹ t C. The IPCC “business-a-usual” scenario (IS92a) suggested 2100 emissions at 20.3 x 10⁹ t C. Using these emissions scenarios in several different models of the global carbon cycle, for the business-as-usual scenario the models suggested an atmospheric concentration approaching 700 ppm CO2 in 2100 (almost 2.5 times the preindustrial concentration). Even for the lowest emitting IPCC scenario, in which emissions peak at 8.8 x 10⁹ t C in 2025 before declining to 4.6 x 10⁹ t C in 2100, the atmospheric concentration of CO2 continued to climb throughout the century, reaching a value near 480 ppm by 2100. To see what it would take to get atmospheric CO2 to stabilize, Enting et al., 1994, conducted an interlaboratory model comparison exercise in which they 1.) described paths for the atmospheric concentration of CO2 stabilizing at various levels (at 350, 450, 550, 650, and 750 ppm), and 2.) asked scientists with mathematical models of the global carbon cycle to calculate what it would require in fossil-fuel emissions to get the atmospheric concentration to move along the prescribed paths to stable levels of CO2. The conclusion is that if the atmospheric concentration of CO2 is to stabilize at a level even as high as 750 ppm, the path of emissions is probably going to have to diverge significantly from the business-as-usual path by the early decades of this century.
An increase of 3 degrees or more would indicate that high latitudes (Canada & Arctic) would see increased moisture and water availability. Also, due to population centre locations, primarily in mid-latitudes and coastal areas, large populations will incur increased exposure to water stress.An increase of 4.5 degrees or greater would decrease water availability and increase drought in mid latitudes and semi-arid low latitudes.
Widespread coral bleaching and extinction of coral species would begin at relatively low levels of increased global temperatures. Species range shifting occurs along with extinction of vulnerable species and increased wildfire risk.At increasing temperatures coral mortality and global species extinction at very high levels could occur along with exacerbated changes in terrestrial biosphere and significant ecosystems.
Coastal changes from mild warming will result in increased damage from floods and storms. As temperatures rise, over a quarter of global wetlands could be lost. Since global population distributions are located disproportionately near coastal areas, millions of people could experience significant coastal flooding each year.
Distribution changes of disease vectors could have unpredictable consequences possibly increasing inter-species disease transmission. The influenza virus could be a component of these changes.As temperatures continue to rise, mortality due to heat waves, floods, and droughts are likely to increase followed by global scale malnutrition, diarrhoeal, cardiopulmonary and infectious disease rate increases.These factors will combine to place enormous stress on global health services.
Government and industry researchers are working to advance our ability to sustainably develop the oilsands while reducing CO2 emissions.
In addition to more conventional methods of CO2 remediation, new scientific solution sets may be achieved through applied research that examines different possibilities to reduce CO2 emissions.