Download to read offline
![International Journal of Software Engineering & Applications (IJSEA), Vol.3, No.3, May 2012
DOI : 10.5121/ijsea.2012.3304 35
UML2SAN: TOWARD A NEW SOFTWARE
PERFORMANCE ENGINEERING APPROACH
Ihab Sbeity1
, Mohamed Dbouk1
and Ilfat Ghamlouche2
1
Faculty of Sciences, Lebanese University, Lebanon
2
Faculty of Economical Sciences and Management, Lebanese University, Lebanon
ABSTRACT
Software Performance Engineering (SPE) has recently considered as an important issue in the software
development process. It consists on evaluate the performance of a system during the design phase. We have
recently proposed a new methodology to generate a Stochastic Automata Network (SAN) model from a
UML model, to consequently obtain performance predications from UML specifications. In this paper, we
expand our idea to cover more complex UML models taking in advantage the modularity of SAN in
modeling large systems. A formal description of the generation process is presented. The new extension
gives rise to a serious approach in SPE that we call UML2SAN.
KEYWORD
Software engineering, Performance software engineering, UML, Stochastic Automata Network.
1. INTRODUCTION
Software engineering has traditionally focused on functional requirements and how to build
software that has few bugs and can be easily maintained. Most design approaches include non-
functional requirements among the elements of the analysis of a system, but little attention has
usually been paid to how these requirements can be dealt with through the development life-cycle
[9].
Over the two last decades, the performance analysis of software systems during the design
process is becoming widely suitable. The benefit comes from getting quantitative predications
about the system before being implemented. That reduces the possibility of unexpected
shortcoming on the system functionality. .Moreover, an important methodology, initially
introduced by Smith [11], starts today to cover a large place in the software engineering area.
This methodology, called Performance Software Engineering (SPE), consists essentially on
introducing some techniques allowing obtaining performance predictions of the system basing on
the design model.
Several approaches have been introduced to provide SPE techniques. Some of them propose to
derive from a UML (Unified Modeling Language) model a separate performance model [5, 8,](https://image.slidesharecdn.com/3312ijsea04-210129055555/85/UML2SAN-Toward-A-New-Software-Performance-Engineering-Approach-1-320.jpg)
![International Journal of Software Engineering & Applications (IJSEA), Vol.3, No.3, May 2012
36
10]. In addition to the classification of UML as a universal modeling language widely used by
designers, it is apparently possible to attach performance analysis tools to UML notations in a
relatively straightforward manner. Our recent work in [10], initiates a preliminary methodology to
derive from UML a Stochastic Automata Network (SAN) model, a Markov-based model used to
generate performance predictions. The SAN formalism [7] is usually quite attractive when
modeling a system with several parallel cooperative activities. In addition, SAN permits to
represent a system in modular way. A SAN model is a state-transition graph having a strong
likeness with the UML state-chart diagram.
The purpose of this work is to make a step forward toward proposing a general heuristic to derive
a SAN model from complex UML model. In [10], our methodology is based on the UML state-
diagram, with transitions’ edges only labeled by unconditional triggers and actions. In this paper,
we show how to deal with conditional triggers. In addition, we show the impact of the
collaboration diagram in the derivation process. The demarche is also informally presented,
however, this works enlarge the possibility to propose a formal demarche.
The rest of this paper is organized as follows. Section 2 recalls the definition of the SAN as
modular formalism. Section 3 presents a UML producer/consumer example with conditional
triggers in the stat-chat diagram. This section shows the essential UML diagrams need for the
derivation of the SAN model. Section 4 explores how the UML model maps into SAN basing on
our case study. Section 5 concludes our paper and describes our ongoing works.
2. STOCHASTIC AUTOMATA NETWORKS
Stochastic Automata Networks (SAN) is a structured Markovian formalism, i.e., it describes
continuous-time Markovian models not as a flat system, but as a structured (modular and
organized) collection of subsystems. The basic modeling principle of SAN is to describe a whole
system by a collection of subsystems with an independent behavior and occasional
interdependencies. Each subsystem is described as a stochastic automaton, i.e., an automaton in
which the transitions are labeled with probabilistic and timing information. Hence, one can
always build a continuous-time stochastic process related to SAN [2, 12].
The global state of a SAN model is defined by the cartesian product of the local states of all
automata. There are two types of events that change the global state: local and synchronizing
events. Local events change the SAN global state passing from a global state to another that
differs only by one local state. Synchronizing events can change simultaneously more than one
local state, i.e., two or more automata can change their local states simultaneously. In other
words, the occurrence of a synchronizing event forces all concerned automata to fire a transition
corresponding to this event.
Each event is represented by an identifier and a rate of occurrence, which describes how often a
given event will occur. Each transition may be fired as result of the occurrence of any number of
events. In general, non-determinism among possible different events is dealt with according to
Markovian behavior, i.e., any of the events may occur and their occurrence rates define the
relative frequency with which each of them will occur. However, if, from a given local state, the
occurrence of a given event can lead to more than one state, then an additional routing probability](https://image.slidesharecdn.com/3312ijsea04-210129055555/85/UML2SAN-Toward-A-New-Software-Performance-Engineering-Approach-2-320.jpg)
![International Journal of Software Engineering & Applications (IJSEA), Vol.3, No.3, May 2012
37
must be informed to each possible destination state. The absence of routing probability is
tolerated if only one transition can be fired by an event from a given local state.
The other possibility of interaction among automata is the use of functional rates. Any event
occurrence rate may be expressed by a constant value or a function of the state of other automata.
By contrast with synchronizing events, functional rates are one-way interaction among automata,
since it affects only the automaton where it appears.
Figure 1 presents a SAN model with two automata, one synchronizing event (e2) with a constant
rate, and four local events, being three with constant rates (e3, e4 and e5) and one with a
functional rate (e1). In this model the rate of the event e1 is a functional rate f semantically
explained below, and described inside Figure 1 using the SAN notation. The interpretation of
such a function can be viewed as the evaluation of an expression of non-typed programming
languages, e.g., C language, where each comparison is evaluated to value 1 (true) or value 0
(false).
Figure 1 : Example of a SAN model
The firing of the transition from states 0(1)
to 1(1)
occurs with rate λ if
automaton A(2)
is in state 0(2)
, or γ if automaton A(2)
is in state 2(2)
. If
automaton A(2)
is in state 1(2)
, the transition from states 0(1)
to 1(1)
does not
occur (rate equal to 0). It is important to observe that the use of functions
allows a compact and flexible way to describe in one single event (local or
synchronized) alternative behaviors [2]. The advantage of using functions will
be obviously clear in our demarche of derivation a SAN model from UML
model.](https://image.slidesharecdn.com/3312ijsea04-210129055555/85/UML2SAN-Toward-A-New-Software-Performance-Engineering-Approach-3-320.jpg)
![International Journal of Software Engineering & Applications (IJSEA), Vol.3, No.3, May 2012
38
Figure 2: Equivalent Markov chain
Figure 2 shows the equivalent Markov chain model of the SAN model in Figure 1. Assuming the
state 0(1)
0(2)
is an initial state, only 5 of the 6 states in this Markov chain model are reachable. In
order to express the reachable global states of a SAN model, it is possible to define a
(reachability) function. The reachable states could also be computed by analyzing all possible
firing sequences, starting from a given reachable initial state. For the model in Figure 1, the
reachability function excludes the global state 1(1)
1(2)
, thus:
One of greatest advantages of the SAN formalism in comparison with straightforward Markov
chain, and even other structured formalism is to have since its first definition [7] a compact form
to store the infinitesimal generator of the equivalent Markov chain. Instead of storing an (usually)
huge matrix, the SAN formalism defines a storage based on a tensor formula of considerably
smaller matrices. Tensor, or Kronecker, algebra [3,4] is defined as a set of multi-dimensional
structures (tensors) and algebraic operations. It usually allows the very compact description of
quite large and complex matrices. Also, computation can be handled without ever generating
extensively the equivalent Markov chain.
3. A UML PRODUCER/CONSUMER MODEL
The Unified Modeling Language (UML) [6] is a graphically based notation, which is being
developed by the Object Management Group as a standard means of describing software oriented
designs. It contains several different types of diagram, which allow different aspects and
properties of a system design to be expressed. Diagrams must be supplemented by textual and
other descriptions to produce complete models. For example, a use case is really the description
of what lies inside the ovals of a use case diagram, rather than just the diagram itself.
Our concern in the approach we propose is basically UML models where the use of time has
significance. In fact, it is evident to say that the need to predict performance is applied only to
time-driven application, i.e. applications where objects actions are triggered by time progress.](https://image.slidesharecdn.com/3312ijsea04-210129055555/85/UML2SAN-Toward-A-New-Software-Performance-Engineering-Approach-4-320.jpg)
![International Journal of Software Engineering & Applications (IJSEA), Vol.3, No.3, May 2012
Thus, here we present an example of such time
producer/consumer model. The model we propose is
in [8]. In our model presentation we only focus o
behavior of the system, i.e. the class diagram (section 3.1),
diagrams (section 3.2).
3.1. The class diagram
A UML class model defines the essential types of object available to build a system; each class is
described by a rectangle with a name. This can be refined by adding compartments below the
name which list the attributes and operations contained in each instanc
this class. Classes are linked by lines known as
knows about the other. The direction of this knowledge is known as the
association. In an implementation an
reference variable of the type of the other class. Sometimes navigability has to be two ways, but it
more often one way. This can be shown by adding arrow head t
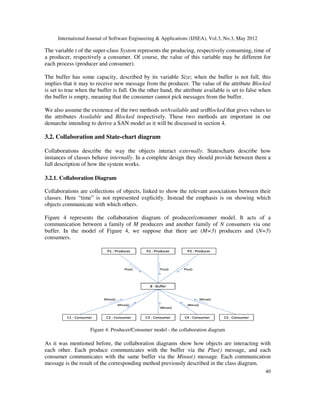
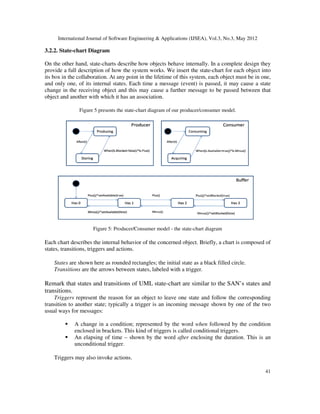
Figure 3: Producer/Consumer model
The class model of our producer/consumer application is presented in Figure 3.
system with two kinds of processes, producer and consumer that communicate via a buffer.
A producer spends time producing
Plus().
A consumer picks a message from the buffer, via the method
consuming it.
International Journal of Software Engineering & Applications (IJSEA), Vol.3, No.3, May 2012
an example of such time-driven applications which describes a
producer/consumer model. The model we propose is a more detailed extension of the model seen
]. In our model presentation we only focus of diagrams that describe the structure and the
e class diagram (section 3.1), and collaboration and state
class model defines the essential types of object available to build a system; each class is
described by a rectangle with a name. This can be refined by adding compartments below the
name which list the attributes and operations contained in each instance of (object derived from)
Classes are linked by lines known as associations which indicate that one of the classes
knows about the other. The direction of this knowledge is known as the navigability
association. In an implementation an association typically corresponds to one class having a
reference variable of the type of the other class. Sometimes navigability has to be two ways, but it
more often one way. This can be shown by adding arrow head to the end(s) of the association [
: Producer/Consumer model - the class diagram
producer/consumer application is presented in Figure 3. We assu
system with two kinds of processes, producer and consumer that communicate via a buffer.
A producer spends time producing a message before sending it to the buffer due to the method
consumer picks a message from the buffer, via the method Minus(), and then spends some time
International Journal of Software Engineering & Applications (IJSEA), Vol.3, No.3, May 2012
39
which describes a
extension of the model seen
f diagrams that describe the structure and the
and state-chart
class model defines the essential types of object available to build a system; each class is
described by a rectangle with a name. This can be refined by adding compartments below the
e of (object derived from)
which indicate that one of the classes
navigability of the
association typically corresponds to one class having a
reference variable of the type of the other class. Sometimes navigability has to be two ways, but it
o the end(s) of the association [8].
We assume a
system with two kinds of processes, producer and consumer that communicate via a buffer.
the buffer due to the method
, and then spends some time](https://image.slidesharecdn.com/3312ijsea04-210129055555/85/UML2SAN-Toward-A-New-Software-Performance-Engineering-Approach-5-320.jpg)
![International Journal of Software Engineering Applications (IJSEA), Vol.3, No.3, May 2012
42
Actions are prefixed with a forward slash and carried out before entering the new state. These
actions may be local method of the object where the trigger is fired, or a method of another
object. In the second case, the invoked action represents then a trigger in the chart corresponding
to the concerned object.
In order to simplify the process of derivation in section 5, we propose some definitions.
Definition 1
A trigger is called of type T1, if it does not fire an action.
Definition 2
A trigger is called of type T2, if it fires one or more actions.
Back to Figure 5, the behavior of each object type is described by a chart. For example, a
producer alternates between two states: the state where it is producing a message and the state
where it is storing the message in the buffer. The transition from the Producing state to the
Storing state is labeled by the trigger after(t), e.g. t is the class variable. This trigger does not fire
any action, it is of type T1. The trigger when[b.Blocked = false], labeling the reverse transition,
invoke the action b.Plus() in the chart corresponding to buffer. This trigger is of type T2.
It is important to notice that triggers of type T1 look like local events in a SAN model. A trigger
of type T2 seems resembling SAN synchronizing event.
Definition 3
Let t be a trigger of type T2, we call Seq(t) the set of different action sequences that may be fired
by t.
Card(Seq(t)) is the cardinality of Seq(t) and it is equal to the number of sequences in Seq(t).
According to definition 3, consider the type T2 trigger t = when[b.Blocked = false], the set
Seq(t), is identified by taking into consideration the different sequence of actions that the trigger
may fire. In our example, Seq(t) is composed of three sequences S1, S2 amd S3 such that:
Seq(t) = { S1: when[b.Blocked = false] b.Plus() setAvailable(True)
S2: when[b.Blocked = false] b.Plus()
S3: when[b.Blocked = false] b.Plus() setBlocked(True) }
In fact, when the event when[b.Blocked = false] is invoked, it fires the action b.Plus(). However
the firing of this action may also fires another action depending on the state of the the state-chart
Buffer. If the local state is Has0, setAvailable(True) is fired, if the local state is Has1 no other
action is fired, and if the local state is Has2, the setBlocked(True) is fired. Card(Seq(t)) is equal to
3.](https://image.slidesharecdn.com/3312ijsea04-210129055555/85/UML2SAN-Toward-A-New-Software-Performance-Engineering-Approach-8-320.jpg)
![International Journal of Software Engineering Applications (IJSEA), Vol.3, No.3, May 2012
43
Moreover, states of the buffer represent the number of messages available in the buffer. The
number of these states is equal to the buffer size (here, size = 3). Triggers labeling transitions of
the chart buffer, i.e. Plus() and Minus(), are actions invoked by a producer or a consumer. We
underline that the action setAvailable(), respectively setBlocked(), change the value of the
Boolean variable Available, respectively Blocked, that affects the firing of the trigger
when[b.Available= true] in the chart consumer, respectively the trigger when[b.Blocked = false]
in the char producer. This means that at any time, we need to know the value of the variable in
order to enable or disable the firing of the trigger. Recalling a SAN model, this phenomenon
gives the impression to be similar to a functional rate that depends on the variable’s value. We
call such variables, i.e. which affect the firing of a trigger, affecting variables.
The overall state of a system will be the combination of all the current internal state of its objects,
plus the current values of any relevant attributes, i.e. Blocked and Available. As we mentioned
before, intuitively, readers may sense a strong similarity to the stochastic automata networks
behavior. A SAN automaton is a set of states, transitions and events. The global state of a SAN is
a combination of the local states of its automata. The powerful point of mapping the state-chart
diagram into a SAN model is that the mapping process will not produce fundamental changes in
the graph structure, only some information needed to represent relevant attributes and the time
spent in a state is required. That may help designers to better understand the SAN performance
model which is an emphasized advantage of our approach.
4. Generating the SAN model
In the previous section, we highlighted the basic elements on which our generation process is
principally based. In this section, we present how a SAN model is directly generated for the UML
producer/consumer, giving a sense for a systematical generation process. The SAN automata are
these corresponding to UML state-charts and these necessary to represent the affecting variables
value. The generation process is composed of multiple steps. As it is shown in [10], it is
important to see that there is an intuitive mapping of the UML state-chat into SAN. A state-chart
automaton is mapped into SAN automaton (states and transitions). The state-chart events are
translated as SAN events. However, there is still some work to achieve in order to take into
consideration the affecting variables. In the following, we formally describe the procedure of the
generation of the SAN model and we illustrate each step of the procedure basing on our
producer/consumer model. In the following, each subsection represents a step in our generation
process. Some of these steps are formally described; however others are presented basing on
intuitive observations.
4.1. Step 1: States/transitions mapping
The first step is to create SAN automata that correspond to state-charts. Only states and
transitions are created in this step. The labels of SAN transitions, i.e. events, are created in step 3.
Step 1: Statechart -- States/Transitions Mapping
For each automaton X of the UML state-chart, create a SAN automata Y as following:
Omit the initial state.
For each state IX in X, create the state IY in Y.
For each transition in X from state IX to state JX, create a transition from IY to JY in Y.](https://image.slidesharecdn.com/3312ijsea04-210129055555/85/UML2SAN-Toward-A-New-Software-Performance-Engineering-Approach-9-320.jpg)
![International Journal of Software Engineering Applications (IJSEA), Vol.3, No.3, May 2012
Step 3.b
For each trigger t of the UML state
For each sequence of actions
create a SAN event eS as following:
For each automaton X of the UML state
automaton created in step 1)
For each transition in X
Add eS to the transition from state I
For each action a in S
If a is an affecting method then
Add eS to the corresponding automata (of the affecting variable)
Else
For each automaton X of the UML state
SAN automaton created in step 1)
For each transition in X from state I
Add eS to the transition from state I
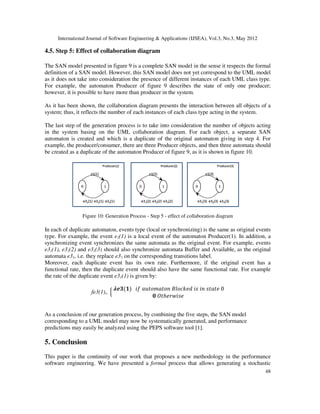
Applying the third step to our producer/consumer example gives raise to the graph
The automata presented in this figure are the set of aut
Figure 8: Generation Process
For example, the local event e1
trigger after(t) of the Producer state
trigger is of type T1. The trigger
SAN events, i.e. e31, e32 and e3
actions (see section 3.2.2). Each
corresponds to the sequence S1:
sequence involves methods in the state
state-chart Buffer, i.e. b.Plus() , and a method that invoques a change in the value of the affecting
International Journal of Software Engineering Applications (IJSEA), Vol.3, No.3, May 2012
Step 3.b : Synchronizing events Generation
For each trigger t of the UML state-chart
For each sequence of actions S in Seq (t)
as following:
For each automaton X of the UML state-chart and Y its corresponding SAN
automaton created in step 1)
For each transition in X from state IX to state JX, labeled by t
to the transition from state IY to state JY
If a is an affecting method then
to the corresponding automata (of the affecting variable)
For each automaton X of the UML state-chart and Y its corresponding
SAN automaton created in step 1)
For each transition in X from state IX to state JX, labeled by a
to the transition from state IY to state JY
Applying the third step to our producer/consumer example gives raise to the graph
The automata presented in this figure are the set of automata created in step 1 and 2.
: Generation Process - Step 3 - events generation
e1 of the SAN automaton Producer is the corresponding of the
of the Producer state-chart. This event is generated according to Step 3.a, as the
The trigger t = when[b.Blocked = false], of type T2, gives raise for three
e33. Recall that the set Seq(t) contains three different sequences of
Each event corresponds to a sequence. For example, The event
corresponds to the sequence S1: when[b.Blocked = false] b.Plus() setAvailable(True
sequence involves methods in the state-chart Producer, i.e. when[b.Blocked = false]
, and a method that invoques a change in the value of the affecting
International Journal of Software Engineering Applications (IJSEA), Vol.3, No.3, May 2012
46
SAN
chart and Y its corresponding
Applying the third step to our producer/consumer example gives raise to the graph of figure 8.
omata created in step 1 and 2.
is the corresponding of the
chart. This event is generated according to Step 3.a, as the
, gives raise for three
contains three different sequences of
event corresponds to a sequence. For example, The event e31
setAvailable(True). This
when[b.Blocked = false], and the
, and a method that invoques a change in the value of the affecting](https://image.slidesharecdn.com/3312ijsea04-210129055555/85/UML2SAN-Toward-A-New-Software-Performance-Engineering-Approach-12-320.jpg)
![International Journal of Software Engineering Applications (IJSEA), Vol.3, No.3, May 2012
variable Available. Thus, the event e3
and Available, and it labels the corresponding transitions.
4.4. Step 4: Events’ rates
Basing on Step 3, it may be noticed that two categories of events may be underlined: events
corresponding to the “when” methods, e.g. the event e3
“when” method, e.g. the event e1
occurrence of a sequence of methods.
For each event e that does not correspond to the
an event corresponding to the when
event e31 that corresponds to the sequence
setAvailable(True). The event e3
local state 0, i.e. the state that corresponds to the value False of the affecting variable Blocked.
Thus the rate assigned to the event
fe3=
It is obvious to see that the concept of functional rate is a powerful point of using stochastic
automata network.
Finally, recall that events e31, e3
assigned the same rate, i.e. fe3.
Producer/Consumer model is given by figure 9.
Figure 9
International Journal of Software Engineering Applications (IJSEA), Vol.3, No.3, May 2012
. Thus, the event e31 synchronizes the three SAN automata Producer, Buffer
and Available, and it labels the corresponding transitions.
Basing on Step 3, it may be noticed that two categories of events may be underlined: events
methods, e.g. the event e31, and events that do not correspond to the
e1. Recall that the method when has a condition and it controls the
occurrence of a sequence of methods.
that does not correspond to the when method, the rate λe is assigned. However,
when method is assigned a functional rate. Let us reconsider the
that corresponds to the sequence when[b.Blocked = false]
e31 should be eligible to fire only if the automaton Blocked is in its
local state 0, i.e. the state that corresponds to the value False of the affecting variable Blocked.
Thus the rate assigned to the event e31 is the function rate fe3 described as following:](https://image.slidesharecdn.com/3312ijsea04-210129055555/85/UML2SAN-Toward-A-New-Software-Performance-Engineering-Approach-13-320.jpg)

The document discusses a new methodology called UML2SAN aimed at improving software performance engineering (SPE) by generating stochastic automata network (SAN) models from UML specifications. This method allows for more complex UML models to be evaluated for performance during the design phase, reducing potential functionality issues. The paper presents a structured approach to derive SAN from UML, focusing on integrating conditional triggers and illustrates the process with a producer/consumer example.