The document describes several graph layout programs including dot, neato, twopi, circo, fdp, and sfdp. These programs take graph files as input and output drawings of the graphs in various formats like PostScript, SVG, and bitmap images. The programs use different algorithms to determine the layout, such as hierarchies for dot, springs for neato and fdp, radial layouts for twopi, and circular layouts for circo. The document provides details on the command line syntax, input graph file format, and attributes that control the graph drawing output.
![DOT(1) DOT(1)
NAME
dot − filter for drawing directed graphs
neato − filter for drawing undirected graphs
twopi − filter for radial layouts of graphs
circo − filter for circular layout of graphs
fdp − filter for drawing undirected graphs
sfdp − filter for drawing large undirected graphs
SYNOPSIS
dot [−(G|N|E)name=value] [−Tlang] [−l libfile] [−o outfile] [−v] [−V] [files]
neato [−(G|N|E)name=value] [−Tlang] [−l libfile] [−n[1|2]] [−o outfile] [−v] [−V] [files]
twopi [−(G|N|E)name=value] [−Tlang] [−l libfile] [−o outfile] [−v] [−V] [files]
circo [−(G|N|E)name=value] [−Tlang] [−l libfile] [−o outfile] [−v] [−V] [files]
fdp [−(G|N|E)name=value] [−Tlang] [−l libfile] [−o outfile] [−v] [−V] [files]
sfdp [−(G|N|E)name=value] [−Tlang] [−l libfile] [−o outfile] [−v] [−V] [files]
DESCRIPTION
dot draws directed graphs. It works well on DAGs and other graphs that can be drawn as hierarchies. It
reads attributed graph files and writes drawings. By default, the output format dot is the input file with lay-
out coordinates appended.
neato draws undirected graphs using ‘‘spring’’ models (see Kamada and Kawai, Information Processing
Letters 31:1, April 1989). Input files must be formatted in the dot attributed graph language. By default,
the output of neato is the input graph with layout coordinates appended.
twopi draws graphs using a radial layout (see G. Wills, Symposium on Graph Drawing GD’97, September,
1997). Basically, one node is chosen as the center and put at the origin. The remaining nodes are placed on
a sequence of concentric circles centered about the origin, each a fixed radial distance from the previous
circle. All nodes distance 1 from the center are placed on the first circle; all nodes distance 1 from a node
on the first circle are placed on the second circle; and so forth.
circo draws graphs using a circular layout (see Six and Tollis, GD ’99 and ALENEX ’99, and Kaufmann
and Wiese, GD ’02.) The tool identifies biconnected components and draws the nodes of the component on
a circle. The block-cutpoint tree is then laid out using a recursive radial algorithm. Edge crossings within a
circle are minimized by placing as many edges on the circle’s perimeter as possible. In particular, if the
component is outerplanar, the component will have a planar layout.
If a node belongs to multiple non-trivial biconnected components, the layout puts the node in one of them.
By default, this is the first non-trivial component found in the search from the root component.
fdp draws undirected graphs using a ‘‘spring’’ model. It relies on a force-directed approach in the spirit of
Fruchterman and Reingold (cf. Software-Practice & Experience 21(11), 1991, pp. 1129-1164).
sfdp also draws undirected graphs using the ‘‘spring’’ model described above, but it uses a multi-scale
approach to produce layouts of large graphs in a reasonably short time.
OUTPUT FORMATS
Dot uses an extensible plugin mechanism for its output renderers, so to see what output formats your instal-
lation of dot supports you can use ‘‘dot −Txxx’’ (where xxx is an unlikely format) and check the warning
message. Also, The plugin mechanism supports multiple implementations of the output formats. To see
what variants are available, use, for example: ‘‘dot −Tpng:’’ and to force a particular variant, use, for exam-
ple: ‘‘dot −Tpng:gd’’
Traditionally, dot supports the following: −Tps (PostScript), −Tsvg −Tsvgz (Structured Vector Graphics),
−Tfig (XFIG graphics), −Tmif (FrameMaker graphics), −Thpgl (HP pen plotters), and −Tpcl (Laserjet
printers), −Tpng −Tgif (bitmap graphics), −Tdia (GTK+ based diagrams), −Timap (imagemap files for
httpd servers for each node or edge that has a non(hynull "href" attribute.), −Tcmapx (client-side
imagemap for use in html and xhtml). Additional less common or more special-purpose output formats can
be found at http://www.graphviz.org/cvs/doc/info/output.html.)
23 August 2004 1](https://image.slidesharecdn.com/twopi-1-120718003329-phpapp02/85/Twopi-1-1-320.jpg)
![DOT(1) DOT(1)
NAME
dot − filter for drawing directed graphs
neato − filter for drawing undirected graphs
twopi − filter for radial layouts of graphs
circo − filter for circular layout of graphs
fdp − filter for drawing undirected graphs
sfdp − filter for drawing large undirected graphs
SYNOPSIS
dot [−(G|N|E)name=value] [−Tlang] [−l libfile] [−o outfile] [−v] [−V] [files]
neato [−(G|N|E)name=value] [−Tlang] [−l libfile] [−n[1|2]] [−o outfile] [−v] [−V] [files]
twopi [−(G|N|E)name=value] [−Tlang] [−l libfile] [−o outfile] [−v] [−V] [files]
circo [−(G|N|E)name=value] [−Tlang] [−l libfile] [−o outfile] [−v] [−V] [files]
fdp [−(G|N|E)name=value] [−Tlang] [−l libfile] [−o outfile] [−v] [−V] [files]
sfdp [−(G|N|E)name=value] [−Tlang] [−l libfile] [−o outfile] [−v] [−V] [files]
DESCRIPTION
dot draws directed graphs. It works well on DAGs and other graphs that can be drawn as hierarchies. It
reads attributed graph files and writes drawings. By default, the output format dot is the input file with lay-
out coordinates appended.
neato draws undirected graphs using ‘‘spring’’ models (see Kamada and Kawai, Information Processing
Letters 31:1, April 1989). Input files must be formatted in the dot attributed graph language. By default,
the output of neato is the input graph with layout coordinates appended.
twopi draws graphs using a radial layout (see G. Wills, Symposium on Graph Drawing GD’97, September,
1997). Basically, one node is chosen as the center and put at the origin. The remaining nodes are placed on
a sequence of concentric circles centered about the origin, each a fixed radial distance from the previous
circle. All nodes distance 1 from the center are placed on the first circle; all nodes distance 1 from a node
on the first circle are placed on the second circle; and so forth.
circo draws graphs using a circular layout (see Six and Tollis, GD ’99 and ALENEX ’99, and Kaufmann
and Wiese, GD ’02.) The tool identifies biconnected components and draws the nodes of the component on
a circle. The block-cutpoint tree is then laid out using a recursive radial algorithm. Edge crossings within a
circle are minimized by placing as many edges on the circle’s perimeter as possible. In particular, if the
component is outerplanar, the component will have a planar layout.
If a node belongs to multiple non-trivial biconnected components, the layout puts the node in one of them.
By default, this is the first non-trivial component found in the search from the root component.
fdp draws undirected graphs using a ‘‘spring’’ model. It relies on a force-directed approach in the spirit of
Fruchterman and Reingold (cf. Software-Practice & Experience 21(11), 1991, pp. 1129-1164).
sfdp also draws undirected graphs using the ‘‘spring’’ model described above, but it uses a multi-scale
approach to produce layouts of large graphs in a reasonably short time.
OUTPUT FORMATS
Dot uses an extensible plugin mechanism for its output renderers, so to see what output formats your instal-
lation of dot supports you can use ‘‘dot −Txxx’’ (where xxx is an unlikely format) and check the warning
message. Also, The plugin mechanism supports multiple implementations of the output formats. To see
what variants are available, use, for example: ‘‘dot −Tpng:’’ and to force a particular variant, use, for exam-
ple: ‘‘dot −Tpng:gd’’
Traditionally, dot supports the following: −Tps (PostScript), −Tsvg −Tsvgz (Structured Vector Graphics),
−Tfig (XFIG graphics), −Tmif (FrameMaker graphics), −Thpgl (HP pen plotters), and −Tpcl (Laserjet
printers), −Tpng −Tgif (bitmap graphics), −Tdia (GTK+ based diagrams), −Timap (imagemap files for
httpd servers for each node or edge that has a non(hynull "href" attribute.), −Tcmapx (client-side
imagemap for use in html and xhtml). Additional less common or more special-purpose output formats can
be found at http://www.graphviz.org/cvs/doc/info/output.html.)
23 August 2004 1](https://image.slidesharecdn.com/twopi-1-120718003329-phpapp02/75/Twopi-1-1-2048.jpg)
![DOT(1) DOT(1)
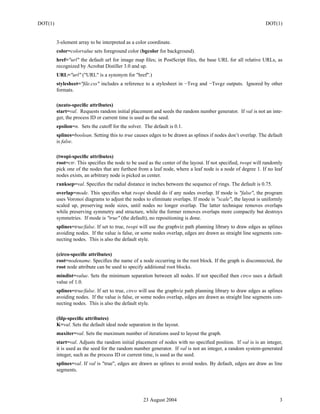
GRAPH FILE LANGUAGE
Here is a synopsis of the graph file language, traditionally using the extension .dot, for graphs:
[strict] (graph|digraph) name { statement-list }
Is the top level graph. If the graph is strict then multiple edges are not allowed between the same pairs of
nodes. If it is a directed graph, indicated by digraph, then the edgeop must be "−>". If it is an undirected
graph then the edgeop must be "−−". Statements may be:
name=val;
node [name=val];
edge [name=val];
Set default graph, node, or edge attribute name to val. Any subgraph, node, or edge appearing after this
inherits the new default attributes.
n0 [name0=val0,name1=val1,...]; Creates node n0 (if it does not already exist) and sets its attributes
according to the optional list.
n0 edgeop n1 edgeop ... edgeop nn [name0=val0,name1=val1,...];
Creates edges between nodes n0, n1, ..., nn and sets their attributes according to the optional list. Creates
nodes as necessary.
[subgraph name] { statement-list }
Creates a subgraph. Subgraphs may be used in place of n0, ..., nn in the above statements to create edges.
[subgraph name] is optional; if missing, the subgraph is assigned an internal name.
Comments may be /*C-like*/ or //C++-like.
Attribute names and values are ordinary (C-style) strings. The following sections describe attributes that
control graph layout.
GRAPH ATTRIBUTES
size="x,y" sets bounding box of drawing in inches.
page="x,y" sets the PostScript pagination unit.
ratio=f sets the aspect ratio to f which may be a floating point number, or one of the keywords fill, com-
press, or auto.
layout=engine indicates the preferred layout engine ("dot", "neato", fdp" etc) overriding the default from
the basename of the command or the -K commandline option.
margin=f sets the page margin (included in the page size).
nodesep=f sets the minimum separation between nodes.
ranksep=f sets the minimum separation between ranks.
ordering=out constrains order of out-edges in a subgraph according to their file sequence.
rankdir=LR|RL|BT requests a left-to-right, right-to-left, or bottom-to-top, drawing.
pagedir=[TBLR][TBLR] sets the major and minor order of pagination.
rank=same (or min or max) in a subgraph constrains the rank assignment of its nodes. If a subgraph’s
name has the prefix cluster, its nodes are drawn in a distinct rectangle of the layout. Clusters may be
nested.
rotate=90 sets landscape mode. (orientation=land is backward compatible but obsolete.)
center=n a non-zero value centers the drawing on the page.
nslimit=f or mclimit=f adjusts the bound on the number of network simplex or mincross iterations by the
given ratio. For example, mclimit=2.0 runs twice as long.
layers="id:id:id:id" is a sequence of layer identifiers for overlay diagrams. The PostScript array variable
layercolorseq sets the assignment of colors to layers. The least index is 1 and each element must be a
23 August 2004 2](https://image.slidesharecdn.com/twopi-1-120718003329-phpapp02/85/Twopi-1-2-320.jpg)
![DOT(1) DOT(1)
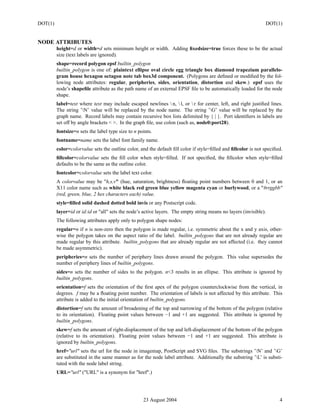
COMMAND LINE OPTIONS
−G sets a default graph attribute.
−N sets a default node attribute.
−E sets a default edge attribute. Example: −Gsize="7,8" −Nshape=box −Efontsize=8
−lfile loads custom PostScript library files. Usually these define custom shapes or styles. If −l is given by
itself, the standard library is omitted.
−Tlang sets the output language as described above.
−n[1|2] (no-op) If set, neato assumes nodes have already been positioned and all nodes have a pos attribute
giving the positions. It then performs an optional adjustment to remove node-node overlap, depending on
the value of the overlap attribute, computes the edge layouts, depending on the value of the splines
attribute, and emits the graph in the appropriate format. If num is supplied, the following actions occur:
num = 1
Equivalent to −n.
num > 1
Use node positions as specified, with no adjustment to remove node-node overlaps, and use any edge lay-
outs already specified by the pos attribute. neato computes an edge layout for any edge that does not have a
pos attribute. As usual, edge layout is guided by the splines attribute.
−v (verbose) prints delta energy every 100th iteration.
−V (version) prints version information and exits.
−? prints the usage and exits.
EXAMPLES
digraph test123 {
a −> b −> c;
a −> {x y};
b [shape=box];
c [label="hello nworld",color=blue,fontsize=24,
fontname="Palatino−Italic",fontcolor=red,style=filled];
a −> z [label="hi", weight=100];
x −> z [label="multi−line nlabel"];
edge [style=dashed,color=red];
b −> x;
{rank=same; b x}
}
graph test123 {
a −− b −− c;
a −− {x y};
x −− c [w=10.0];
x −− y [w=5.0,len=3];
}
CAVEATS
Edge splines can overlap unintentionally.
Flat edge labels are slightly broken. Intercluster edge labels are totally broken.
Because unconstrained optimization is employed, node boxes can possibly overlap or touch unrelated
edges. All existing spring embedders seem to have this limitation.
Apparently reasonable attempts to pin nodes or adjust edge lengths and weights can cause instability.
AUTHORS
Stephen C. North <north@research.att.com>
Emden R. Gansner <erg@research.att.com>
23 August 2004 7](https://image.slidesharecdn.com/twopi-1-120718003329-phpapp02/85/Twopi-1-7-320.jpg)


![Pointers [compatibility mode]](https://cdn.slidesharecdn.com/ss_thumbnails/pointerscompatibilitymode-170805133557-thumbnail.jpg?width=640&height=640&fit=bounds)