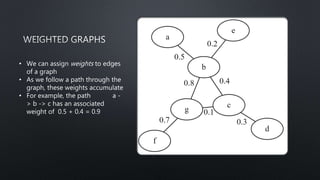
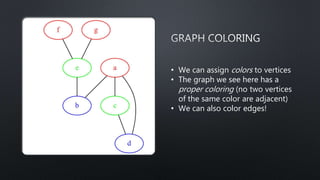
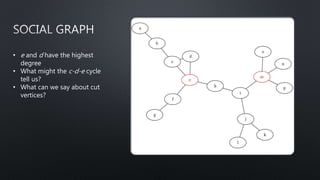
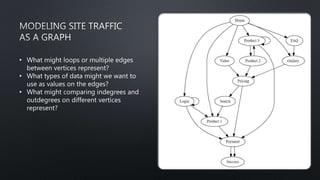
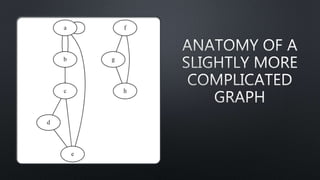
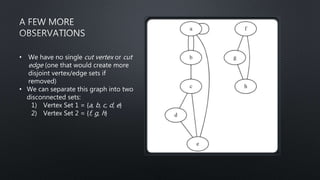
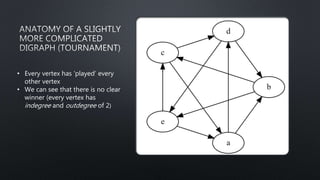
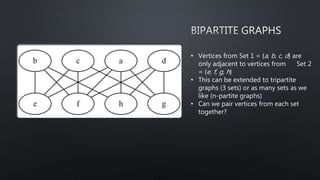
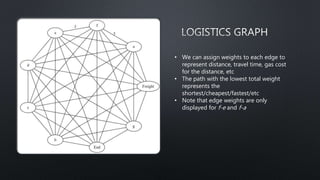
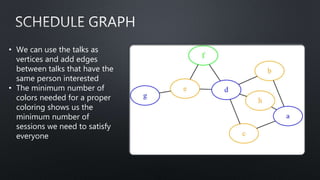
This document provides an introduction to graph theory concepts and working with graph data in Python. It begins with basic graph definitions and real-world graph examples. Various graph concepts are then demonstrated visually, such as vertices, edges, paths, cycles, and graph properties. Finally, it discusses working with graph data structures and algorithms in the NetworkX library in Python, including graph generation, analysis, and visualization. The overall goal is to introduce readers to graph theory and spark their interest in further exploration.
A Visual Exploration of Distance, Documents, and DistributionsRebecca Bilbro
Machine learning often requires us to think spatially and make choices about what it means for two instances to be close or far apart. So which is best - Euclidean? Manhattan? Cosine? It all depends! In this talk, we'll explore open source tools and visual diagnostic strategies for picking good distance metrics when doing machine learning on text.
UMAP is a technique for dimensionality reduction that was proposed 2 years ago that quickly gained widespread usage for dimensionality reduction.
In this presentation I will try to demistyfy UMAP by comparing it to tSNE. I also sketch its theoretical background in topology and fuzzy sets.
Chapter summary and solutions to end-of-chapter exercises for "Data Visualization: Principles and Practice" book by Alexandru C. Telea
In this chapter author discusses a number of popular visualization methods for vector datasets: vector glyphs, vector color-coding, displacement plots, stream objects, texture-based vector visualization, and the simplified representation of vector fields.
Section 6.5 presents stream objects, which use integral techniques to construct paths in vector fields. Section 6.7 discusses a number of strategies for simplified representation of vector datasets. Section 6.8 presents a number of illustrative visualization techniques for vector fields, which offer an alternative mechanism for simplified representation to the techniques discussed in Section 6.7 Chapter presents also feature detection methods, algorithm for computing separatrices on field’s topology, and top-down and bottom-up field decomposition methods.
Chapter summary and solutions to end-of-chapter exercises for "Data Visualization: Principles and Practice" book by Alexandru C. Telea
We presented a number of fundamental methods for visualizing scalar data: color mapping, contouring, slicing, and height plots. Color mapping assigns a color as a function of the scalar value at each point of a given domain. Contouring displays all points within a given two- or three-dimensional domain that have a given scalar value. Height plots deform the scalar dataset domain in a given direction as a function of the scalar data. The main advantages of these techniques are that they produce intuitive results, easily understood by users, and they are simple to implement. However, such techniques also have s number of restrictions.
One of the main reasons for the popularity of Dijkstra's Algorithm is that it is one of the most important and useful algorithms available for generating (exact) optimal solutions to a large class of shortest path problems. The point being that this class of problems is extremely important theoretically, practically, as well as educationally.
Image similarity using symbolic representation and its variationssipij
This paper proposes a new method for image/object retrieval. A pre-processing technique is applied to
describe the object, in one dimensional representation, as a pseudo time series. The proposed algorithm
develops the modified versions of the SAX representation: applies an approach called Extended SAX
(ESAX) in order to realize efficient and accurate discovering of important patterns, necessary for retrieving
the most plausible similar objects. Our approach depends upon a table contains the break-points that
divide a Gaussian distribution in an arbitrary number of equiprobable regions. Each breakpoint has more
than one cardinality. A distance measure is used to decide the most plausible matching between strings of
symbolic words. The experimental results have shown that our approach improves detection accuracy.
This presentation briefly defines machine learning and its types of algorithms. After that two algorithms are presented. The first is naive bayes classifier for text classification and later k-means for clustering including some strategies to improve results.
I am Joe L. I am an Algorithms Design Assignment Expert at programminghomeworkhelp.com. I hold a Ph.D. in Programming from, the University of Chicago, USA. I have been helping students with their assignments for the past 10 years. I solve assignments related to Algorithms Design.
Visit programminghomeworkhelp.com or email support@programminghomeworkhelp.com. You can also call on +1 678 648 4277 for any assistance with the Algorithm Design Assignment.
I am Dennis L. I am an Algorithm Design Exam Expert at programmingexamhelp.com. I hold a Ph.D. in Computer Science from, the City University of New York. I have been helping students with their exams for the past 7 years. You can hire me to take your exam in Algorithm Design.
Visit programmingexamhelp.com or email support@programmingexamhelp.com. You can also call on +1 678 648 4277 for any assistance with the Algorithm Design Exam.
Michal Mucha: Build and Deploy an End-to-end Streaming NLP Insight System | P...PyData
At this workshop, you will build your own messaging insights system - data ingestion from a live data source (Reddit), queueing, deploying a machine learning model, and serving messages with insights to your mobile phone!
Unit testing data with marbles - Jane Stewart Adams, Leif WalshPyData
In the same way that we need to make assertions about how code functions, we need to make assertions about data, and unit testing is a promising framework. In this talk, we'll explore what is unique about unit testing data, and see how Two Sigma's open source library Marbles addresses these unique challenges in several real-world scenarios.
The TileDB Array Data Storage Manager - Stavros Papadopoulos, Jake BolewskiPyData
TileDB is an open-source storage manager for multi-dimensional sparse and dense array data. It has a novel architecture that addresses some of the pain points in storing array data on “big-data” and “cloud” storage architectures. This talk will highlight TileDB’s design and its ability to integrate with analysis environments relevant to the PyData community such as Python, R, Julia, etc.
Using Embeddings to Understand the Variance and Evolution of Data Science... ...PyData
In this talk I will discuss exponential family embeddings, which are methods that extend the idea behind word embeddings to other data types. I will describe how we used dynamic embeddings to understand how data science skill-sets have transformed over the last 3 years using our large corpus of jobs. The key takeaway is that these models can enrich analysis of specialized datasets.
Deploying Data Science for Distribution of The New York Times - Anne BauerPyData
How many newspapers should be distributed to each store for sale every day? The data science group at The New York Times addresses this optimization problem using custom time series modeling and analytical solutions, while also incorporating qualitative business concerns. I'll describe our modeling and data engineering approaches, written in Python and hosted on Google Cloud Platform.
Do Your Homework! Writing tests for Data Science and Stochastic Code - David ...PyData
To productionize data science work (and have it taken seriously by software engineers, CTOs, clients, or the open source community), you need to write tests! Except… how can you test code that performs nondeterministic tasks like natural language parsing and modeling? This talk presents an approach to testing probabilistic functions in code, illustrated with concrete examples written for Pytest.
RESTful Machine Learning with Flask and TensorFlow Serving - Carlo MazzaferroPyData
Those of us who use TensorFlow often focus on building the model that's most predictive, not the one that's most deployable. So how to put that hard work to work? In this talk, we'll walk through a strategy for taking your machine learning models from Jupyter Notebook into production and beyond.
Mining dockless bikeshare and dockless scootershare trip data - Stefanie Brod...PyData
In September 2017, dockless bikeshare joined the transportation options in the District of Columbia. In March 2018, scooter share followed. During the pilot of these technologies, Python has helped District Department of Transportation answer some critical questions. This talk will discuss how Python was used to answer research questions and how it supported the evaluation of this demonstration.
Avoiding Bad Database Surprises: Simulation and Scalability - Steven LottPyData
There are many stories of developers creating databases that don't operate at scale. The application is good, but the database won't work the realistic volumes of data. It's like a horror movie where they never looked behind the door, ran into the dark forest and night, and discovered the database was the monster killing their application. How can we leverage Python to avoid scaling problems?
Machine learning often requires us to think spatially and make choices about what it means for two instances to be close or far apart. So which is best - Euclidean? Manhattan? Cosine? It all depends! In this talk, we'll explore open source tools and visual diagnostic strategies for picking good distance metrics when doing machine learning on text.
End-to-End Machine learning pipelines for Python driven organizations - Nick ...PyData
The recent advances in machine learning and artificial intelligence are amazing! Yet, in order to have real value within a company, data scientists must be able to get their models off of their laptops and deployed within a company’s data pipelines and infrastructure. In this session, I'll demonstrate how one-off experiments can be transformed into scalable ML pipelines with minimal effort.
We will be using Beautiful Soup to Webscrape the IMDB website and create a function that will allow you to create a dictionary object on specific metadata of the IMDB profile for any IMDB ID you pass through as an argument.
1D Convolutional Neural Networks for Time Series Modeling - Nathan Janos, Jef...PyData
This talk describes an experimental approach to time series modeling using 1D convolution filter layers in a neural network architecture. This approach was developed at System1 for forecasting marketplace value of online advertising categories.
Extending Pandas with Custom Types - Will AydPyData
Pandas v.0.23 brought to life a new extension interface through which you can extend NumPy's type system. This talk will explain what that means in more detail and provide practical examples of how the new interface can be leveraged to drastically improve your reporting.
Machine learning models are increasingly used to make decisions that affect people’s lives. With this power comes a responsibility to ensure that model predictions are fair. In this talk I’ll introduce several common model fairness metrics, discuss their tradeoffs, and finally demonstrate their use with a case study analyzing anonymized data from one of Civis Analytics’s client engagements.
What's the Science in Data Science? - Skipper SeaboldPyData
The gold standard for validating any scientific assumption is to run an experiment. Data science isn’t any different. Unfortunately, it’s not always possible to design the perfect experiment. In this talk, we’ll take a realistic look at measurement using tools from the social sciences to conduct quasi-experiments with observational data.
Applying Statistical Modeling and Machine Learning to Perform Time-Series For...PyData
Forecasting time-series data has applications in many fields, including finance, health, etc. There are potential pitfalls when applying classic statistical and machine learning methods to time-series problems. This talk will give folks the basic toolbox to analyze time-series data and perform forecasting using statistical and machine learning models, as well as interpret and convey the outputs.
Solving very simple substitution ciphers algorithmically - Stephen Enright-WardPyData
A historical text may now be unreadable, because its language is unknown, or its script forgotten (or both), or because it was deliberately enciphered. Deciphering needs two steps: Identify the language, then map the unknown script to a familiar one. I’ll present an algorithm to solve a cartoon version of this problem, where the language is known, and the cipher is alphabet rearrangement.
The Face of Nanomaterials: Insightful Classification Using Deep Learning - An...PyData
Artificial intelligence is emerging as a new paradigm in materials science. This talk describes how physical intuition and (insightful) machine learning can solve the complicated task of structure recognition in materials at the nanoscale.
Deprecating the state machine: building conversational AI with the Rasa stack...PyData
Rasa NLU & Rasa Core are the leading open source libraries for building machine learning-based chatbots and voice assistants. In this live-coding workshop you will learn the fundamentals of conversational AI and how to build your own using the Rasa Stack.
UiPath Test Automation using UiPath Test Suite series, part 4DianaGray10
Welcome to UiPath Test Automation using UiPath Test Suite series part 4. In this session, we will cover Test Manager overview along with SAP heatmap.
The UiPath Test Manager overview with SAP heatmap webinar offers a concise yet comprehensive exploration of the role of a Test Manager within SAP environments, coupled with the utilization of heatmaps for effective testing strategies.
Participants will gain insights into the responsibilities, challenges, and best practices associated with test management in SAP projects. Additionally, the webinar delves into the significance of heatmaps as a visual aid for identifying testing priorities, areas of risk, and resource allocation within SAP landscapes. Through this session, attendees can expect to enhance their understanding of test management principles while learning practical approaches to optimize testing processes in SAP environments using heatmap visualization techniques
What will you get from this session?
1. Insights into SAP testing best practices
2. Heatmap utilization for testing
3. Optimization of testing processes
4. Demo
Topics covered:
Execution from the test manager
Orchestrator execution result
Defect reporting
SAP heatmap example with demo
Speaker:
Deepak Rai, Automation Practice Lead, Boundaryless Group and UiPath MVP
JMeter webinar - integration with InfluxDB and GrafanaRTTS
Watch this recorded webinar about real-time monitoring of application performance. See how to integrate Apache JMeter, the open-source leader in performance testing, with InfluxDB, the open-source time-series database, and Grafana, the open-source analytics and visualization application.
In this webinar, we will review the benefits of leveraging InfluxDB and Grafana when executing load tests and demonstrate how these tools are used to visualize performance metrics.
Length: 30 minutes
Session Overview
-------------------------------------------
During this webinar, we will cover the following topics while demonstrating the integrations of JMeter, InfluxDB and Grafana:
- What out-of-the-box solutions are available for real-time monitoring JMeter tests?
- What are the benefits of integrating InfluxDB and Grafana into the load testing stack?
- Which features are provided by Grafana?
- Demonstration of InfluxDB and Grafana using a practice web application
To view the webinar recording, go to:
https://www.rttsweb.com/jmeter-integration-webinar
Kubernetes & AI - Beauty and the Beast !?! @KCD Istanbul 2024Tobias Schneck
As AI technology is pushing into IT I was wondering myself, as an “infrastructure container kubernetes guy”, how get this fancy AI technology get managed from an infrastructure operational view? Is it possible to apply our lovely cloud native principals as well? What benefit’s both technologies could bring to each other?
Let me take this questions and provide you a short journey through existing deployment models and use cases for AI software. On practical examples, we discuss what cloud/on-premise strategy we may need for applying it to our own infrastructure to get it to work from an enterprise perspective. I want to give an overview about infrastructure requirements and technologies, what could be beneficial or limiting your AI use cases in an enterprise environment. An interactive Demo will give you some insides, what approaches I got already working for real.
State of ICS and IoT Cyber Threat Landscape Report 2024 previewPrayukth K V
The IoT and OT threat landscape report has been prepared by the Threat Research Team at Sectrio using data from Sectrio, cyber threat intelligence farming facilities spread across over 85 cities around the world. In addition, Sectrio also runs AI-based advanced threat and payload engagement facilities that serve as sinks to attract and engage sophisticated threat actors, and newer malware including new variants and latent threats that are at an earlier stage of development.
The latest edition of the OT/ICS and IoT security Threat Landscape Report 2024 also covers:
State of global ICS asset and network exposure
Sectoral targets and attacks as well as the cost of ransom
Global APT activity, AI usage, actor and tactic profiles, and implications
Rise in volumes of AI-powered cyberattacks
Major cyber events in 2024
Malware and malicious payload trends
Cyberattack types and targets
Vulnerability exploit attempts on CVEs
Attacks on counties – USA
Expansion of bot farms – how, where, and why
In-depth analysis of the cyber threat landscape across North America, South America, Europe, APAC, and the Middle East
Why are attacks on smart factories rising?
Cyber risk predictions
Axis of attacks – Europe
Systemic attacks in the Middle East
Download the full report from here:
https://sectrio.com/resources/ot-threat-landscape-reports/sectrio-releases-ot-ics-and-iot-security-threat-landscape-report-2024/
Accelerate your Kubernetes clusters with Varnish CachingThijs Feryn
A presentation about the usage and availability of Varnish on Kubernetes. This talk explores the capabilities of Varnish caching and shows how to use the Varnish Helm chart to deploy it to Kubernetes.
This presentation was delivered at K8SUG Singapore. See https://feryn.eu/presentations/accelerate-your-kubernetes-clusters-with-varnish-caching-k8sug-singapore-28-2024 for more details.
Epistemic Interaction - tuning interfaces to provide information for AI supportAlan Dix
Paper presented at SYNERGY workshop at AVI 2024, Genoa, Italy. 3rd June 2024
https://alandix.com/academic/papers/synergy2024-epistemic/
As machine learning integrates deeper into human-computer interactions, the concept of epistemic interaction emerges, aiming to refine these interactions to enhance system adaptability. This approach encourages minor, intentional adjustments in user behaviour to enrich the data available for system learning. This paper introduces epistemic interaction within the context of human-system communication, illustrating how deliberate interaction design can improve system understanding and adaptation. Through concrete examples, we demonstrate the potential of epistemic interaction to significantly advance human-computer interaction by leveraging intuitive human communication strategies to inform system design and functionality, offering a novel pathway for enriching user-system engagements.
Transcript: Selling digital books in 2024: Insights from industry leaders - T...BookNet Canada
The publishing industry has been selling digital audiobooks and ebooks for over a decade and has found its groove. What’s changed? What has stayed the same? Where do we go from here? Join a group of leading sales peers from across the industry for a conversation about the lessons learned since the popularization of digital books, best practices, digital book supply chain management, and more.
Link to video recording: https://bnctechforum.ca/sessions/selling-digital-books-in-2024-insights-from-industry-leaders/
Presented by BookNet Canada on May 28, 2024, with support from the Department of Canadian Heritage.
Builder.ai Founder Sachin Dev Duggal's Strategic Approach to Create an Innova...Ramesh Iyer
In today's fast-changing business world, Companies that adapt and embrace new ideas often need help to keep up with the competition. However, fostering a culture of innovation takes much work. It takes vision, leadership and willingness to take risks in the right proportion. Sachin Dev Duggal, co-founder of Builder.ai, has perfected the art of this balance, creating a company culture where creativity and growth are nurtured at each stage.
GraphRAG is All You need? LLM & Knowledge GraphGuy Korland
Guy Korland, CEO and Co-founder of FalkorDB, will review two articles on the integration of language models with knowledge graphs.
1. Unifying Large Language Models and Knowledge Graphs: A Roadmap.
https://arxiv.org/abs/2306.08302
2. Microsoft Research's GraphRAG paper and a review paper on various uses of knowledge graphs:
https://www.microsoft.com/en-us/research/blog/graphrag-unlocking-llm-discovery-on-narrative-private-data/
Slack (or Teams) Automation for Bonterra Impact Management (fka Social Soluti...Jeffrey Haguewood
Sidekick Solutions uses Bonterra Impact Management (fka Social Solutions Apricot) and automation solutions to integrate data for business workflows.
We believe integration and automation are essential to user experience and the promise of efficient work through technology. Automation is the critical ingredient to realizing that full vision. We develop integration products and services for Bonterra Case Management software to support the deployment of automations for a variety of use cases.
This video focuses on the notifications, alerts, and approval requests using Slack for Bonterra Impact Management. The solutions covered in this webinar can also be deployed for Microsoft Teams.
Interested in deploying notification automations for Bonterra Impact Management? Contact us at sales@sidekicksolutionsllc.com to discuss next steps.
Mission to Decommission: Importance of Decommissioning Products to Increase E...
Graph Analytics - From the Whiteboard to Your Toolbox - Sam Lerma
1.
2. This is a novice-track talk, so all concepts and examples are kept simple
1. Basic graph theory concepts and definitions
2. A few real-world scenarios framed as graph data
3. Working with graphs in Python
The overall goal of this talk is to spark your interest in and show you what’s
out there as a jumping off point for you to go deeper
3. Graph: “A structure amounting to a set of objects in which some
pairs of the objects are in some sense ‘related’. The objects
correspond to mathematical abstractions called vertices (also called
nodes or points) and each of the related pairs of vertices is called an
edge (also called an arc or line)” – Richard Trudeau, Introduction to
Graph Theory (1st edition, 1993)
Graph Analytics: “Analysis of data structured as a graph
(sometimes also part of network analysis or link analysis depending
on scope and context)” – Me, talking to a stress ball as I made these
slides
4.
5. • We see two vertices joined by
a single edge
• Vertex 1 is adjacent to vertex 2
• The neighborhood of vertex 1
is all adjacent vertices (vertex
2 in this case)
6.
7. • We see that there is a loop on
vertex a
• Vertices a and b have multiple
edges between them
• Vertex c has a degree of 3
• There exists a path from vertex a
to vertex e
• Vertices f, g, and h form a 3-
cycle
8. • We have no single cut vertex or cut
edge (one that would create more
disjoint vertex/edge sets if
removed)
• We can separate this graph into two
disconnected sets:
1) Vertex Set 1 = {a, b, c, d, e}
2) Vertex Set 2 = {f, g, h}
9. • Imagine symmetric vertex
labels along the top and
left hand sides of the
matrix
• A one in a particular slot
tells us that the two
vertices are adjacent
10. • In this graph two vertices are
joined by a single directed
edge
• There is a dipath from vertex 1
to vertex 2 but not from vertex
2 to vertex 1
11. • Every vertex has ‘played’ every
other vertex
• We can see that there is no clear
winner (every vertex has
indegree and outdegree of 2)
12. • Vertices from Set 1 = {a, b, c, d} are
only adjacent to vertices from Set 2
= {e, f, g, h}
• This can be extended to tripartite
graphs (3 sets) or as many sets as we
like (n-partite graphs)
• Can we pair vertices from each set
together?
13. We can pair every vertex
from one set to a vertex
from the other using only
existing edges
14. • We can assign weights to edges
of a graph
• As we follow a path through the
graph, these weights accumulate
• For example, the path a -
> b -> c has an associated
weight of 0.5 + 0.4 = 0.9
15. • We can assign colors to vertices
• The graph we see here has a
proper coloring (no two vertices
of the same color are adjacent)
• We can also color edges!
16. • Are we focused more on objects or the relationships/interactions
between them?
• Are we looking at transition states?
• Is orientation important?
If you can imagine a graph to represent it, it’s probably worth giving it a
shot, if only for your own learning and exploration!
17. • If the lines represent
connections, what can we say
about the people highlighted
in red?
• What kinds of questions might
a graph be able to answer?
18. • e and d have the highest
degree
• What might the c-d-e cycle
tell us?
• What can we say about cut
vertices?
19. If we have page view
data with timestamps
how might we
represent this as a
graph?
20. • What might loops or multiple edges
between vertices represent?
• What types of data might we want to
use as values on the edges?
• What might comparing indegrees and
outdegrees on different vertices
represent?
21. If we have to regularly pick up a
load at the train station, make
deliveries to every factory and
then return to the garage how can
a graph help us find an optimal
route?
22. • We can assign weights to each edge to
represent distance, travel time, gas cost
for the distance, etc
• The path with the lowest total weight
represents the
shortest/cheapest/fastest/etc
• Note that edge weights are only
displayed for f-e and f-a
23. If the following people want to
attend the following talks (a-h),
what’s the minimum number of
sessions we need to satisfy
everyone?
24. • We can use the talks as
vertices and add edges
between talks that have the
same person interested
• The minimum number of
colors needed for a proper
coloring shows us the
minimum number of
sessions we need to satisfy
everyone
35. • There’s a NetworkX tutorial tomorrow!
• In-browser Graphviz: webgraphviz.com
• Free graph theory textbook: An Introduction to Combinatorics and
Graph Theory, David Guichard
• Open problems in graph theory: openproblemgarden.org
• Graph databases
• Association for Computational Linguistics (ACL) 2010 Workshop on
Graph-based Methods for Natural Language Processing
• Free papers: researchgate.net