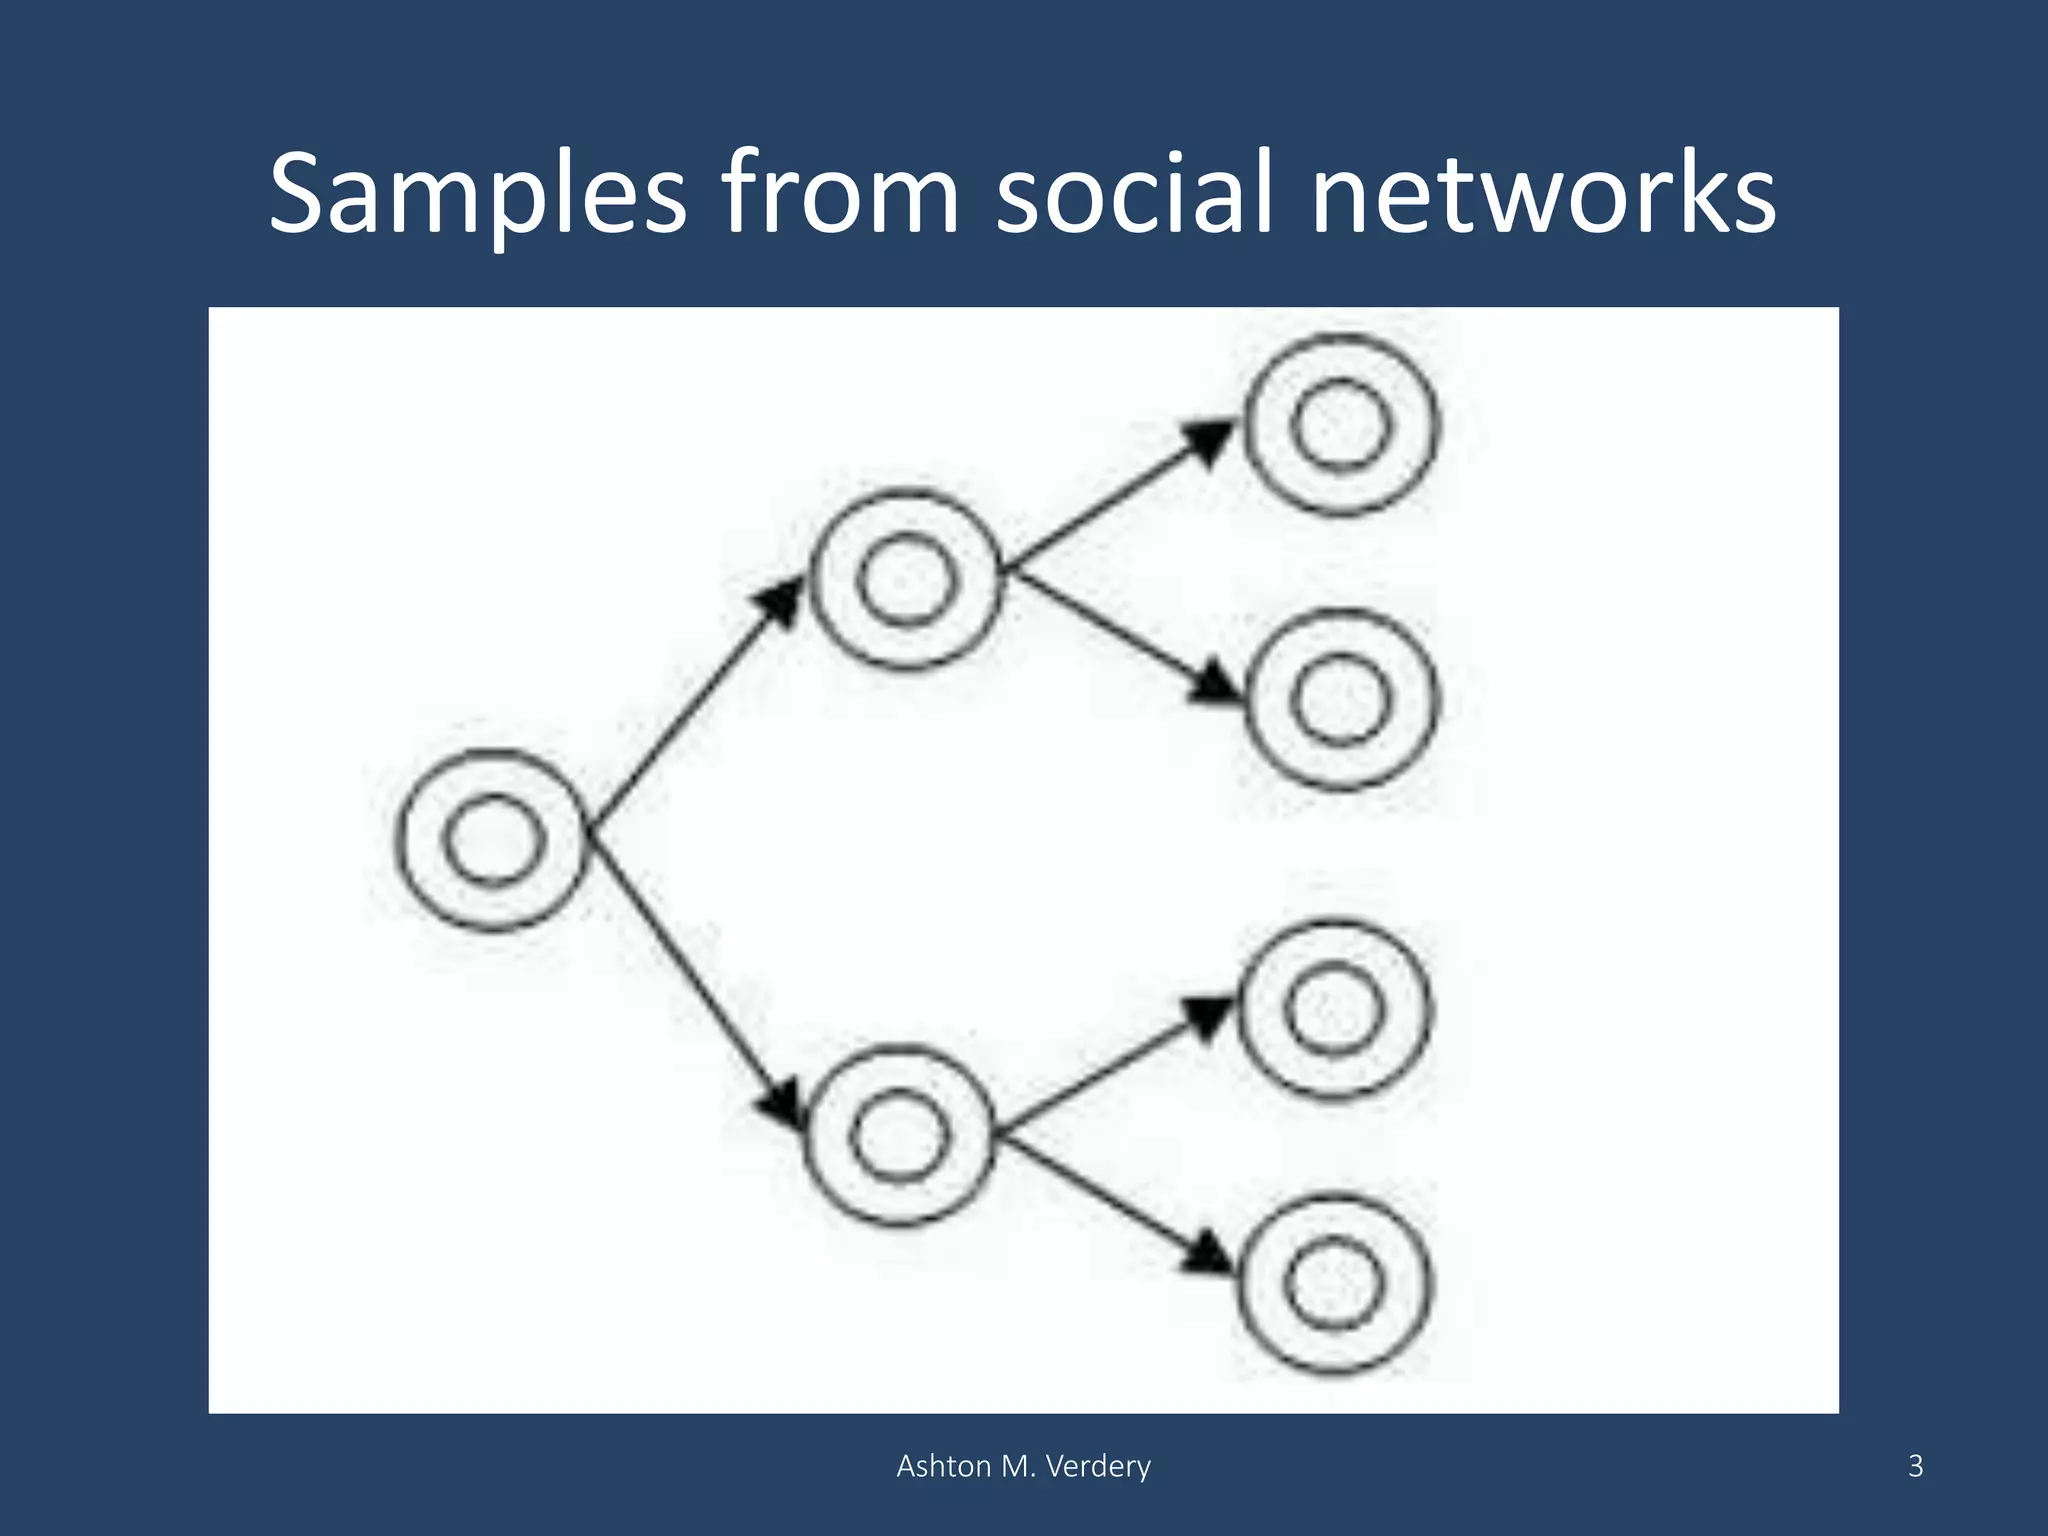
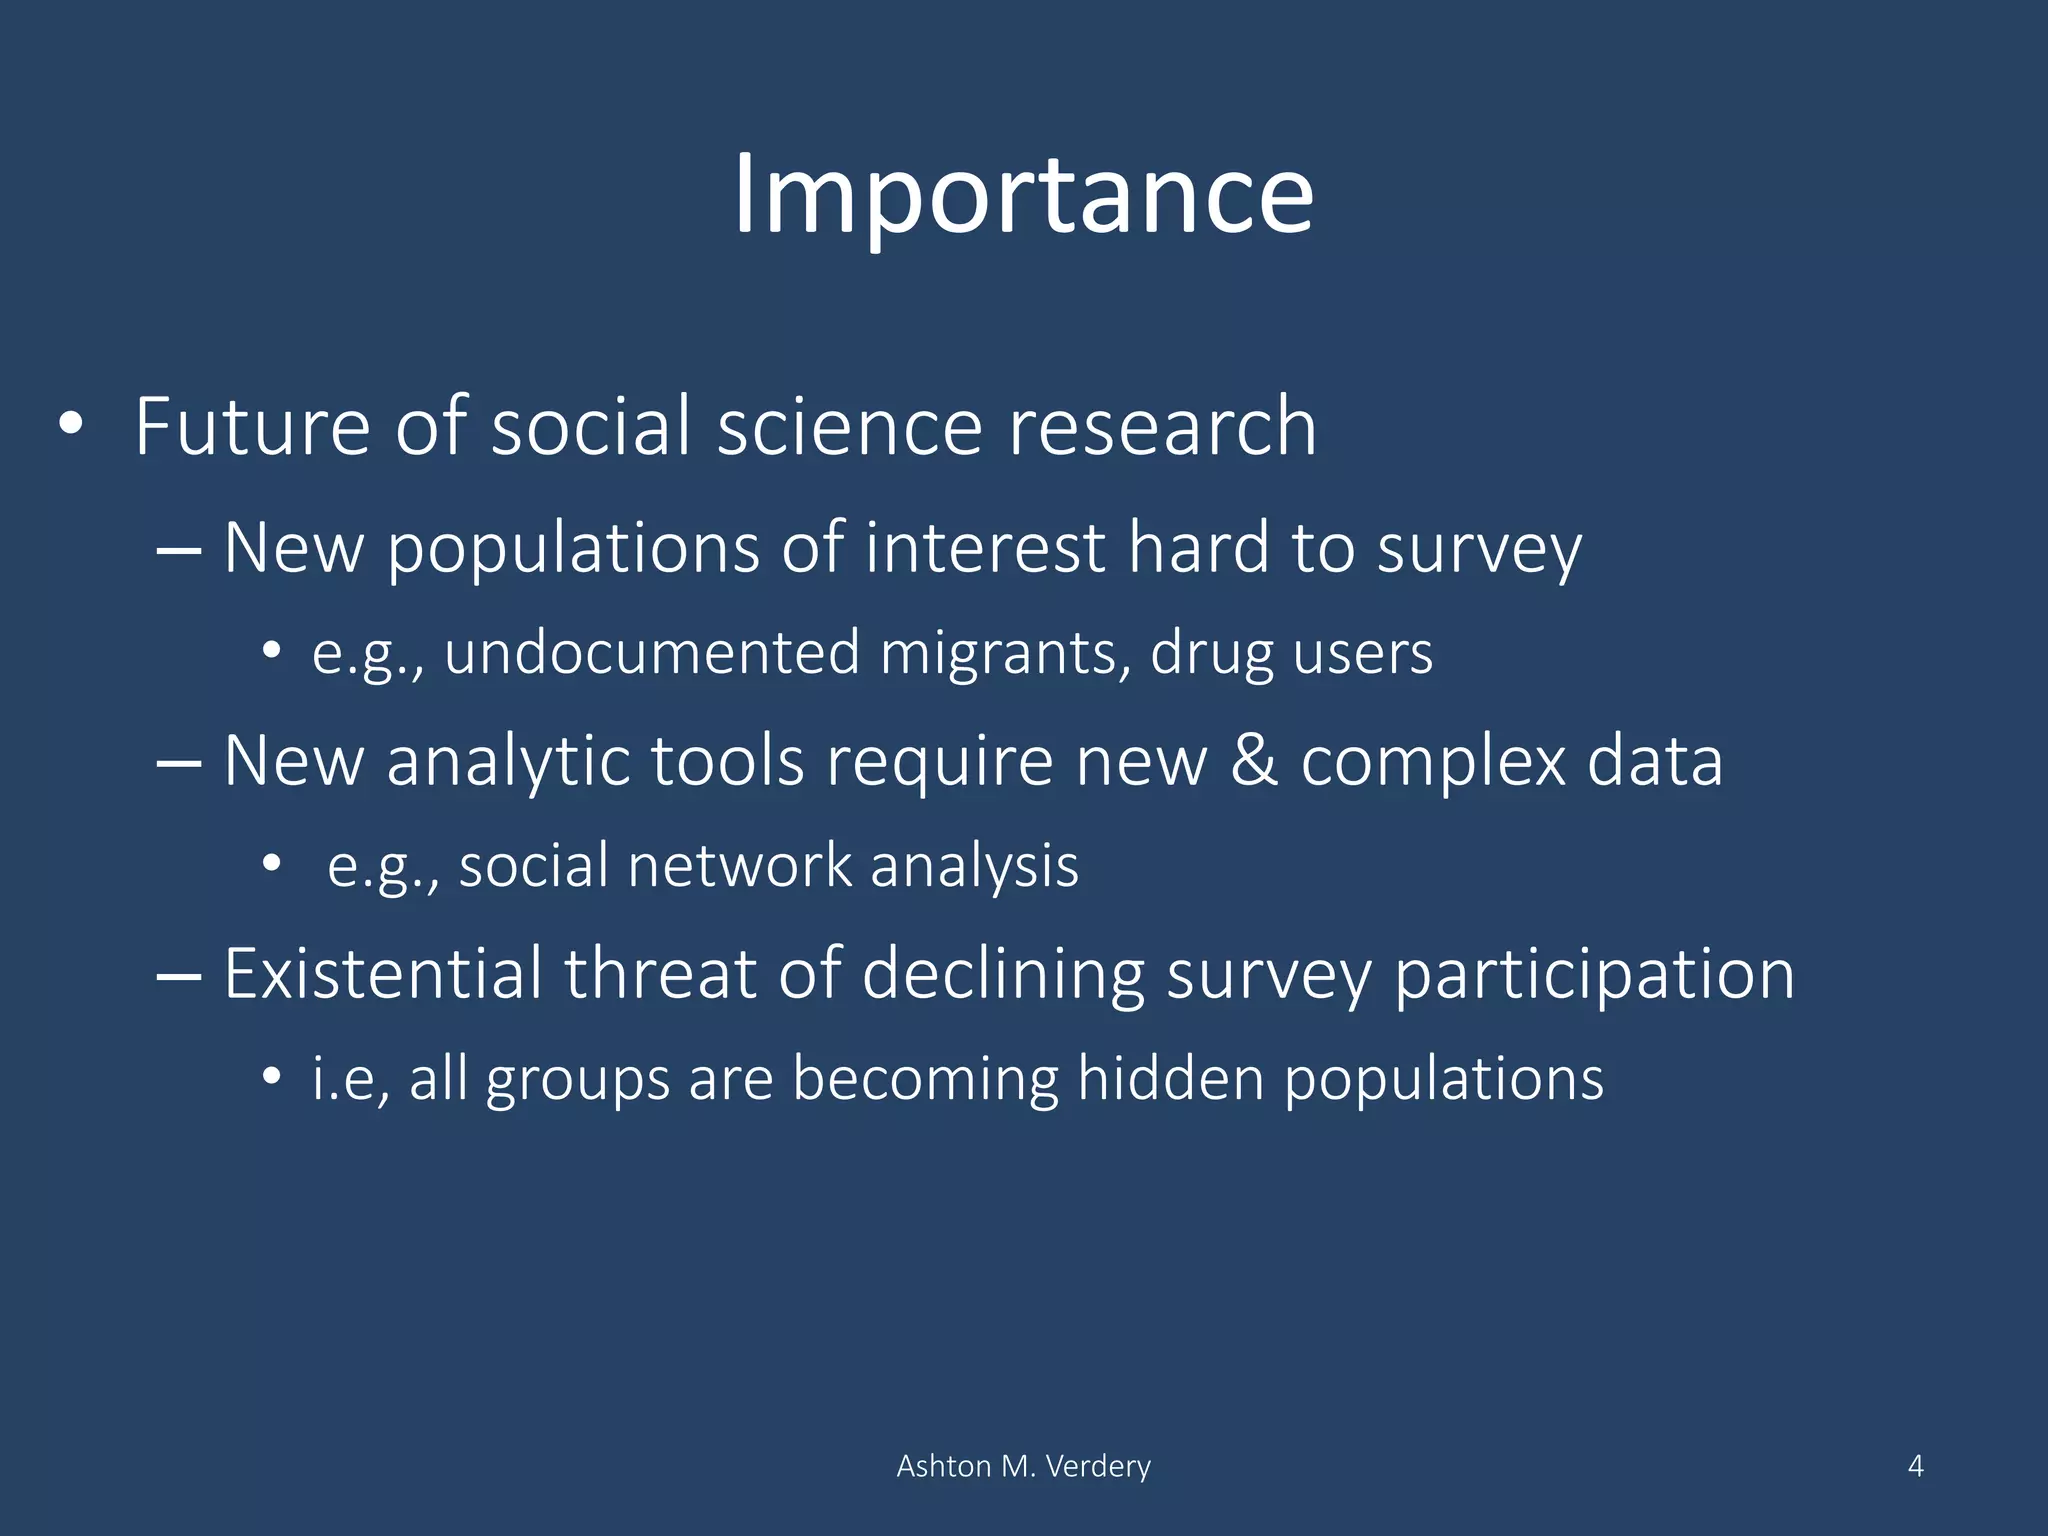
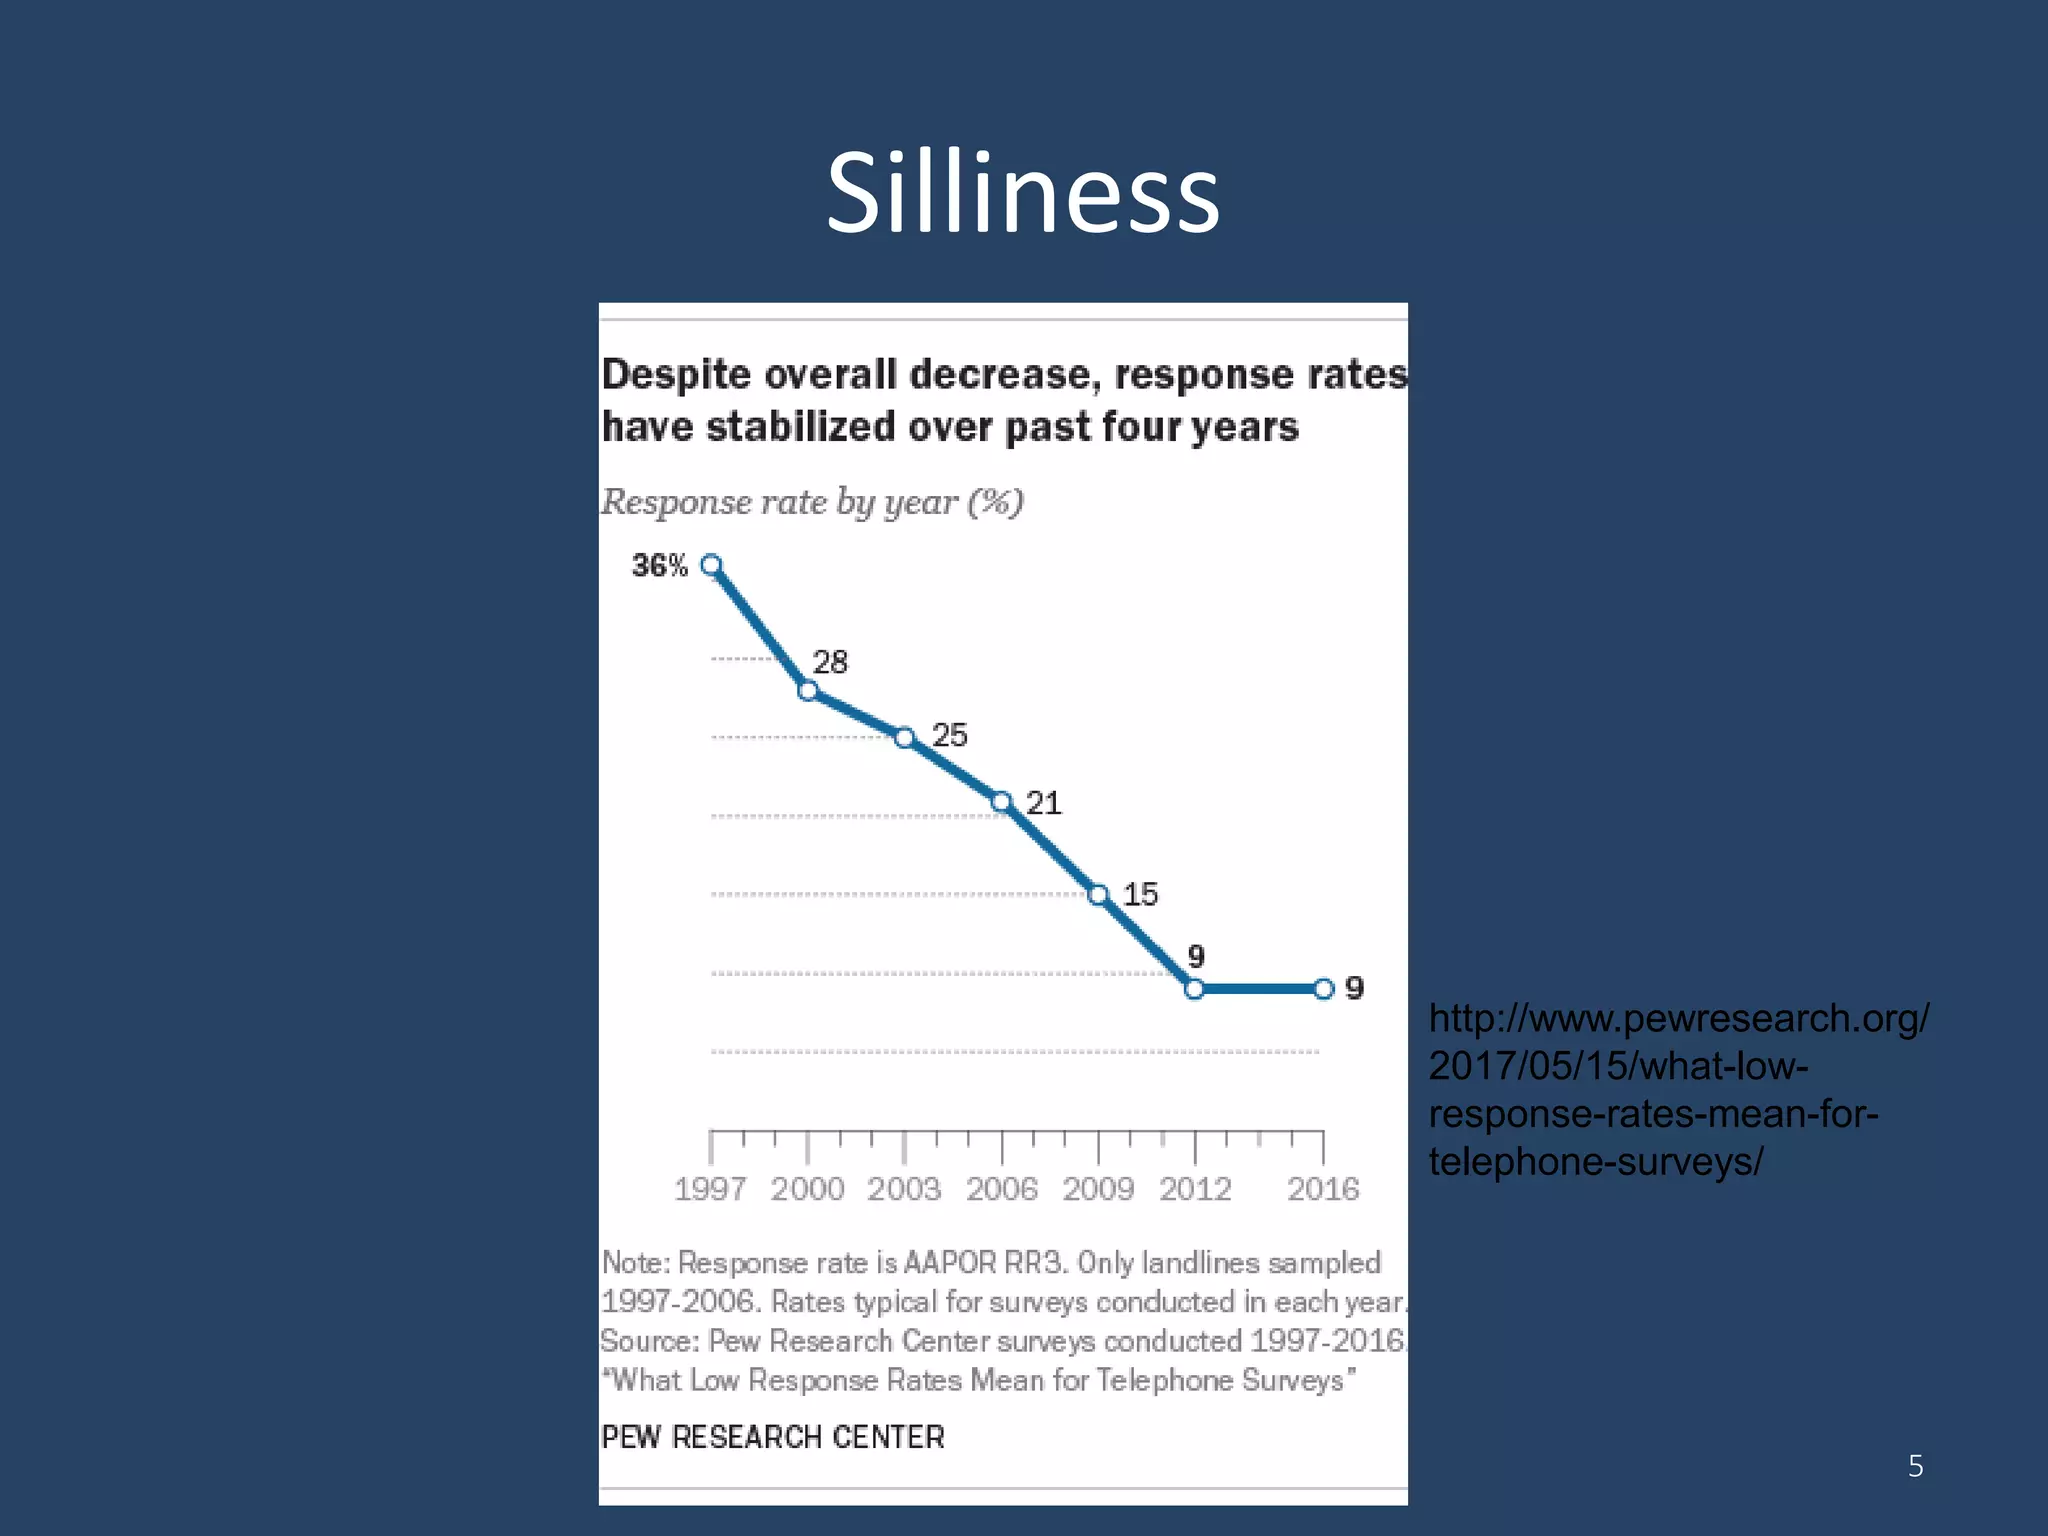
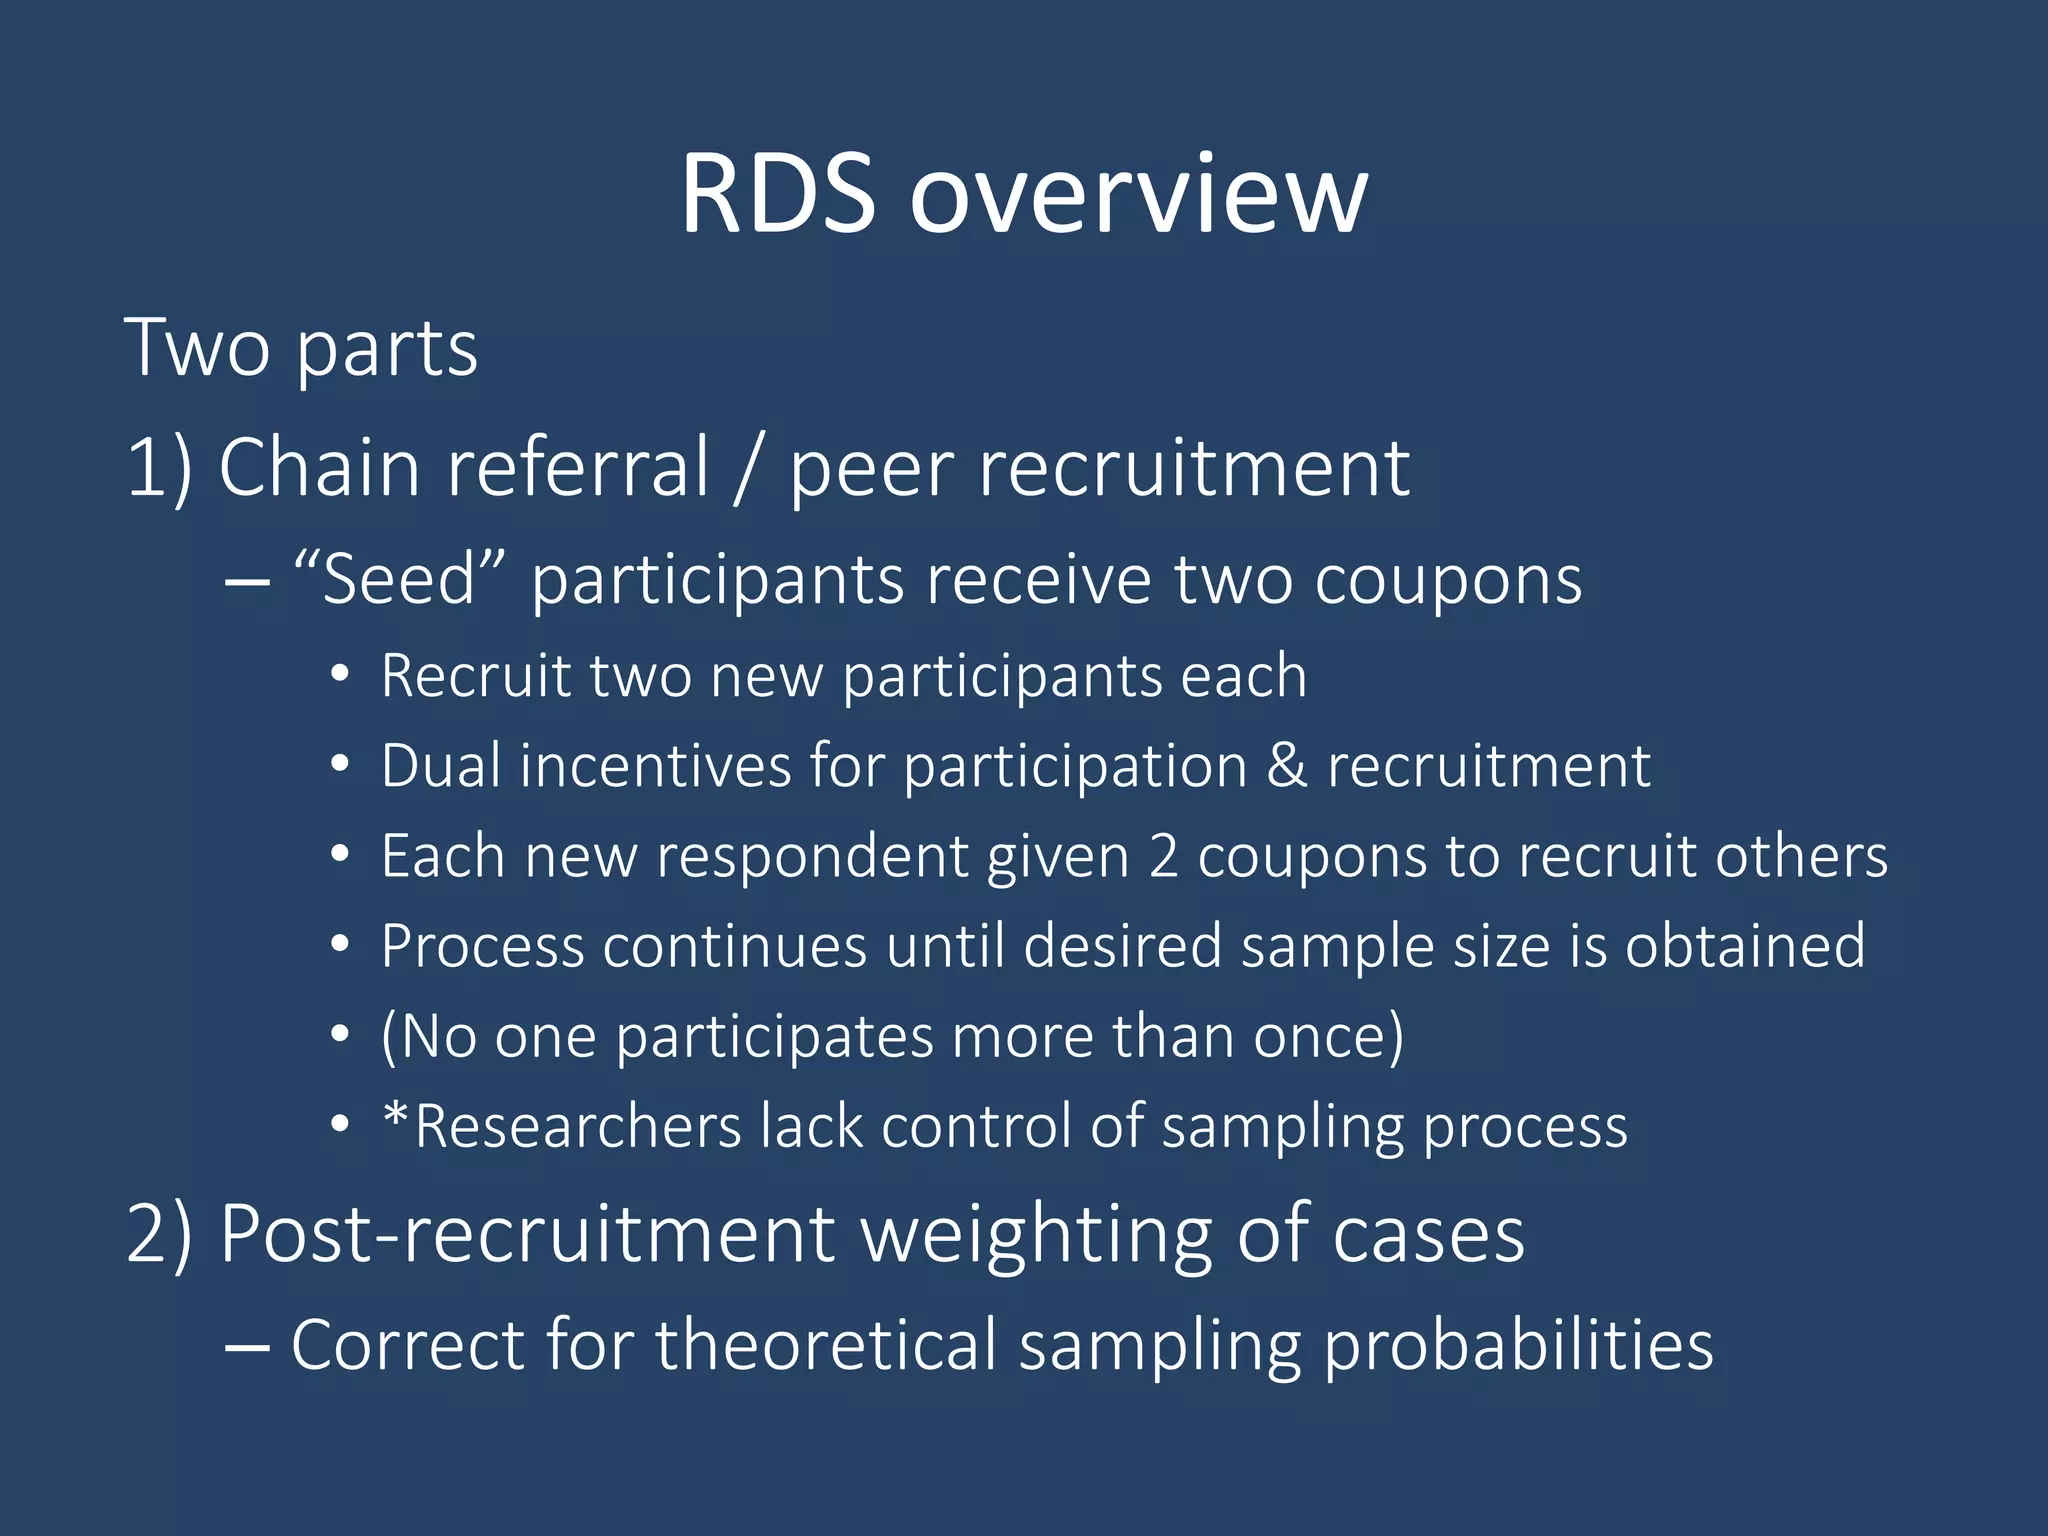
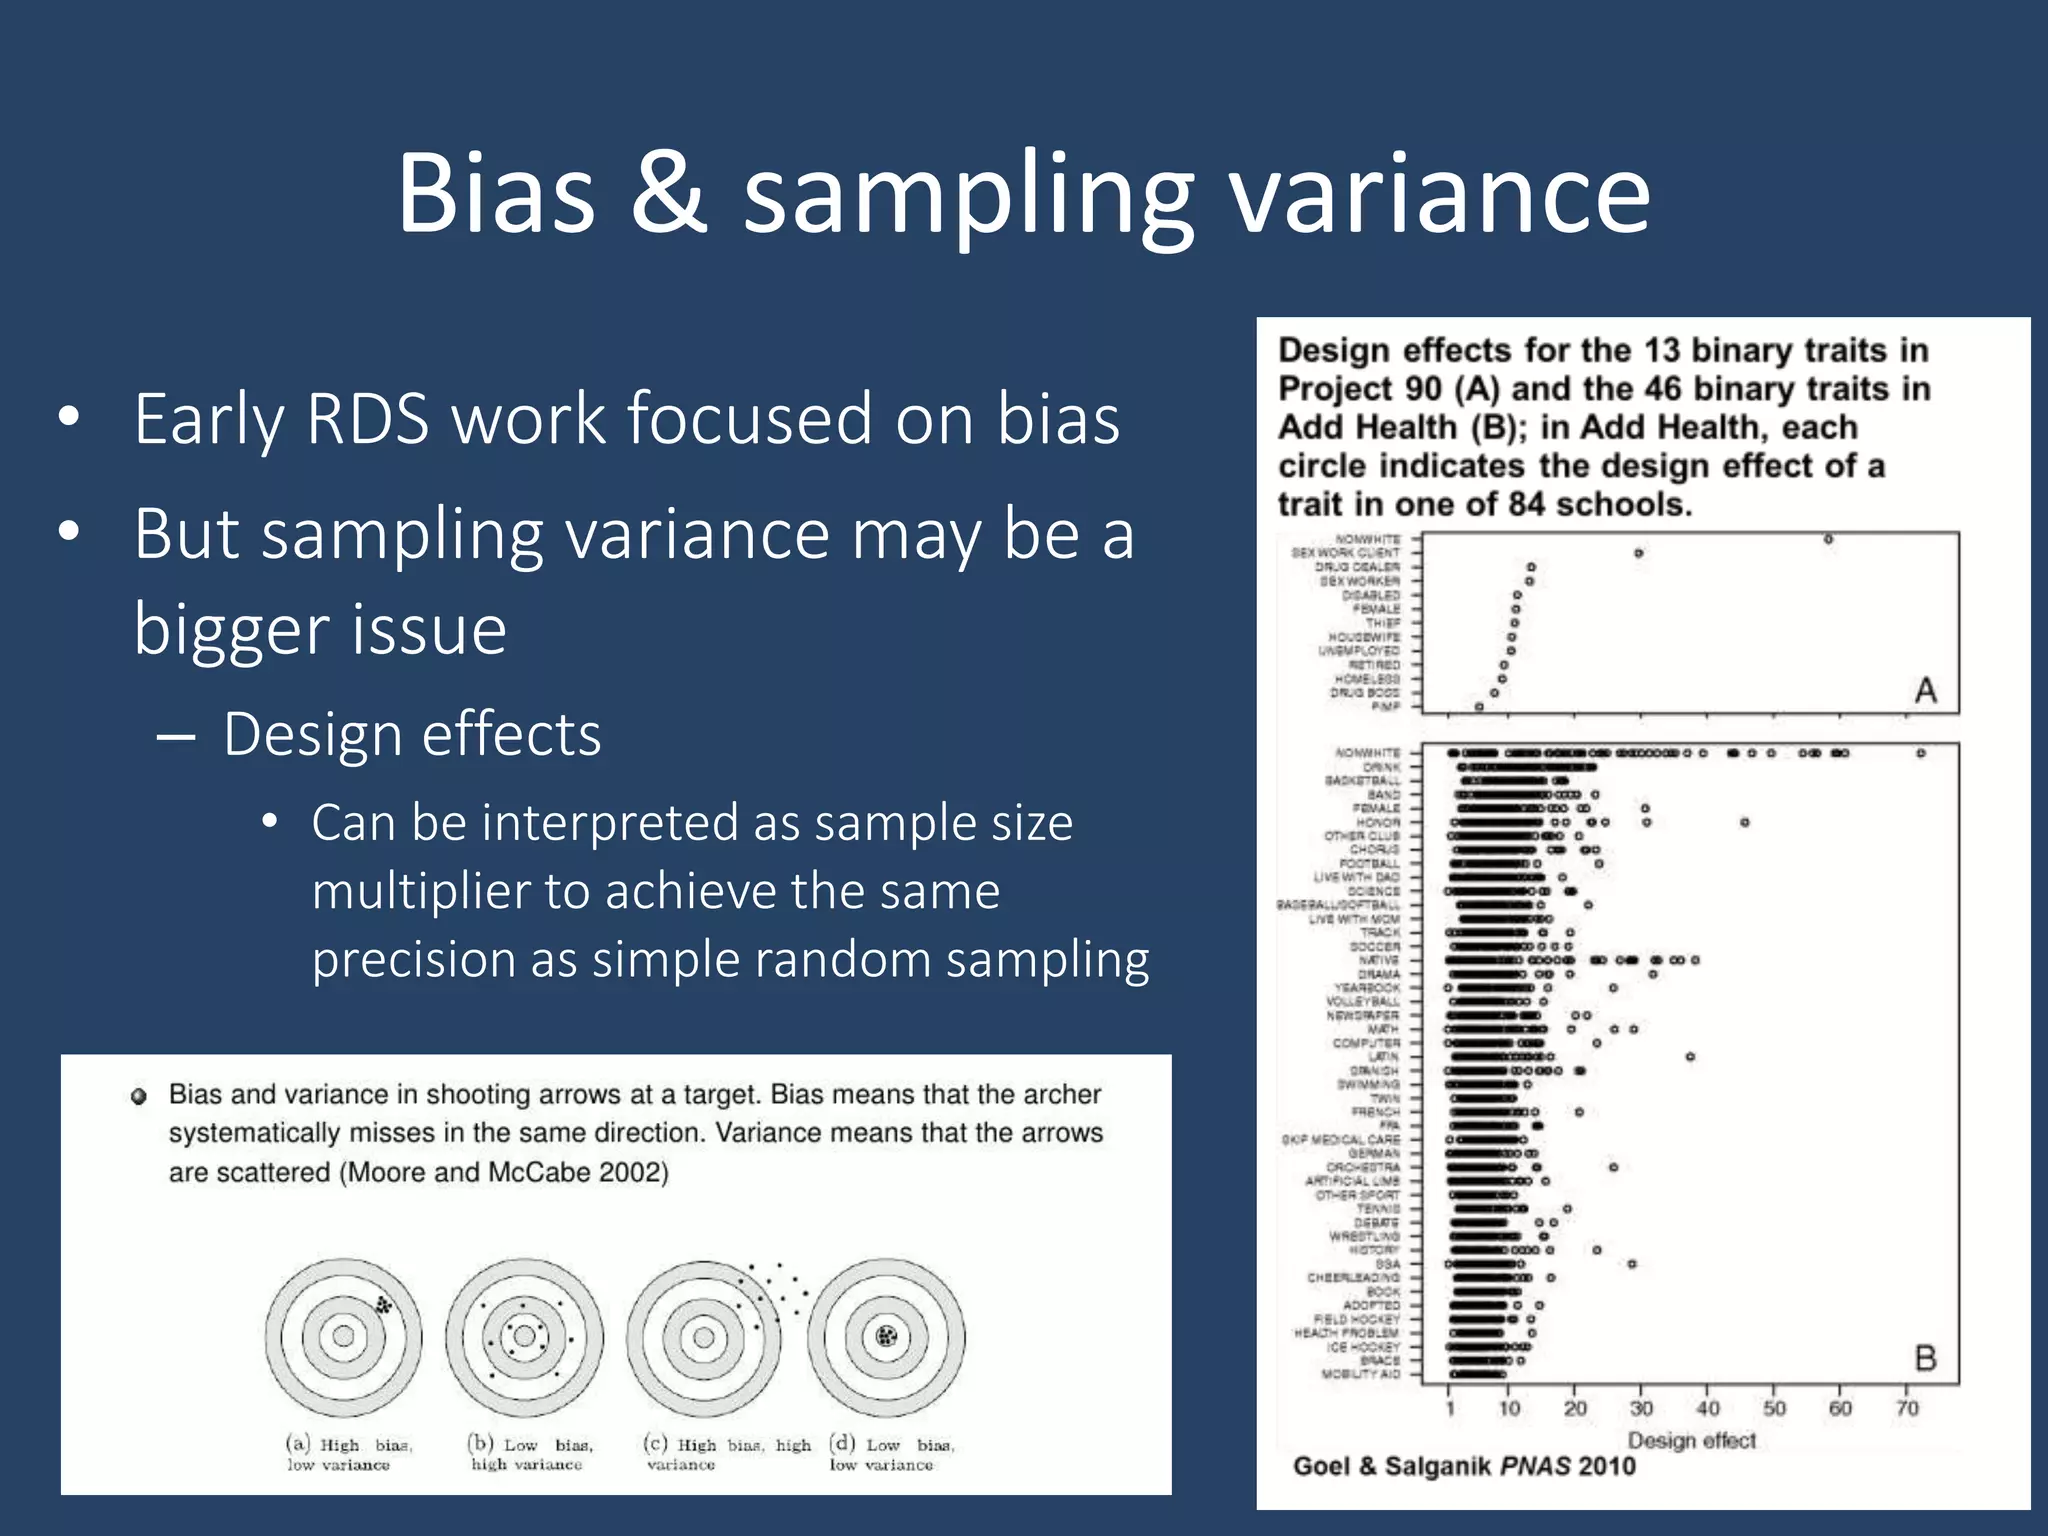
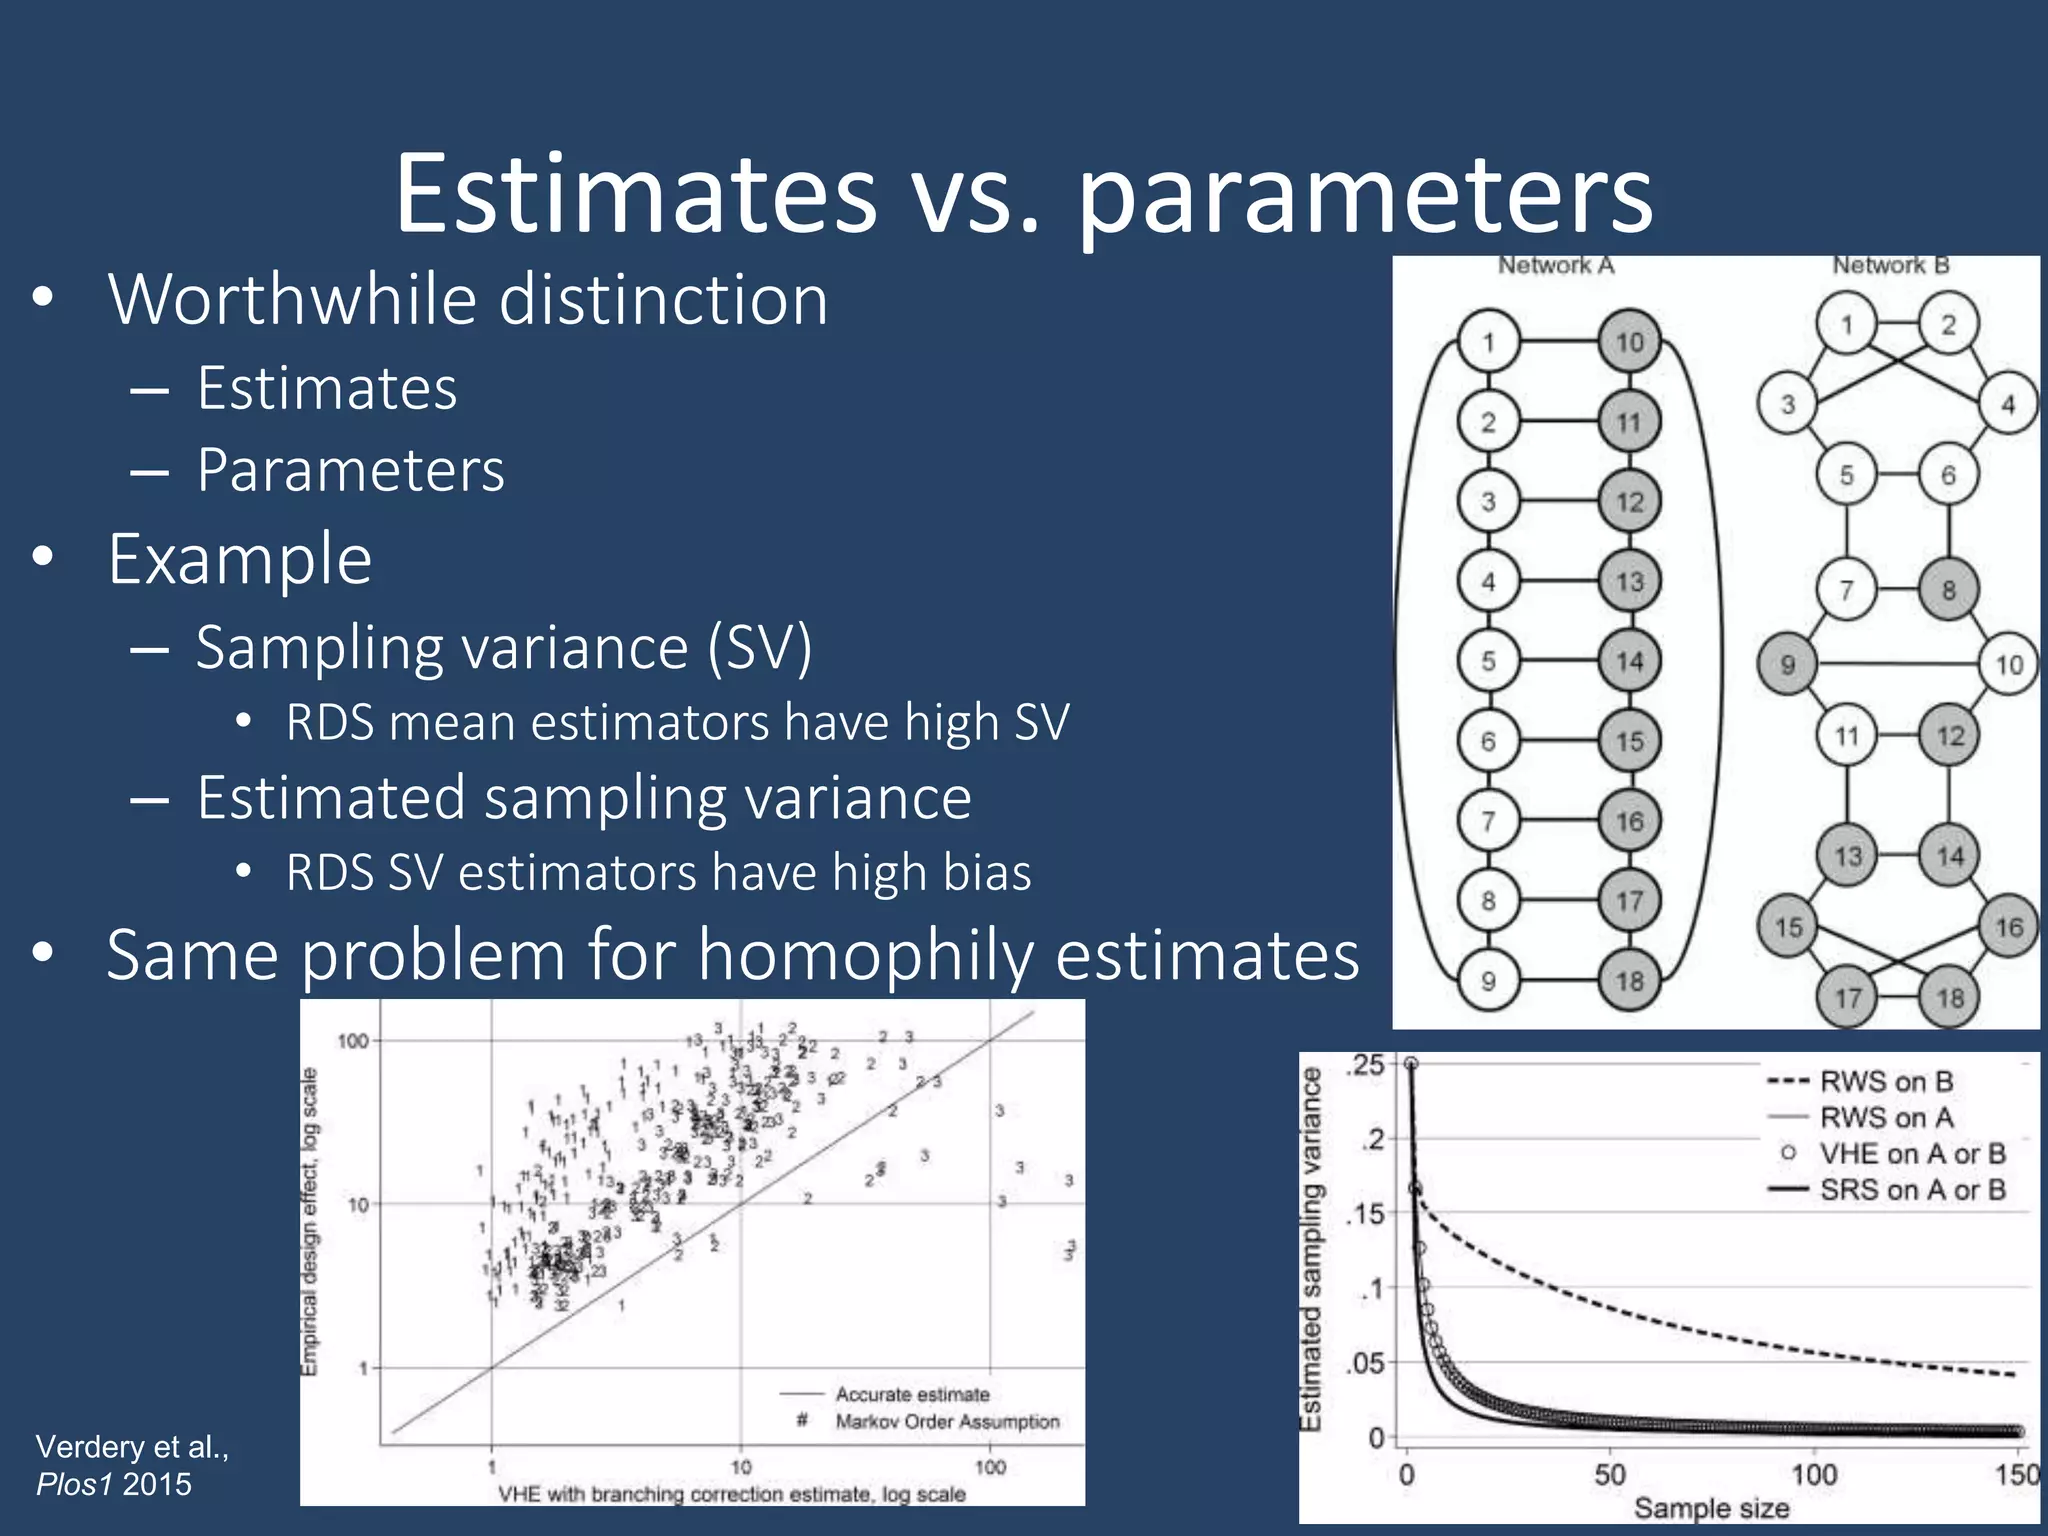
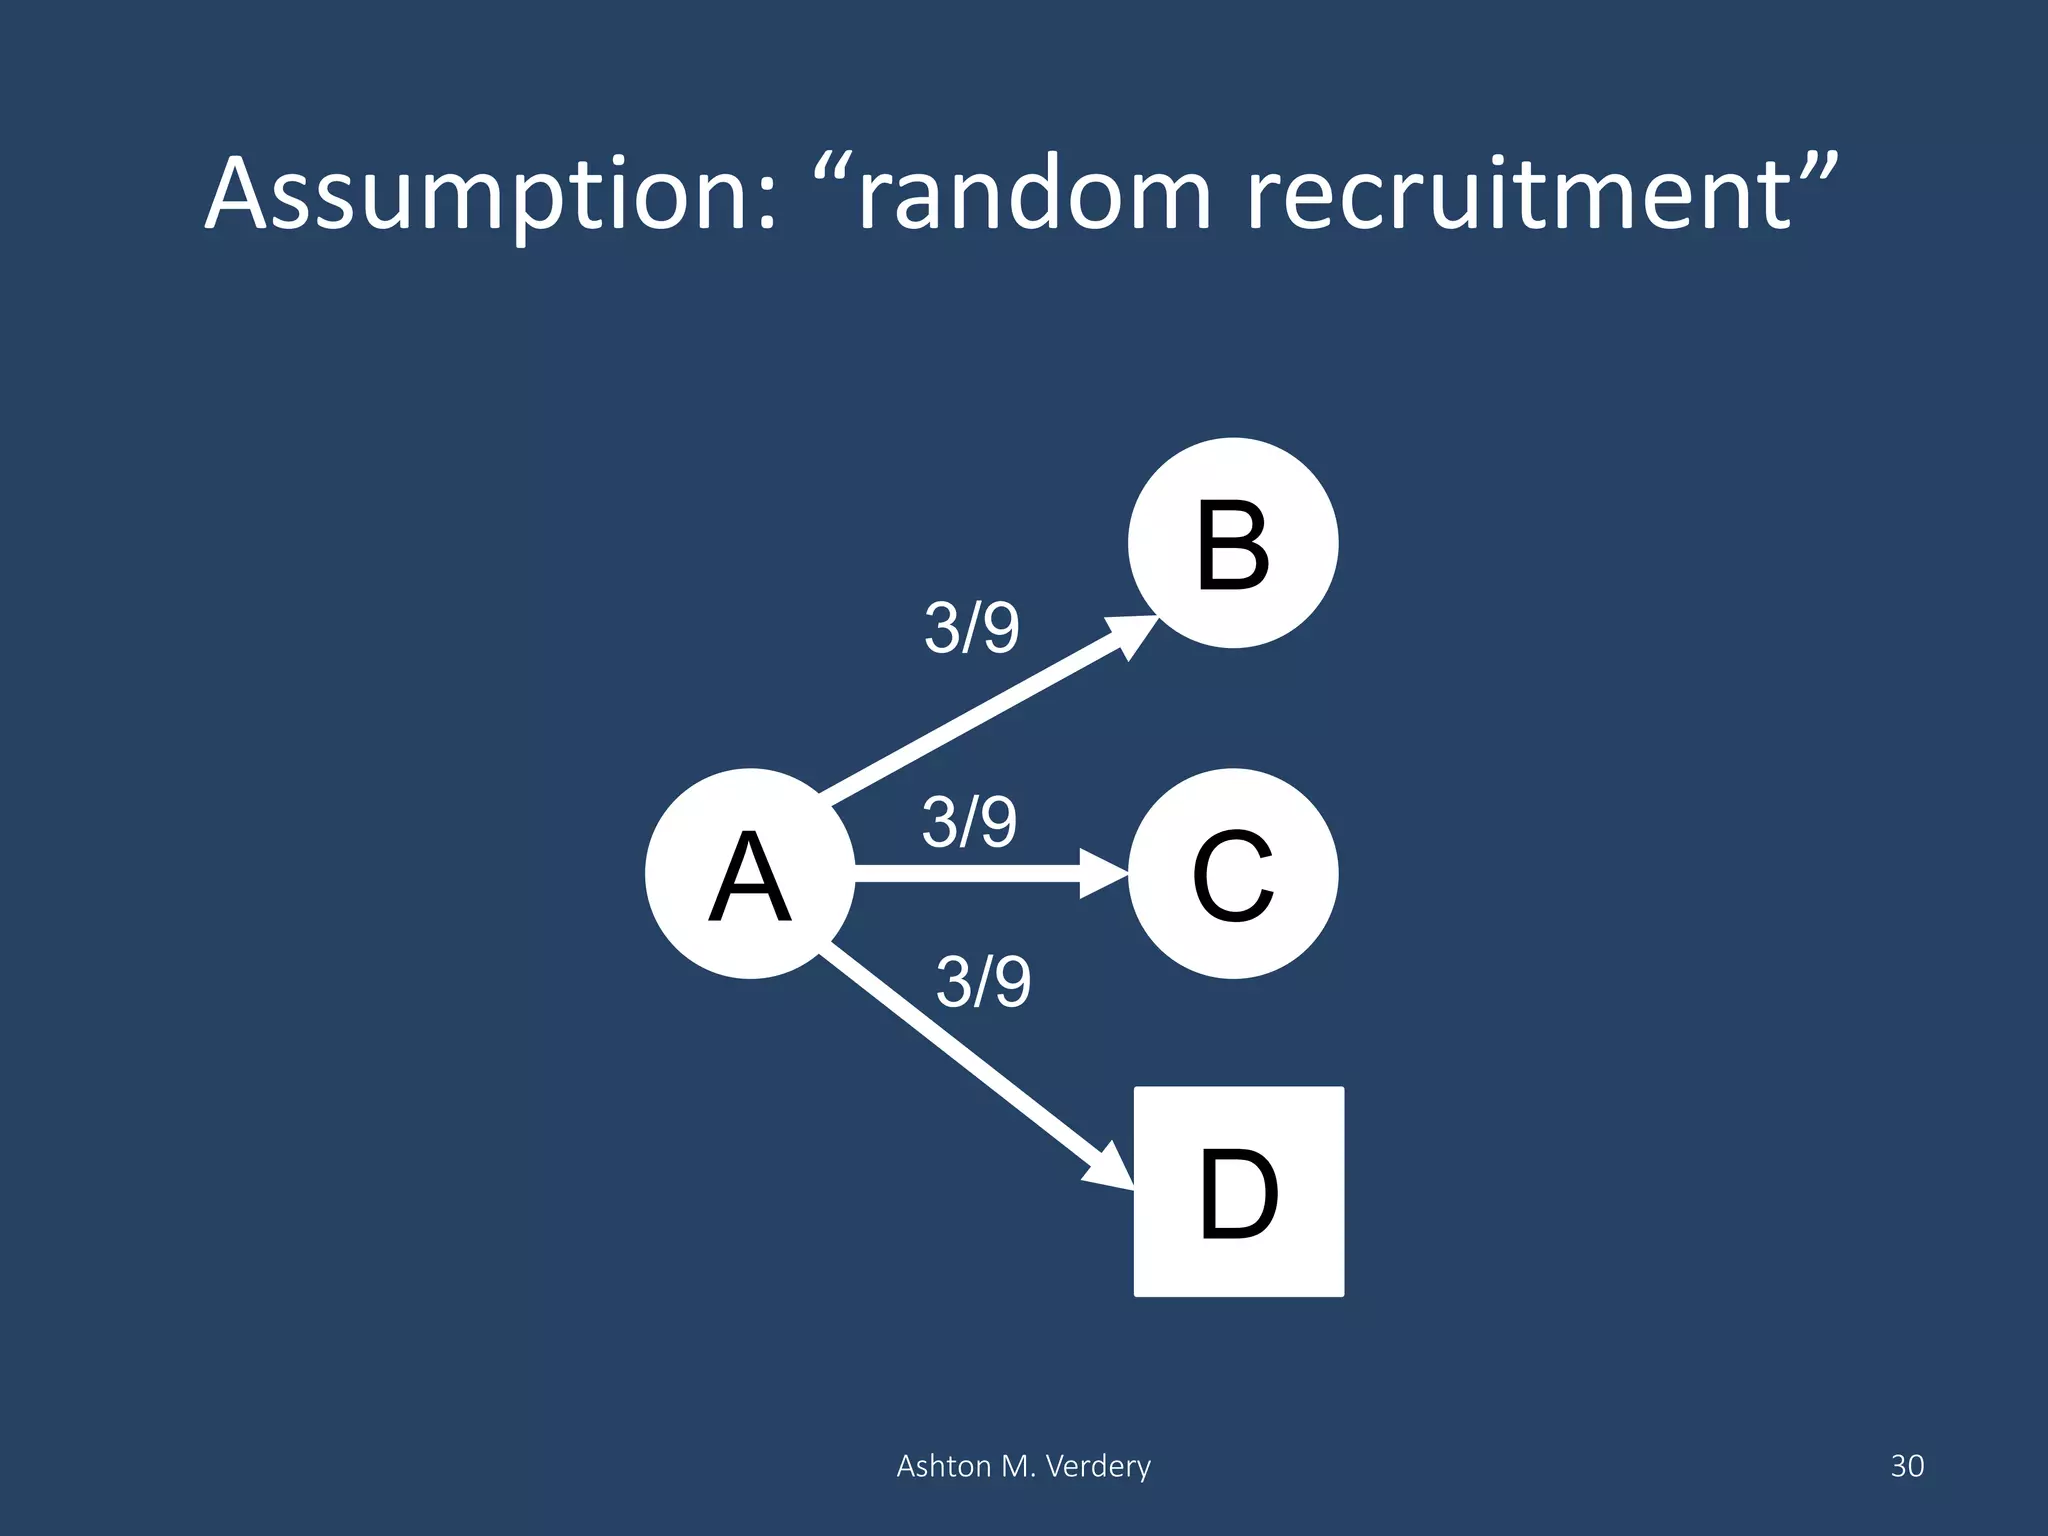
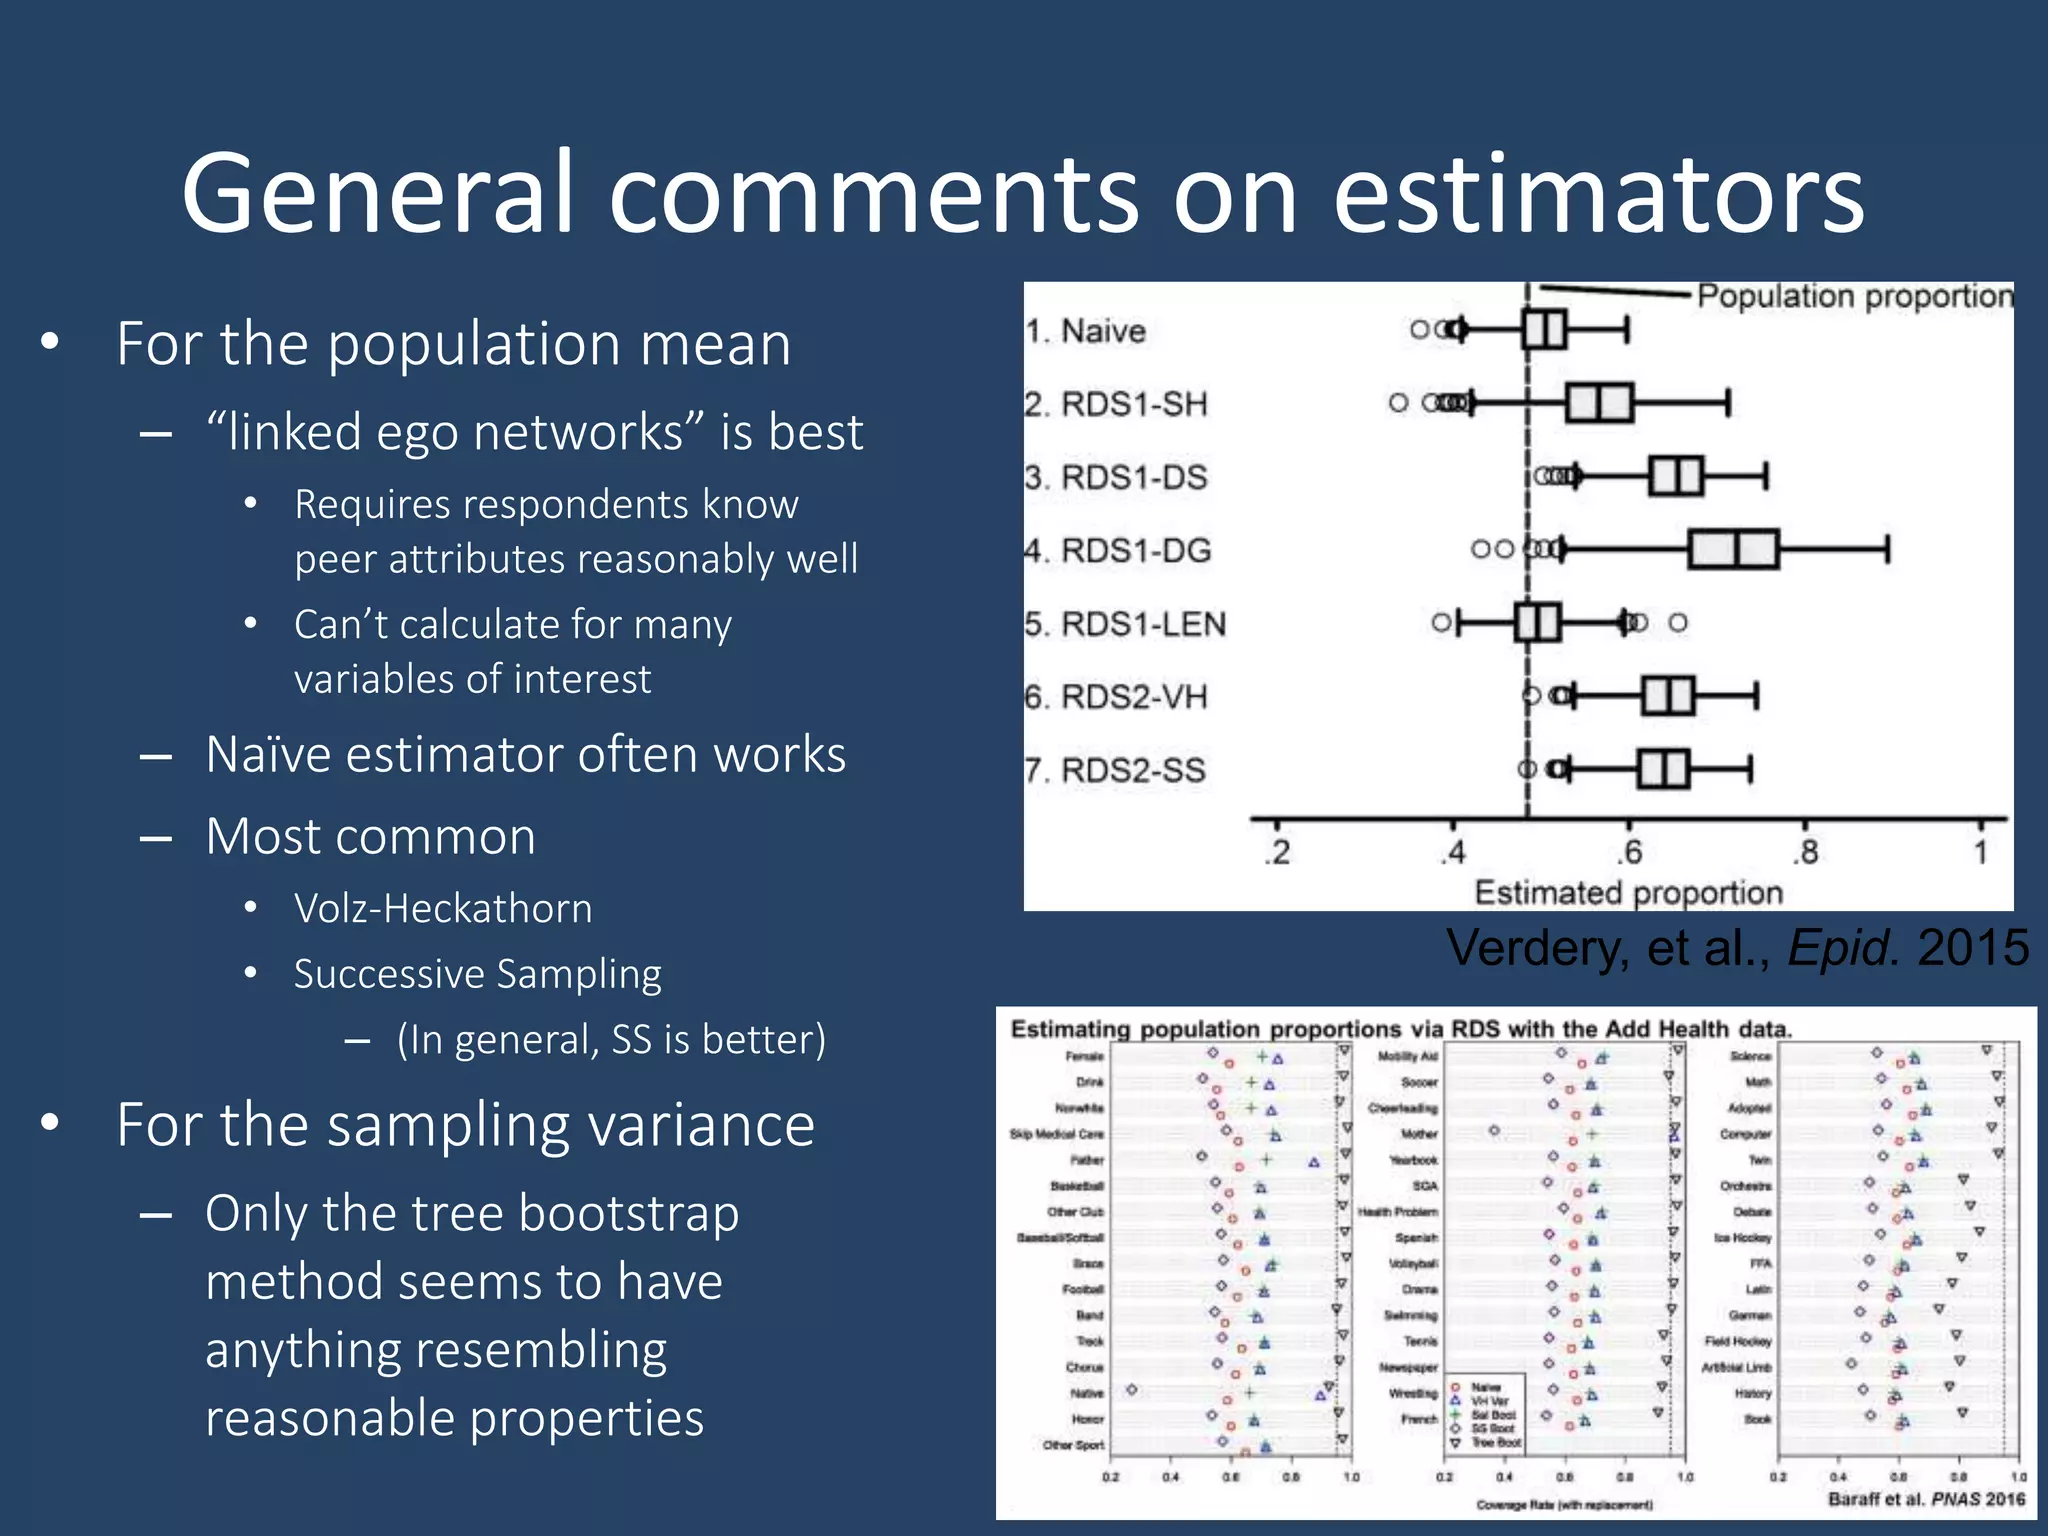
Respondent-Driven Sampling:
An Overview
Ashton M. Verdery
Duke Network Analysis Center
May, 2018
Outline
• Leveraging social networks for sampling
– Why?
– How?
• What is RDS?
– Hidden populations
– RDS origins and concepts
– RDS applications
– Pitfalls and promises of RDS
Ashton M. Verdery 2
Samples from social networks
Ashton M. Verdery 3
Importance
• Future of social science research
– New populations of interest hard to survey
• e.g., undocumented migrants, drug users
– New analytic tools require new & complex data
• e.g., social network analysis
– Existential threat of declining survey participation
• i.e, all groups are becoming hidden populations
Ashton M. Verdery 4
Silliness
5
http://www.pewresearch.org/
2017/05/15/what-low-
response-rates-mean-for-
telephone-surveys/
Hidden populations
• Collecting data from
hidden populations is
difficult because the
absence of a sampling
frame
– Stigma
– Non response
– Lack of trust
– Rarity
Ashton M. Verdery 6
Household based sampling in Lilongwe, Malawi
Escamilla et al. 2014
How to sample hidden populations?
• Traditional approaches
– Convenience samples
– Clinical samples
– Location samples
• Problems
– Are we learning about people other than those sampled?
• Limited ability to infer representation
• Poor coverage for sampling frame
• Often time intensive, costly, very small samples
Ashton M. Verdery 7
Respondent-Driven Sampling (RDS)
• A sociological method with wide applications
– Heckathorn 1997
• Most popular solution to problems of hidden
populations in recent decades (as of May 2018)
– 510+ studies
– 1.1k+ papers, 20k+ cites
– Over $200 mill. from NIH
• Compare to “ego centric”
– 231 studies funded
– $52 million since 1990
2018
0
25
50
75
100
125
150
Publishedarticlesperyear
1997 1999 2001 2003 2005 2007 2009 2011 2013 2015 2017
RDS applications
• Hidden populations of many stripes
– Men who have sex with men
– People who inject drugs
– Commercial sex workers
– High risk heterosexuals
– Other drug users (opioids, methamphetamines)
– Domestic violence victims
– Victims of sexual violence (child prostitution, sex trafficking, war-time rape)
– Jazz musicians
– Vegetarians and vegans in Argentina
– Wheelchair users
– Non-institutionalized older adults (85+)
• Most common questions
– Can we sample this population?
– What are the characteristics of this population?
– What is the size of this population? 9
Top 10 fields
Ashton M. Verdery 10
Web of Science. May 2018.
Top 25 fields
Ashton M. Verdery 11
Web of Science. May 2018.
RDS overview
Two parts
1) Chain referral / peer recruitment
– “Seed” participants receive two coupons
• Recruit two new participants each
• Dual incentives for participation & recruitment
• Each new respondent given 2 coupons to recruit others
• Process continues until desired sample size is obtained
• (No one participates more than once)
• *Researchers lack control of sampling process
2) Post-recruitment weighting of cases
– Correct for theoretical sampling probabilities
Seeds & coupons
13
Wirtz et al. 2017
• Seeds
– 7-10 population members
– Convenience selection
• Willing to participate
• Large personal networks
• Diverse on relevant attributes
• Distribute coupons
– 2 to 3 per respondent
– Uniquely coded for tracking
• Codes given out & redeemed
– Non-physical coupons
• Possible, but challenging
Coupons
Ashton M. Verdery 14
Contact number
Consent and study
description (on back)
Valid dates
Interview site location
Tracking codes
Example
Ashton M. Verdery 15(Fisher and Merli, Net. Sci.
2014)
Example
16(Verdery, et al Soc. Meth. 2017)
Sampled = black
Example
Ashton M. Verdery 17
(Merli, et al Soc. Sci. Med.
Core resources
• Useful website from Handcock & collaborators
– http://hpmrg.org
• Manuals for RDS survey design
– Johnson tutorial, with questionnaires, consent forms, etc.
• http://applications.emro.who.int/dsaf/EMRPUB_2013_EN_1539.pdf
– CDC, UNAIDS, and others also have useful manuals
• https://www.cdc.gov/hiv/pdf/statistics/systems/nhbs/nhbs-idu3_nhbs-het3-protocol.pdf
• https://globalhealthsciences.ucsf.edu/sites/globalhealthsciences.ucsf.edu/files/ibbs-rds-protocol.pdf
• Software for RDS analysis
– R package “RDS”
• https://cran.r-project.org/web/packages/RDS/index.html
– RDS analyst and coupon manager, stand alone software for RDS:
• http://www.respondentdrivensampling.org/main.htm
– Stata packages
• http://www.stata-journal.com/article.html?article=st0247
• I have unreleased Stata packages for many RDS estimators and RDS multivariate regression
– Fisher’s step-by-step guide to making beautiful RDS plots in Pajek
• Diagnostics for RDS preplanning and post-survey analysis
– http://www.princeton.edu/~mjs3/gile_diagnostics_2014.pdf
Network structure assumptions
There is a social network
Population size large (N>>n)
Homophily weak
Community structure weak
Connected graph w/1 component (giant
component)
All ties reciprocated (undirected)
Known population size N
Sampling assumptions
Sampling with replacement
Single, non-branching chain (1 seed; 1
coupon)
Sufficiently many sample waves
Initial sample of seeds unbiased
Degree accurately measured
Conditionally random referrals (random
Key concepts & assumptions
• Baseline assumptions
– People in the population know
other population members and
will refer them into the study
• Key concepts
– Primary & secondary interviews
– Bias, sampling variance, & RMSE
– Estimates vs. parameters
– Respondent degree
– Random recruitment
– Bottlenecks
• Different estimators make
different assumptions
– Table provides general list
• Not all estimators make each
Ashton M. Verdery 19
(see Gile 2011:144)
Primary & secondary interviews
Ashton M. Verdery 20
Key concepts
• Where 𝑎 is number of samples, 𝑐𝑖 is the
estimated statistic from sample 𝑖, and 𝐶 is
the population parameter:
– Bias
• 𝑏𝑖𝑎𝑠 = 𝑎−1
𝑖=1
𝑖=𝑎
𝑐𝑖 − 𝐶
• “Accuracy”
– Sampling variance
• 𝑆𝑉 = 𝑎−1
𝑖=1
𝑖=𝑎
𝑐𝑖 − 𝑎−1
𝑗=1
𝑗=𝑎
𝑐𝑗
2
• “Precision”
– Root Mean Square Error (RMSE)
• 𝑅𝑀𝑆𝐸 = (𝑏𝑖𝑎𝑠2 + 𝑆𝑉)
• Balancing accuracy and precision
– There are many other error metrics; I like this
– Design effects
• 𝐷𝐸 = 𝑆𝑉𝑅𝐷𝑆 𝑆𝑉𝑆𝑅𝑆
• Precision ratio compared to simple random samples
• Sample size ratios for equivalent efficiency
Verdery, Merli, et al. Epid. 2015.
Just right?
Contrast with SRS
Network: Project 90 (N=4413)
Variable: Percent White
RDS
– Unbiased, 10 seeds, 3 coupons
– Without replacement
– N=150
SRS
– Without replacement
– n=150
Ashton M. Verdery 22
Project 90 network, red nodes=non-white
Verdery et al. 2017
Contrast with SRS
Ashton M. Verdery 23
0
50
100
150
200
250
40 60 80 100
Estimated percentage
RDS
Sample
0
50
100
150
200
250
Numberofsamples
40 60 80 100
Estimated percentage
SRS
Sample
Contrast with SRS
Ashton M. Verdery 24
Backup: https://youtu.be/BZL3XBeG7W8
Contrast with SRS
Ashton M. Verdery 25
Contrast with SRS
(n=400)
Ashton M. Verdery 26
0
10
20
30
Frequency
.5 .6 .7 .8 .9
Estimate
RDS VH weights
SRS w/o replacement
• Early RDS work focused on bias
• But sampling variance may be a
bigger issue
– Design effects
• Can be interpreted as sample size
multiplier to achieve the same
precision as simple random sampling
Bias & sampling variance
27
Estimates vs. parameters
• Worthwhile distinction
– Estimates
– Parameters
• Example
– Sampling variance (SV)
• RDS mean estimators have high SV
– Estimated sampling variance
• RDS SV estimators have high bias
• Same problem for homophily estimates
Verdery et al.,
Plos1 2015
Respondent degree
• Degree
– Popularity
– How many incoming ties
• network assumed undirected
• Typical solicitation
– “how many people do you
know (you know their name
and they know yours) who have
exchanged sex for money in the
past six months?”
– Often, successive restrictions
• Last 30 days, live in area, etc.
• Key element of most mean
estimators
𝑤𝑖 = 𝑑𝑖
−1
𝑖
𝑑𝑖
−1
(Merli, et al Soc. Sci. Med.
Assumption: “random recruitment”
Ashton M. Verdery 30
A
B
C
D
3/9
3/9
3/9
In practice: “preferential recruitment”
Ashton M. Verdery 31
A
B
C
D
4/9
4/9
1/9
Reasons for preferential recruitment
• NOT A REASON
– Has more connections to similar people
• In principle, the weighting approaches should deal with this
• Reasons (not exhaustive)
– Better relationships with similar people
– Wants to help friend who needs money
– Wants friend to get HIV test
– Only friends who do riskier things want to get tested
– Unemployed friends more likely to be encountered
– Etc.
Ashton M. Verdery 32
“Bottlenecks”
• Few ties between clusters
– Assumed to matter
substantially
– Somewhat overstated
• General advice:
– Split sample
– Tough to achieve a priori
With n=500, rds on this
network exhibits 150X
the sampling variance of
SRS and the estimated
sampling variance bears
no relation to this, we
see this in network after
network after network
Mouw & Verdery Soc. Meth. 2012
Salgnik & Goel Stat. Med. 2009
Estimators
• Of the population mean
– At least 11 in current use
• Table on right
• McCreesh et al. 2013
• Crawford 2016
• Gile & Handcock 2015
• Berchenko 2017
• Of the sampling variance
– 5 primary methods in use
• Bootstrap (Salganik 2006)
• Analytical (Volz & Heckathorn 2008)
• Successive Sampling (Gile 2011)
• Model assisted (Gile & Handcock 2015)
• Tree Bootstrap (Baraff et al. 2016)
eTable 1. The seven respondent-driven sampling estimators evaluated in this paper.
Estimator Source
1. Naïve None
2. RDS1-SH Salganik MJ, Heckathorn DD. Sampling and Estimation in Hidden Populations Using
Respondent-Driven Sampling. Sociol Methodol. 2004;34(1):193–240.
doi:10.1111/j.0081-1750.2004.00152.x.
3. RDS1-DS Heckathorn DD. Respondent-Driven Sampling II: Deriving Valid Population Estimates
from Chain-Referral Samples of Hidden Populations. Soc Probl. 2002;49(1):11-34.
doi:10.1525/sp.2002.49.1.11.
4. RDS1-DG Heckathorn DD. Extensions of Respondent-Driven Sampling: Analyzing Continuous
Variables and Controlling for Differential Recruitment. Sociol Methodol.
2007;37(1):151–207. doi:10.1111/j.1467-9531.2007.00188.x.
5. RDS1-LEN Lu X. Linked Ego Networks: Improving estimate reliability and validity with
respondent-driven sampling. Soc Netw. 2013;35(4):669-685.
doi:10.1016/j.socnet.2013.10.001.
6. RDS2-VH Volz E, Heckathorn DD. Probability based estimation theory for respondent driven
sampling. J Off Stat. 2008;24(1):79.
7. RDS2-SS Gile KJ. Improved Inference for Respondent-Driven Sampling Data With Application
to HIV Prevalence Estimation. J Am Stat Assoc. 2011;106(493):135-146.
doi:10.1198/jasa.2011.ap09475.
34
Verdery, et al., Epid. 2015
General comments on estimators
• For the population mean
– “linked ego networks” is best
• Requires respondents know
peer attributes reasonably well
• Can’t calculate for many
variables of interest
– Naïve estimator often works
– Most common
• Volz-Heckathorn
• Successive Sampling
– (In general, SS is better)
• For the sampling variance
– Only the tree bootstrap
method seems to have
anything resembling
reasonable properties
35
Verdery, et al., Epid. 2015
Web-based RDS
• Developing area
– Lots of potential, new pitfalls
• Recommendations
– Differences from traditional
• Be prepared to expand to 30-60 seeds; 20+ waves (generally good)
– Verification
• Respondent Uniqueness
– IP address verification; web-cam interview?
• Respondent is in target population
– In geographic area of interest? Fits other criteria?
• Coupon management
– Careful with secondary incentives
– Remember limitations
• Internet access, etc.
36
If problems…
• Expand recruitment
– Expand number of seeds
– Allow more than 3 recruits
– Raise incentives
– Reduce burdens
• Greater emphasis on anonymity
• Shorten survey
• Drop secondary interview
• If all else fails…
– Convenience sample
– Lean on other features
• It won’t always look like it does on paper
Ashton M. Verdery 37
My recommendations
• 1) Embed additional data collection in RDS
– Qualitative interviews
– Ego network rosters
– Minimally identifiable information about alters
• 2) Examine more than just prevalence
– Population size
– Network structure
– Multivariate relationships
Ashton M. Verdery 38
Promises & pitfalls
Weighting/estimation can yield asymptotically unbiased
estimates of population mean
– Unrealistic assumptions required
– Assumptions can be very difficult to verify
– Some bias in finite samples
Design effects remain high
– Orders of magnitude larger N needed
– Estimates may be far from parameter
– Variance estimators are problematic
But…
– New data on understudied populations
– Very effective method for drawing samples
– Fast samples (50 cases/week)
– Possible to learn a lot about networks (underutilized)
Ashton M. Verdery 39
Thank you!
Portions of this work were supported by a grant from the National Institutes of
Health (1 R03 SH000056-01; Verdery PI): “Multivariate Regression with Respondent-
Driven Sampling Data.”
I also appreciate assistance from the Justice Center for Research, the Institute for
CyberScience, the Social Science Research Institute, the College of the Liberal Arts,
and the Population Research Institute at Penn State University, the last of which is
supported by an infrastructure grant from the Eunice Kennedy Shriver National
Institute of Child Health and Human Development (P2CHD041025 & R24 HD041025).
Other portions of this work benefitted from support from the Duke Network Analysis
Center, the Duke Population Research Institute, and the Carolina Population Center.
Ashton M. Verdery: amv5430@psu.edu
I thank many coauthors: M. Giovanna Merli, James Moody, Ted Mouw,
Peter J. Mucha, Jacob C. Fisher, Shawn Bauldry, Nalyn Siripong, Jeff
Smith, Kahina Abdessalem, Sergio Chavez, Heather Edelblute, Jing Li,
Jose Luis Molina, Miranda Lubbers, Sara Francisco, Claire Kelling, Anne
DeLessio-Parson, & David Hunter.

03 RDS

  • 1.
    Respondent-Driven Sampling: An Overview AshtonM. Verdery Duke Network Analysis Center May, 2018
  • 2.
    Outline • Leveraging socialnetworks for sampling – Why? – How? • What is RDS? – Hidden populations – RDS origins and concepts – RDS applications – Pitfalls and promises of RDS Ashton M. Verdery 2
  • 3.
    Samples from socialnetworks Ashton M. Verdery 3
  • 4.
    Importance • Future ofsocial science research – New populations of interest hard to survey • e.g., undocumented migrants, drug users – New analytic tools require new & complex data • e.g., social network analysis – Existential threat of declining survey participation • i.e, all groups are becoming hidden populations Ashton M. Verdery 4
  • 5.
  • 6.
    Hidden populations • Collectingdata from hidden populations is difficult because the absence of a sampling frame – Stigma – Non response – Lack of trust – Rarity Ashton M. Verdery 6 Household based sampling in Lilongwe, Malawi Escamilla et al. 2014
  • 7.
    How to samplehidden populations? • Traditional approaches – Convenience samples – Clinical samples – Location samples • Problems – Are we learning about people other than those sampled? • Limited ability to infer representation • Poor coverage for sampling frame • Often time intensive, costly, very small samples Ashton M. Verdery 7
  • 8.
    Respondent-Driven Sampling (RDS) •A sociological method with wide applications – Heckathorn 1997 • Most popular solution to problems of hidden populations in recent decades (as of May 2018) – 510+ studies – 1.1k+ papers, 20k+ cites – Over $200 mill. from NIH • Compare to “ego centric” – 231 studies funded – $52 million since 1990 2018 0 25 50 75 100 125 150 Publishedarticlesperyear 1997 1999 2001 2003 2005 2007 2009 2011 2013 2015 2017
  • 9.
    RDS applications • Hiddenpopulations of many stripes – Men who have sex with men – People who inject drugs – Commercial sex workers – High risk heterosexuals – Other drug users (opioids, methamphetamines) – Domestic violence victims – Victims of sexual violence (child prostitution, sex trafficking, war-time rape) – Jazz musicians – Vegetarians and vegans in Argentina – Wheelchair users – Non-institutionalized older adults (85+) • Most common questions – Can we sample this population? – What are the characteristics of this population? – What is the size of this population? 9
  • 10.
    Top 10 fields AshtonM. Verdery 10 Web of Science. May 2018.
  • 11.
    Top 25 fields AshtonM. Verdery 11 Web of Science. May 2018.
  • 12.
    RDS overview Two parts 1)Chain referral / peer recruitment – “Seed” participants receive two coupons • Recruit two new participants each • Dual incentives for participation & recruitment • Each new respondent given 2 coupons to recruit others • Process continues until desired sample size is obtained • (No one participates more than once) • *Researchers lack control of sampling process 2) Post-recruitment weighting of cases – Correct for theoretical sampling probabilities
  • 13.
    Seeds & coupons 13 Wirtzet al. 2017 • Seeds – 7-10 population members – Convenience selection • Willing to participate • Large personal networks • Diverse on relevant attributes • Distribute coupons – 2 to 3 per respondent – Uniquely coded for tracking • Codes given out & redeemed – Non-physical coupons • Possible, but challenging
  • 14.
    Coupons Ashton M. Verdery14 Contact number Consent and study description (on back) Valid dates Interview site location Tracking codes
  • 15.
    Example Ashton M. Verdery15(Fisher and Merli, Net. Sci. 2014)
  • 16.
    Example 16(Verdery, et alSoc. Meth. 2017) Sampled = black
  • 17.
    Example Ashton M. Verdery17 (Merli, et al Soc. Sci. Med.
  • 18.
    Core resources • Usefulwebsite from Handcock & collaborators – http://hpmrg.org • Manuals for RDS survey design – Johnson tutorial, with questionnaires, consent forms, etc. • http://applications.emro.who.int/dsaf/EMRPUB_2013_EN_1539.pdf – CDC, UNAIDS, and others also have useful manuals • https://www.cdc.gov/hiv/pdf/statistics/systems/nhbs/nhbs-idu3_nhbs-het3-protocol.pdf • https://globalhealthsciences.ucsf.edu/sites/globalhealthsciences.ucsf.edu/files/ibbs-rds-protocol.pdf • Software for RDS analysis – R package “RDS” • https://cran.r-project.org/web/packages/RDS/index.html – RDS analyst and coupon manager, stand alone software for RDS: • http://www.respondentdrivensampling.org/main.htm – Stata packages • http://www.stata-journal.com/article.html?article=st0247 • I have unreleased Stata packages for many RDS estimators and RDS multivariate regression – Fisher’s step-by-step guide to making beautiful RDS plots in Pajek • Diagnostics for RDS preplanning and post-survey analysis – http://www.princeton.edu/~mjs3/gile_diagnostics_2014.pdf
  • 19.
    Network structure assumptions Thereis a social network Population size large (N>>n) Homophily weak Community structure weak Connected graph w/1 component (giant component) All ties reciprocated (undirected) Known population size N Sampling assumptions Sampling with replacement Single, non-branching chain (1 seed; 1 coupon) Sufficiently many sample waves Initial sample of seeds unbiased Degree accurately measured Conditionally random referrals (random Key concepts & assumptions • Baseline assumptions – People in the population know other population members and will refer them into the study • Key concepts – Primary & secondary interviews – Bias, sampling variance, & RMSE – Estimates vs. parameters – Respondent degree – Random recruitment – Bottlenecks • Different estimators make different assumptions – Table provides general list • Not all estimators make each Ashton M. Verdery 19 (see Gile 2011:144)
  • 20.
    Primary & secondaryinterviews Ashton M. Verdery 20
  • 21.
    Key concepts • Where𝑎 is number of samples, 𝑐𝑖 is the estimated statistic from sample 𝑖, and 𝐶 is the population parameter: – Bias • 𝑏𝑖𝑎𝑠 = 𝑎−1 𝑖=1 𝑖=𝑎 𝑐𝑖 − 𝐶 • “Accuracy” – Sampling variance • 𝑆𝑉 = 𝑎−1 𝑖=1 𝑖=𝑎 𝑐𝑖 − 𝑎−1 𝑗=1 𝑗=𝑎 𝑐𝑗 2 • “Precision” – Root Mean Square Error (RMSE) • 𝑅𝑀𝑆𝐸 = (𝑏𝑖𝑎𝑠2 + 𝑆𝑉) • Balancing accuracy and precision – There are many other error metrics; I like this – Design effects • 𝐷𝐸 = 𝑆𝑉𝑅𝐷𝑆 𝑆𝑉𝑆𝑅𝑆 • Precision ratio compared to simple random samples • Sample size ratios for equivalent efficiency Verdery, Merli, et al. Epid. 2015. Just right?
  • 22.
    Contrast with SRS Network:Project 90 (N=4413) Variable: Percent White RDS – Unbiased, 10 seeds, 3 coupons – Without replacement – N=150 SRS – Without replacement – n=150 Ashton M. Verdery 22 Project 90 network, red nodes=non-white Verdery et al. 2017
  • 23.
    Contrast with SRS AshtonM. Verdery 23 0 50 100 150 200 250 40 60 80 100 Estimated percentage RDS Sample 0 50 100 150 200 250 Numberofsamples 40 60 80 100 Estimated percentage SRS Sample
  • 24.
    Contrast with SRS AshtonM. Verdery 24 Backup: https://youtu.be/BZL3XBeG7W8
  • 25.
  • 26.
    Contrast with SRS (n=400) AshtonM. Verdery 26 0 10 20 30 Frequency .5 .6 .7 .8 .9 Estimate RDS VH weights SRS w/o replacement
  • 27.
    • Early RDSwork focused on bias • But sampling variance may be a bigger issue – Design effects • Can be interpreted as sample size multiplier to achieve the same precision as simple random sampling Bias & sampling variance 27
  • 28.
    Estimates vs. parameters •Worthwhile distinction – Estimates – Parameters • Example – Sampling variance (SV) • RDS mean estimators have high SV – Estimated sampling variance • RDS SV estimators have high bias • Same problem for homophily estimates Verdery et al., Plos1 2015
  • 29.
    Respondent degree • Degree –Popularity – How many incoming ties • network assumed undirected • Typical solicitation – “how many people do you know (you know their name and they know yours) who have exchanged sex for money in the past six months?” – Often, successive restrictions • Last 30 days, live in area, etc. • Key element of most mean estimators 𝑤𝑖 = 𝑑𝑖 −1 𝑖 𝑑𝑖 −1 (Merli, et al Soc. Sci. Med.
  • 30.
    Assumption: “random recruitment” AshtonM. Verdery 30 A B C D 3/9 3/9 3/9
  • 31.
    In practice: “preferentialrecruitment” Ashton M. Verdery 31 A B C D 4/9 4/9 1/9
  • 32.
    Reasons for preferentialrecruitment • NOT A REASON – Has more connections to similar people • In principle, the weighting approaches should deal with this • Reasons (not exhaustive) – Better relationships with similar people – Wants to help friend who needs money – Wants friend to get HIV test – Only friends who do riskier things want to get tested – Unemployed friends more likely to be encountered – Etc. Ashton M. Verdery 32
  • 33.
    “Bottlenecks” • Few tiesbetween clusters – Assumed to matter substantially – Somewhat overstated • General advice: – Split sample – Tough to achieve a priori With n=500, rds on this network exhibits 150X the sampling variance of SRS and the estimated sampling variance bears no relation to this, we see this in network after network after network Mouw & Verdery Soc. Meth. 2012 Salgnik & Goel Stat. Med. 2009
  • 34.
    Estimators • Of thepopulation mean – At least 11 in current use • Table on right • McCreesh et al. 2013 • Crawford 2016 • Gile & Handcock 2015 • Berchenko 2017 • Of the sampling variance – 5 primary methods in use • Bootstrap (Salganik 2006) • Analytical (Volz & Heckathorn 2008) • Successive Sampling (Gile 2011) • Model assisted (Gile & Handcock 2015) • Tree Bootstrap (Baraff et al. 2016) eTable 1. The seven respondent-driven sampling estimators evaluated in this paper. Estimator Source 1. Naïve None 2. RDS1-SH Salganik MJ, Heckathorn DD. Sampling and Estimation in Hidden Populations Using Respondent-Driven Sampling. Sociol Methodol. 2004;34(1):193–240. doi:10.1111/j.0081-1750.2004.00152.x. 3. RDS1-DS Heckathorn DD. Respondent-Driven Sampling II: Deriving Valid Population Estimates from Chain-Referral Samples of Hidden Populations. Soc Probl. 2002;49(1):11-34. doi:10.1525/sp.2002.49.1.11. 4. RDS1-DG Heckathorn DD. Extensions of Respondent-Driven Sampling: Analyzing Continuous Variables and Controlling for Differential Recruitment. Sociol Methodol. 2007;37(1):151–207. doi:10.1111/j.1467-9531.2007.00188.x. 5. RDS1-LEN Lu X. Linked Ego Networks: Improving estimate reliability and validity with respondent-driven sampling. Soc Netw. 2013;35(4):669-685. doi:10.1016/j.socnet.2013.10.001. 6. RDS2-VH Volz E, Heckathorn DD. Probability based estimation theory for respondent driven sampling. J Off Stat. 2008;24(1):79. 7. RDS2-SS Gile KJ. Improved Inference for Respondent-Driven Sampling Data With Application to HIV Prevalence Estimation. J Am Stat Assoc. 2011;106(493):135-146. doi:10.1198/jasa.2011.ap09475. 34 Verdery, et al., Epid. 2015
  • 35.
    General comments onestimators • For the population mean – “linked ego networks” is best • Requires respondents know peer attributes reasonably well • Can’t calculate for many variables of interest – Naïve estimator often works – Most common • Volz-Heckathorn • Successive Sampling – (In general, SS is better) • For the sampling variance – Only the tree bootstrap method seems to have anything resembling reasonable properties 35 Verdery, et al., Epid. 2015
  • 36.
    Web-based RDS • Developingarea – Lots of potential, new pitfalls • Recommendations – Differences from traditional • Be prepared to expand to 30-60 seeds; 20+ waves (generally good) – Verification • Respondent Uniqueness – IP address verification; web-cam interview? • Respondent is in target population – In geographic area of interest? Fits other criteria? • Coupon management – Careful with secondary incentives – Remember limitations • Internet access, etc. 36
  • 37.
    If problems… • Expandrecruitment – Expand number of seeds – Allow more than 3 recruits – Raise incentives – Reduce burdens • Greater emphasis on anonymity • Shorten survey • Drop secondary interview • If all else fails… – Convenience sample – Lean on other features • It won’t always look like it does on paper Ashton M. Verdery 37
  • 38.
    My recommendations • 1)Embed additional data collection in RDS – Qualitative interviews – Ego network rosters – Minimally identifiable information about alters • 2) Examine more than just prevalence – Population size – Network structure – Multivariate relationships Ashton M. Verdery 38
  • 39.
    Promises & pitfalls Weighting/estimationcan yield asymptotically unbiased estimates of population mean – Unrealistic assumptions required – Assumptions can be very difficult to verify – Some bias in finite samples Design effects remain high – Orders of magnitude larger N needed – Estimates may be far from parameter – Variance estimators are problematic But… – New data on understudied populations – Very effective method for drawing samples – Fast samples (50 cases/week) – Possible to learn a lot about networks (underutilized) Ashton M. Verdery 39
  • 40.
    Thank you! Portions ofthis work were supported by a grant from the National Institutes of Health (1 R03 SH000056-01; Verdery PI): “Multivariate Regression with Respondent- Driven Sampling Data.” I also appreciate assistance from the Justice Center for Research, the Institute for CyberScience, the Social Science Research Institute, the College of the Liberal Arts, and the Population Research Institute at Penn State University, the last of which is supported by an infrastructure grant from the Eunice Kennedy Shriver National Institute of Child Health and Human Development (P2CHD041025 & R24 HD041025). Other portions of this work benefitted from support from the Duke Network Analysis Center, the Duke Population Research Institute, and the Carolina Population Center. Ashton M. Verdery: amv5430@psu.edu I thank many coauthors: M. Giovanna Merli, James Moody, Ted Mouw, Peter J. Mucha, Jacob C. Fisher, Shawn Bauldry, Nalyn Siripong, Jeff Smith, Kahina Abdessalem, Sergio Chavez, Heather Edelblute, Jing Li, Jose Luis Molina, Miranda Lubbers, Sara Francisco, Claire Kelling, Anne DeLessio-Parson, & David Hunter.

Editor's Notes

  • #37 See Bengston et al. 2012 for a successful case