This document discusses factors that influence atmospheric pressure and wind climate. It explains that atmospheric pressure is measured by barometer and is influenced by average pressure, altitude, and air temperature. Warm air is less dense and causes low pressure areas and precipitation, while cold, dense air causes high pressure areas. Wind is caused by differences in atmospheric pressure and blows from high to low pressure areas. The document outlines some of the most important global wind patterns like trade winds and polar winds that help transport heat between cold and warm zones.
The climate of a region is ultimately determined by the radiation energy of the sun, and its distribution and temporal fluctuations. The long-term state of the atmosphere is a function of a variety of interacting elements. They are: Solar radiation, Air masses, Pressure systems (and cyclone belts),Ocean Currents, and topography.
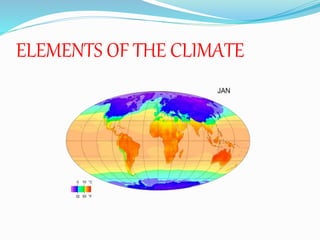
TEMPERATURE
COMPOSITION OF THE ATMOSPHERE
Layers of the ATMOSPHERE
WEATHER and CLIMATE
LATITUDINAL ZONES
ELEMENTS & CONTROLS OF WEATHER & CLIMATE
WARM MAJOR CURRENTS OF THE WORLD
Land Breeze & Sea Breeze
The climate of a region is ultimately determined by the radiation energy of the sun, and its distribution and temporal fluctuations. The long-term state of the atmosphere is a function of a variety of interacting elements. They are: Solar radiation, Air masses, Pressure systems (and cyclone belts),Ocean Currents, and topography.
TEMPERATURE
COMPOSITION OF THE ATMOSPHERE
Layers of the ATMOSPHERE
WEATHER and CLIMATE
LATITUDINAL ZONES
ELEMENTS & CONTROLS OF WEATHER & CLIMATE
WARM MAJOR CURRENTS OF THE WORLD
Land Breeze & Sea Breeze
O Uber no Recife e a inaplicabilidade, ao caso, da regulamentação municipal p...Luísa Dubourcq Santana
No último dia 03/03, o Uber iniciou suas operações no Recife, gerando, com isso, discussões acerca de sua legalidade, notadamente em face do previsto na Lei Municipal nº 18.176/2015. Buscando esclarecer um pouco o assunto, compartilho artigo que escrevi em conjunto com Edinaldo Amaral acerca do tema.
General Atmospheric
Circulation
Unit 6b
General Circulation of the Atmosphere
• Single-cell model (Hadley, 1735)
• Assumes:
– non-rotating earth
– uniform surface
• Low Pressure at Equator (warm air rising)
• High Pressure at Poles (cold air sinking)
• Creates a thermal convection cell
Three Cell Model
• Due to earth’s rotation and other
dynamic factors there are typically 3
primary cells
– Hadley Cell (tropics)
– Midlatitude Cell (Ferrel)
– Polar Cell (polar zones)
Three Cell Model
Hadley Cell
Primary High & Low Pressure Areas
Equatorial Low Pressure (ITCZ)
Subtropical High Pressure
Subpolar Low Pressure
Polar High Pressure
Equatorial Low Pressure
Intertropical Convergence Zone (ITCZ)
±10° N & S
Thermally-induced low pressure
Clouds and rain
Limited wind (doldrums)
Seasonal shift N-S
Subtropical High Pressure
• Dynamic high pressure
– subsiding air of Hadley Cell
– between 20° - 35° N & S
• Creates hot, dry air
– Clear skies, limited wind (horse latitudes)
– e.g., Bermuda High, Hawaiian High
• Strengthen/weaken seasonally
• Shift N & S with sun’s declination
Subpolar Low Pressure
• Dynamic low pressure
– air forced to rise
– along polar front
• Cool, moist, cloudy
• Frequent cyclonic storms
– e.g., Aleutian Low, Icelandic Low
• strengthen/weaken seasonally
General Circulation
(Side-View)
General Circulation – Surface Winds
Trade Winds (tropical)
Westerlies (midlatitudes)
Polar Easterlies
Trade Winds
Trade Winds (tropical)
– from subtropical highs to equatorial lows
– northeast trades & southeast trades
Westerlies
Westerlies (midlatitudes)
– from the subtropical highs to the subpolar lows (west à
east)
– tend to be wavy (meridional flow)
Polar Easterlies
Polar Easterlies
– from polar highs to subpolar lows
– variable, cold, dry winds
www.atmo.arizona.edu
General Circulation – Upper Air Flow
(geostrophic winds)
• Westerlies
– subtropics à poles
– occur as Rossby Waves Jet Streams
– areas of high wind velocity within the westerlies
• Subtropical Jet
– 20° - 50° N & S
– 10,000 – 15,000 m
• Polar Jet
– 30° - 70° N & S
– 8,000 – 12,000 m
Jet Stream
Rossby Waves
http://svs.gsfc.nasa.gov/vis/a010000/a0
10900/a010902/
http://www.geography.hunter.cuny.edu/tbw/wc
.notes/7.circ.atm/rossby_waves.htm
Local and Regional Winds
Ocean Circulation
Unit 6c
Local and Regional Winds
Land/Sea Breeze
Mountain/Valley Breeze
Katabatic Winds
Compressional Winds
Monsoons
Land/Sea Breeze
• thermal circulation
• best developed in summer
• land heats up during day, creates relative low
pressure forming sea breeze
• land cools off at night creates relative high pressure
forming land breeze
Mountain/Valley Breeze
• thermal circulation
• best developed in summer
• slopes heat up during the day causing an upslope
wind (valley breeze)
• slopes cool off at night causing a downslope wind
(mountain breeze)
Katabatic Wind
Cold downslope wind
cold air = greater densit ...
Earliest Galaxies in the JADES Origins Field: Luminosity Function and Cosmic ...Sérgio Sacani
We characterize the earliest galaxy population in the JADES Origins Field (JOF), the deepest
imaging field observed with JWST. We make use of the ancillary Hubble optical images (5 filters
spanning 0.4−0.9µm) and novel JWST images with 14 filters spanning 0.8−5µm, including 7 mediumband filters, and reaching total exposure times of up to 46 hours per filter. We combine all our data
at > 2.3µm to construct an ultradeep image, reaching as deep as ≈ 31.4 AB mag in the stack and
30.3-31.0 AB mag (5σ, r = 0.1” circular aperture) in individual filters. We measure photometric
redshifts and use robust selection criteria to identify a sample of eight galaxy candidates at redshifts
z = 11.5 − 15. These objects show compact half-light radii of R1/2 ∼ 50 − 200pc, stellar masses of
M⋆ ∼ 107−108M⊙, and star-formation rates of SFR ∼ 0.1−1 M⊙ yr−1
. Our search finds no candidates
at 15 < z < 20, placing upper limits at these redshifts. We develop a forward modeling approach to
infer the properties of the evolving luminosity function without binning in redshift or luminosity that
marginalizes over the photometric redshift uncertainty of our candidate galaxies and incorporates the
impact of non-detections. We find a z = 12 luminosity function in good agreement with prior results,
and that the luminosity function normalization and UV luminosity density decline by a factor of ∼ 2.5
from z = 12 to z = 14. We discuss the possible implications of our results in the context of theoretical
models for evolution of the dark matter halo mass function.
A brief information about the SCOP protein database used in bioinformatics.
The Structural Classification of Proteins (SCOP) database is a comprehensive and authoritative resource for the structural and evolutionary relationships of proteins. It provides a detailed and curated classification of protein structures, grouping them into families, superfamilies, and folds based on their structural and sequence similarities.
Observation of Io’s Resurfacing via Plume Deposition Using Ground-based Adapt...Sérgio Sacani
Since volcanic activity was first discovered on Io from Voyager images in 1979, changes
on Io’s surface have been monitored from both spacecraft and ground-based telescopes.
Here, we present the highest spatial resolution images of Io ever obtained from a groundbased telescope. These images, acquired by the SHARK-VIS instrument on the Large
Binocular Telescope, show evidence of a major resurfacing event on Io’s trailing hemisphere. When compared to the most recent spacecraft images, the SHARK-VIS images
show that a plume deposit from a powerful eruption at Pillan Patera has covered part
of the long-lived Pele plume deposit. Although this type of resurfacing event may be common on Io, few have been detected due to the rarity of spacecraft visits and the previously low spatial resolution available from Earth-based telescopes. The SHARK-VIS instrument ushers in a new era of high resolution imaging of Io’s surface using adaptive
optics at visible wavelengths.
This pdf is about the Schizophrenia.
For more details visit on YouTube; @SELF-EXPLANATORY;
https://www.youtube.com/channel/UCAiarMZDNhe1A3Rnpr_WkzA/videos
Thanks...!
(May 29th, 2024) Advancements in Intravital Microscopy- Insights for Preclini...Scintica Instrumentation
Intravital microscopy (IVM) is a powerful tool utilized to study cellular behavior over time and space in vivo. Much of our understanding of cell biology has been accomplished using various in vitro and ex vivo methods; however, these studies do not necessarily reflect the natural dynamics of biological processes. Unlike traditional cell culture or fixed tissue imaging, IVM allows for the ultra-fast high-resolution imaging of cellular processes over time and space and were studied in its natural environment. Real-time visualization of biological processes in the context of an intact organism helps maintain physiological relevance and provide insights into the progression of disease, response to treatments or developmental processes.
In this webinar we give an overview of advanced applications of the IVM system in preclinical research. IVIM technology is a provider of all-in-one intravital microscopy systems and solutions optimized for in vivo imaging of live animal models at sub-micron resolution. The system’s unique features and user-friendly software enables researchers to probe fast dynamic biological processes such as immune cell tracking, cell-cell interaction as well as vascularization and tumor metastasis with exceptional detail. This webinar will also give an overview of IVM being utilized in drug development, offering a view into the intricate interaction between drugs/nanoparticles and tissues in vivo and allows for the evaluation of therapeutic intervention in a variety of tissues and organs. This interdisciplinary collaboration continues to drive the advancements of novel therapeutic strategies.
Cancer cell metabolism: special Reference to Lactate PathwayAADYARAJPANDEY1
Normal Cell Metabolism:
Cellular respiration describes the series of steps that cells use to break down sugar and other chemicals to get the energy we need to function.
Energy is stored in the bonds of glucose and when glucose is broken down, much of that energy is released.
Cell utilize energy in the form of ATP.
The first step of respiration is called glycolysis. In a series of steps, glycolysis breaks glucose into two smaller molecules - a chemical called pyruvate. A small amount of ATP is formed during this process.
Most healthy cells continue the breakdown in a second process, called the Kreb's cycle. The Kreb's cycle allows cells to “burn” the pyruvates made in glycolysis to get more ATP.
The last step in the breakdown of glucose is called oxidative phosphorylation (Ox-Phos).
It takes place in specialized cell structures called mitochondria. This process produces a large amount of ATP. Importantly, cells need oxygen to complete oxidative phosphorylation.
If a cell completes only glycolysis, only 2 molecules of ATP are made per glucose. However, if the cell completes the entire respiration process (glycolysis - Kreb's - oxidative phosphorylation), about 36 molecules of ATP are created, giving it much more energy to use.
IN CANCER CELL:
Unlike healthy cells that "burn" the entire molecule of sugar to capture a large amount of energy as ATP, cancer cells are wasteful.
Cancer cells only partially break down sugar molecules. They overuse the first step of respiration, glycolysis. They frequently do not complete the second step, oxidative phosphorylation.
This results in only 2 molecules of ATP per each glucose molecule instead of the 36 or so ATPs healthy cells gain. As a result, cancer cells need to use a lot more sugar molecules to get enough energy to survive.
introduction to WARBERG PHENOMENA:
WARBURG EFFECT Usually, cancer cells are highly glycolytic (glucose addiction) and take up more glucose than do normal cells from outside.
Otto Heinrich Warburg (; 8 October 1883 – 1 August 1970) In 1931 was awarded the Nobel Prize in Physiology for his "discovery of the nature and mode of action of the respiratory enzyme.
WARNBURG EFFECT : cancer cells under aerobic (well-oxygenated) conditions to metabolize glucose to lactate (aerobic glycolysis) is known as the Warburg effect. Warburg made the observation that tumor slices consume glucose and secrete lactate at a higher rate than normal tissues.
Professional air quality monitoring systems provide immediate, on-site data for analysis, compliance, and decision-making.
Monitor common gases, weather parameters, particulates.
Multi-source connectivity as the driver of solar wind variability in the heli...Sérgio Sacani
The ambient solar wind that flls the heliosphere originates from multiple
sources in the solar corona and is highly structured. It is often described
as high-speed, relatively homogeneous, plasma streams from coronal
holes and slow-speed, highly variable, streams whose source regions are
under debate. A key goal of ESA/NASA’s Solar Orbiter mission is to identify
solar wind sources and understand what drives the complexity seen in the
heliosphere. By combining magnetic feld modelling and spectroscopic
techniques with high-resolution observations and measurements, we show
that the solar wind variability detected in situ by Solar Orbiter in March
2022 is driven by spatio-temporal changes in the magnetic connectivity to
multiple sources in the solar atmosphere. The magnetic feld footpoints
connected to the spacecraft moved from the boundaries of a coronal hole
to one active region (12961) and then across to another region (12957). This
is refected in the in situ measurements, which show the transition from fast
to highly Alfvénic then to slow solar wind that is disrupted by the arrival of
a coronal mass ejection. Our results describe solar wind variability at 0.5 au
but are applicable to near-Earth observatories.
Seminar of U.V. Spectroscopy by SAMIR PANDASAMIR PANDA
Spectroscopy is a branch of science dealing the study of interaction of electromagnetic radiation with matter.
Ultraviolet-visible spectroscopy refers to absorption spectroscopy or reflect spectroscopy in the UV-VIS spectral region.
Ultraviolet-visible spectroscopy is an analytical method that can measure the amount of light received by the analyte.
2. INTRODUCCTION
In this article I will talk about how it influences
atmospheric pressure and wind climate. The factors of
the atmospheric pressure are the average pressure,
altitude and air temperature. And also I will discuss
the factors of the wind.
3. ATMOSPHERIC PRESSURE
The atmospheric pressure is the weight of a
column of air on a place is measured with a
barometer and is expressed as millibars
(mb).
The average pressure is measured at sea level.
The areas with a pressure higher than the
average are anticyclones (A) and the areas of
lower pressure are depressions (B).
4. DIFFERENTS IN PRESSURE
increase in altitude.
-Air temperature: warm air is less, dense and
lighter so its tends to rise. This produces low
pressure and precipitations, cold air is denser and
heavier, so its tends to fall. Its produces: high
pressure or an anticyclone.
·Equator: permanent low pressure.
·Tropics and Poles: permanent high pressure.
·Temperate zones: high and low pressure alternates.
5. WIND
Wind is the horizontal
movement of air, it is
measured with the
anemometer and its
direction is measured
with the weather vane
that is based on the
cardinal point of the
source of the wind.
The factor that causes the
wind is the difference in
atmospheric pressure, the
wind always blows from
areas of high pressure
towards areas of low
pressure.
6. MOST IMPORTANT WINDS
On the Earth, there are constant winds that transport
hot air towards the cold zones and vice versa,
maintaining equilibrium temperatures. The most
important winds are:
-Trade winds
-West winds
-Polar winds
7. Can you tell me
what types of
currents see in
these images?
Tell me what ways
have the cold
currents and forms
the warm.