Downloaded 109 times

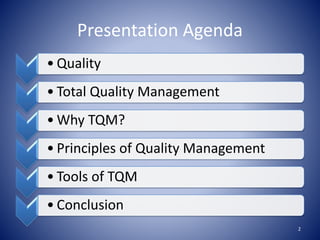


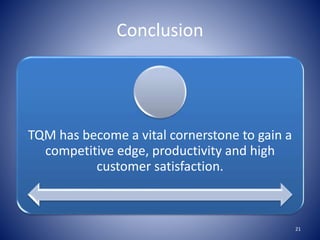


This presentation provides an overview of Total Quality Management (TQM). It begins with defining quality and TQM, outlining that TQM aims to hold all parties accountable for quality and ensure continuous improvement. The presentation then covers the principles and benefits of TQM, including making organizations more competitive and building a culture of success. It also outlines several quality management tools, such as statistical control charts, acceptance sampling, Six Sigma, benchmarking, and quality circles. In conclusion, it emphasizes that TQM has become vital for gaining a competitive advantage through high productivity and customer satisfaction.