Downloaded 86 times


![55
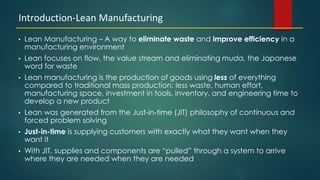
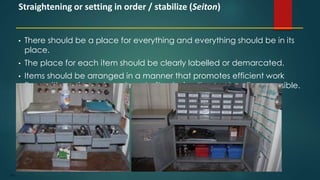
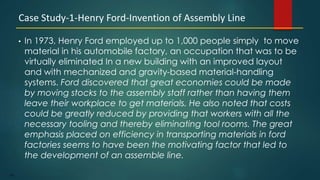
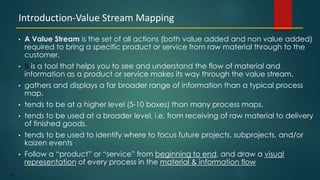
• In today’s ever-changing world, the only thing that doesn’t change is
‘change’ itself. In a world increasingly driven by the three Cs:
Customer, Competition and Change,
• companies are on the lookout for new solutions for their business
problems[4]. Recently, some of the more successful business
corporations in the world seem to have hit upon an incredible solution:
Business Process Reengineering (BPR).
• Some of the recent headlines in the popular press read, “Wal-Mart
reduces restocking time from six weeks
• to thirty-six hours.”” Hewlett Packard’s assembly time for server
computers touches new low- four minutes.”
• The reason behind these success stories: Business Process
Reengineering!
Introduction-Business Process-Re-engineering](https://image.slidesharecdn.com/qualitymanagementprinciples-operationmanagement-amitkumarsingh-150524221542-lva1-app6892/85/Quality-management-principles-operation-management-amit-kumar-singh-55-320.jpg)


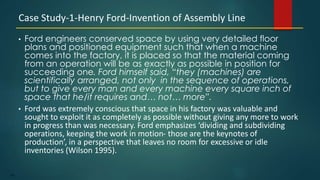


![181
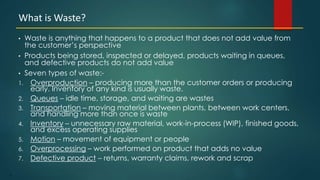
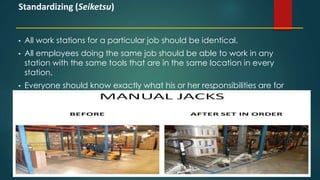
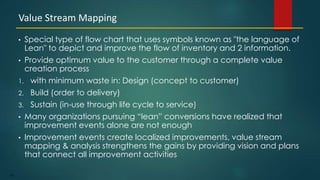
• Determining if the long term process average is rising, falling, or
remaining the same.
• Identifying common causes of variation in our processes. Common
cause refers to that fact that the processes we use contain sources of
variation. We should seek to reduce or limit common causes of
variation [i.e. improve the process capability].
• Calling attention to data points which falls beyond the statistically
determined control limits. Such points generally represent special
causes of variation. Sometimes these data points can be attributed to
individuals. By changing the behavior of some individuals we can
improve results.
Summarizing SPC Charts](https://image.slidesharecdn.com/qualitymanagementprinciples-operationmanagement-amitkumarsingh-150524221542-lva1-app6892/85/Quality-management-principles-operation-management-amit-kumar-singh-181-320.jpg)


This document provides an overview of several quality management principles and methodologies, including: - Lean manufacturing, which aims to eliminate waste and improve efficiency. Key aspects are flow, value streams, and eliminating muda (waste). - The seven types of waste in lean manufacturing: overproduction, queues, transportation, inventory, motion, overprocessing, and defects. - Just-in-time manufacturing, which supplies customers with exactly what they want when they want it by pulling supplies through the system as needed. - Six Sigma, which identifies and removes defects from processes to improve quality using a DMAIC methodology of define, measure, analyze, improve, and control. - Total quality management, which takes


![Introduction to Total Quality Management[TQM]](https://cdn.slidesharecdn.com/ss_thumbnails/introtqm-200319085918-thumbnail.jpg?width=640&height=640&fit=bounds)


