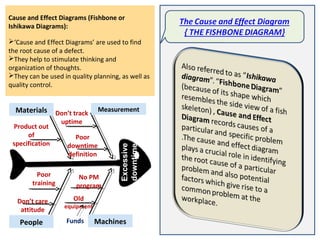
0
5
10
Goodnessof the
product
Badnessof
product
Asthegoodnessof the
product increases, the
quality of theproduct
increases.
Asthebadnessof the
product increases, the
quality of theproduct
decreases.
Sinceit issaid that theamount of
‘Goodness’ or ‘Badness’ present in a
product isknown to beasits Quality.
THERE ARE SEVEN PILLARS OF TPM
Return
Involvement of all people in support
functions for focusing on better plant
performance
Better utilized work area
Reduce repetitive work
Reduced inventory levels in all parts
of the supply chain
Reduced administrative costs
Reduced inventory carrying cost
Reduction in number of files
Reduction of overhead costs (to
include cost of non-production/non
capital equipment)
Productivity of people in support
functions
Reduction in breakdown of office
equipment
Reduction of customer complaints
due to logistics
Reduction in expenses due to
emergency dispatches/purchases
Reduced manpower
Clean and pleasant work
Target :
1) Zero accident
2) Zero health damage
3) Zero fires
In this area focus is
on to create a safe
workplace and a
surrounding area that is
not damaged by our
process or procedures.
This pillar will play an
active role in each of the
other pillars on a regular
basis.
Total Quality Management is
defined as a continuous effort by
the management as well as
employees of a particular
organization to ensure long term
customer loyalty and customer
satisfaction.
Why would a customer come to
you if your competitor is also
offering the same product?
The difference has to be there
in quality. Your brand needs to be
superior for it to stand apart from
the rest
Planning is the most crucial phase
of total quality management. In
this phase employees have to
come up with their problems and
queries which need to be
addressed. They need to come up
with the various challenges they
face in their day to day
operations and also analyze the
problem’s root cause. Employees
are required to do necessary
research and collect relevant data
which would help them find
solutions to all the problems.
In the doing phase,
employees develop a
solution for the problems
defined in planning phase.
Strategies are devised and
implemented to overcome
the challenges faced by
employees. The
effectiveness of solutions
and strategies is also
measured in this stage.
Checking phase is
the stage where
people actually do a
comparison analysis
of before and after
data to confirm the
effectiveness of the
processes and
measure the results.
In this phase
employees
document their
results and
prepare
themselves to
address other
problems.
“Quality management” ensures
superior quality products and
services.
Quality management is essential for
customer satisfaction which
eventually leads to customer loyalty.
Quality management tools help an
organization to design and create a
product which the customer actually
wants and desires.
Quality Management ensures
increased revenues and higher
productivity for the organization.
Quality management helps
organizations to reduce waste and
inventory.
Check ListCheck List
Cause and Effect Diagrams (Fishbone or
Ishikawa Diagrams):
‘Cause and Effect Diagrams’ are used to find
the root cause of a defect.
They help to stimulate thinking and
organization of thoughts.
They can be used in quality planning, as well as
quality control.
Excessive
downtime
MeasurementMaterials
MachinesPeople
No PM
program
Old
equipment
Product out
of
specification
Poor
training
Don’t care
attitude
Don’t track
uptime
Poor
downtime
definition
Funds
TOTAL QUALITY MANAGEMENT PRESENTATION BY RAVI SAXENA

TOTAL QUALITY MANAGEMENT PRESENTATION BY RAVI SAXENA

  • 4.
    0 5 10 Goodnessof the product Badnessof product Asthegoodnessof the productincreases, the quality of theproduct increases. Asthebadnessof the product increases, the quality of theproduct decreases. Sinceit issaid that theamount of ‘Goodness’ or ‘Badness’ present in a product isknown to beasits Quality.
  • 10.
    THERE ARE SEVENPILLARS OF TPM
  • 11.
  • 23.
    Involvement of allpeople in support functions for focusing on better plant performance Better utilized work area Reduce repetitive work Reduced inventory levels in all parts of the supply chain Reduced administrative costs Reduced inventory carrying cost Reduction in number of files Reduction of overhead costs (to include cost of non-production/non capital equipment) Productivity of people in support functions Reduction in breakdown of office equipment Reduction of customer complaints due to logistics Reduction in expenses due to emergency dispatches/purchases Reduced manpower Clean and pleasant work
  • 24.
    Target : 1) Zeroaccident 2) Zero health damage 3) Zero fires In this area focus is on to create a safe workplace and a surrounding area that is not damaged by our process or procedures. This pillar will play an active role in each of the other pillars on a regular basis.
  • 26.
    Total Quality Managementis defined as a continuous effort by the management as well as employees of a particular organization to ensure long term customer loyalty and customer satisfaction. Why would a customer come to you if your competitor is also offering the same product? The difference has to be there in quality. Your brand needs to be superior for it to stand apart from the rest
  • 28.
    Planning is themost crucial phase of total quality management. In this phase employees have to come up with their problems and queries which need to be addressed. They need to come up with the various challenges they face in their day to day operations and also analyze the problem’s root cause. Employees are required to do necessary research and collect relevant data which would help them find solutions to all the problems.
  • 29.
    In the doingphase, employees develop a solution for the problems defined in planning phase. Strategies are devised and implemented to overcome the challenges faced by employees. The effectiveness of solutions and strategies is also measured in this stage.
  • 30.
    Checking phase is thestage where people actually do a comparison analysis of before and after data to confirm the effectiveness of the processes and measure the results.
  • 31.
    In this phase employees documenttheir results and prepare themselves to address other problems.
  • 32.
    “Quality management” ensures superiorquality products and services. Quality management is essential for customer satisfaction which eventually leads to customer loyalty. Quality management tools help an organization to design and create a product which the customer actually wants and desires. Quality Management ensures increased revenues and higher productivity for the organization. Quality management helps organizations to reduce waste and inventory.
  • 34.
  • 37.
    Cause and EffectDiagrams (Fishbone or Ishikawa Diagrams): ‘Cause and Effect Diagrams’ are used to find the root cause of a defect. They help to stimulate thinking and organization of thoughts. They can be used in quality planning, as well as quality control. Excessive downtime MeasurementMaterials MachinesPeople No PM program Old equipment Product out of specification Poor training Don’t care attitude Don’t track uptime Poor downtime definition Funds