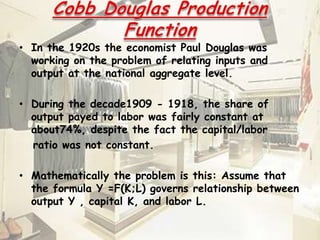
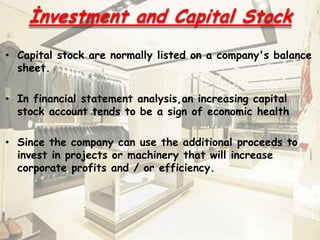
• Cobb Douglas Production Function

  •   Elasticity of Labor and Capital

  •   Methodology to Calculate Elasticity

  •   İnvestment and Capital Stock
• In the 1920s the economist Paul Douglas was
  working on the problem of relating inputs and
  output at the national aggregate level.

• During the decade1909 - 1918, the share of
  output payed to labor was fairly constant at
  about74%, despite the fact the capital/labor
  ratio was not constant.

• Mathematically the problem is this: Assume that
  the formula Y =F(K;L) governs relationship between
  output Y , capital K, and labor L.
•   In its most standard form for production of a single
    good with two factors, the function is where:

                  Q=        AKα Lß
• Q =      total production (the monetary value of all goods
    produced in a year)

• L = labor input
• K = capital input
• A = total factor productivity

 α and β are the output elasticities of labor and
  capital, respectively.
Elasticity of
                    Labor and Capital
This Quantity Measures:
•    the extent to which firms can substitute capital for labor as the
     relative productivity
OR
•    the relative cost of the two factors changes.


When this number is large, it means that firms can easily substitute
between capital and labor.


In general, the elasticity of substitution depends on the
Amount Of Capital And Labor Employed.
Methodology to Calculate
            Elasticity

• Total outlay or Expenditure Method

• Proportionate or Percentage Method

• Point Elastic Method

• Arc Elasticity of Method

•   Revenue Method
İnvestment and Capital Stock
• Capital stock are normally listed on a company's balance
  sheet.

• In financial statement analysis,an increasing capital
  stock account tends to be a sign of economic health

• Since the company can use the additional proceeds to
  invest in projects or machinery that will increase
  corporate profits and / or efficiency.
This Correlation İndicate Us With The Line, Capital Stock And
Value Added Average Values. And The Points Are Actual Values.
Dependent Variable: VA
Method: LeastSquares
Date: 10/27/11 Time: 10:44
Sample: 1973 2000
Includedobservations: 28


                             Coefficient                Std. Error                          t-Statistic           Prob.


C                                          -125147.1                           16945.98              -7.385.060             0.0000
EMP                                        -0.008122                           0.023321               -0.348252             0.7306
CS                                          0.271526                           0.039113               6.942.135             0.0000


R-squared                                   0.940860                 Meandependent var                                    16125.43
Adjusted R-squared                          0.936129                  S.D. dependent var                                  7.776.565
S.E. of regression                         1.965.354                  Akaikeinfocriterion                                 1.810.569
Sumsquaredresid                            96565449                     Schwarzcriterion                                  1.824.843
Loglikelihood                              -2.504.797                Hannan-Quinncriter.                                  1.814.933
F-statistic                                1.988.624                 Durbin-Watson stat                                   1.535.835
Prob(F-statistic)                           0.000000

    If The R- Square İs Near To 1 That Is Mean We Can Trust This Equation.
    We İnvest On The Capital Stock.

Total factor productivity growth

  • 1.
    • Cobb DouglasProduction Function • Elasticity of Labor and Capital • Methodology to Calculate Elasticity • İnvestment and Capital Stock
  • 2.
    • In the1920s the economist Paul Douglas was working on the problem of relating inputs and output at the national aggregate level. • During the decade1909 - 1918, the share of output payed to labor was fairly constant at about74%, despite the fact the capital/labor ratio was not constant. • Mathematically the problem is this: Assume that the formula Y =F(K;L) governs relationship between output Y , capital K, and labor L.
  • 3.
    In its most standard form for production of a single good with two factors, the function is where: Q= AKα Lß • Q = total production (the monetary value of all goods produced in a year) • L = labor input • K = capital input • A = total factor productivity  α and β are the output elasticities of labor and capital, respectively.
  • 4.
    Elasticity of Labor and Capital This Quantity Measures: • the extent to which firms can substitute capital for labor as the relative productivity OR • the relative cost of the two factors changes. When this number is large, it means that firms can easily substitute between capital and labor. In general, the elasticity of substitution depends on the Amount Of Capital And Labor Employed.
  • 5.
    Methodology to Calculate Elasticity • Total outlay or Expenditure Method • Proportionate or Percentage Method • Point Elastic Method • Arc Elasticity of Method • Revenue Method
  • 6.
    İnvestment and CapitalStock • Capital stock are normally listed on a company's balance sheet. • In financial statement analysis,an increasing capital stock account tends to be a sign of economic health • Since the company can use the additional proceeds to invest in projects or machinery that will increase corporate profits and / or efficiency.
  • 7.
    This Correlation İndicateUs With The Line, Capital Stock And Value Added Average Values. And The Points Are Actual Values.
  • 8.
    Dependent Variable: VA Method:LeastSquares Date: 10/27/11 Time: 10:44 Sample: 1973 2000 Includedobservations: 28 Coefficient Std. Error t-Statistic Prob. C -125147.1 16945.98 -7.385.060 0.0000 EMP -0.008122 0.023321 -0.348252 0.7306 CS 0.271526 0.039113 6.942.135 0.0000 R-squared 0.940860 Meandependent var 16125.43 Adjusted R-squared 0.936129 S.D. dependent var 7.776.565 S.E. of regression 1.965.354 Akaikeinfocriterion 1.810.569 Sumsquaredresid 96565449 Schwarzcriterion 1.824.843 Loglikelihood -2.504.797 Hannan-Quinncriter. 1.814.933 F-statistic 1.988.624 Durbin-Watson stat 1.535.835 Prob(F-statistic) 0.000000 If The R- Square İs Near To 1 That Is Mean We Can Trust This Equation. We İnvest On The Capital Stock.