Download to read offline
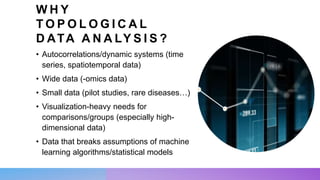


The document discusses topological data analysis (TDA) and its applications for various data types, including time series, -omics data, and small datasets. It highlights tools and methodologies such as persistent homology, clustering, and curvature analysis to extract meaningful patterns and insights from complex data. Examples include analyzing poems' tone using BERT embeddings and assessing vulnerabilities in a supply chain network.