Download as PDF, PPTX
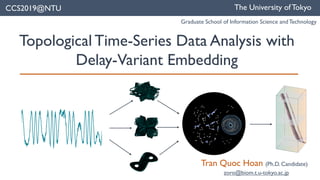
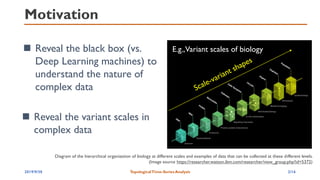


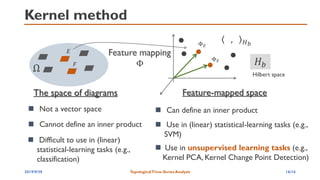


The document discusses topological time-series data analysis using delay-variant embedding, emphasizing the importance of understanding complex data structures through topological features. It introduces concepts such as persistent homology and the significance of holes in high-dimensional spaces, illustrating methods for analyzing time-series data dynamics. The proposed delay-variant embedding method aims to enhance the representation of time-series characteristics in a robust way against noise perturbations.