Download to read offline


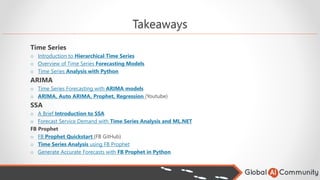


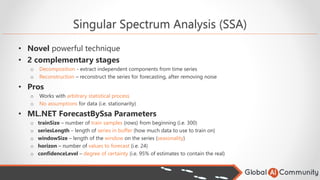
![Common Data Preparation
• Imputation
o Replacing missing data with substitute values
• Frequency / Resampling
o Could be too high for a model compared to prediction front
o Irregular time series may require resampling at regular intervals
• Outliers
o Extreme values need to be identified and handled
o Outlier = Value ∉ [Q1-1.5*IQR; Q3+1.5*IQR]
Does missing data have
meaning?
NO
Type of data
Large dataset, little
data missing at
random:
Remove instances with
"missing "? data
Does data follow simple
distribution?
NO
Impute with simple ML
model
YES
Impute with mean value
YES, with outliers
Impute missing values
with median
Large, temporary
ordered dataset:
Replace data with
preceding values
YES: Numerical
Convert missing values
to meaningful number](https://image.slidesharecdn.com/forecastingtimeseries-powerfulandsimple-220121050842/85/Forecasting-time-series-powerful-and-simple-19-320.jpg)


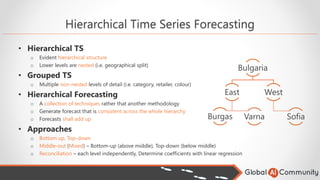
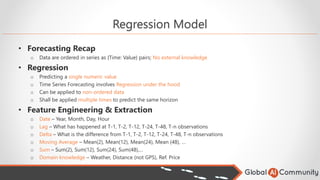
![AutoARIMA
• Identifies the most optimal parameters of ARIMA (p, d, q)
o pip install pyramid-arima (mimics R auto.arima)
o .fit() does a magic
o Utilizes AIC (Akaike Information Criterion) to pick best model (smaller = better)
• N*ln(SSe/N)+2K – N (N- number of observations, SSe - SumSquareErrors, K – model parameters)
• Conducts differencing tests to determine the order of differencing
• Pros
o Saves time
o One of the simplest techniques for TS forecasting
o Eliminates the need of in-depth statistics understanding
o Reduces the chance of human error due to misinterpretation
model = auto_arima(train, [42 other optional arguments])
model.fit(train)](https://image.slidesharecdn.com/forecastingtimeseries-powerfulandsimple-220121050842/85/Forecasting-time-series-powerful-and-simple-24-320.jpg)
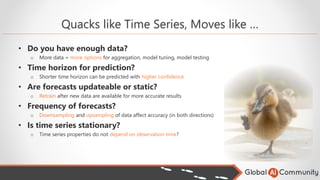
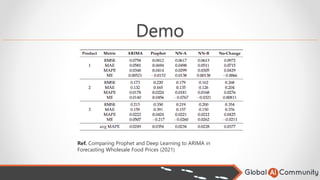
![SSA, How it Works
• How does it work
• Checkpoint
o Avoids replay of all previous data, provide only most recent observations
o But if this creates a drift, a clean retrain on last observations (i.e. 1 month) may be better
MLContext mlContext = new MLContext(); //All ML.NET operations are within context
IDataView dv = mlContext.Data.LoadFromTextFile(…) //Step 1: Load data from file
var pipeline = mlContext.Forecasting.ForecastBySsa([Parameters],…) //Step 2: SSA Pipeline
SsaForecastingTransformer forecaster = pipeline.Fit(dv); //Step 3: Data training
… //Step 4: Evaluate (i.e. calculate RMSE)
var forecastEngine = forecaster.CreateTimeSeriesEngine(mlContext);
ModelOutput forecast = forecastEngine.Predict(); //Step 5: Load trained model and predict
forecastEngine.CheckPoint(mlContext, outputModelPath); //Save Checkpoint
model = mlContext.Model.Load(file, out DataViewSchema schema); //Load from Checkpoint
forecastEngine = model.CreateTimeSeriesEngine<TimeSeriesData, ChangePointPrediction>(mlContext);](https://image.slidesharecdn.com/forecastingtimeseries-powerfulandsimple-220121050842/85/Forecasting-time-series-powerful-and-simple-26-320.jpg)


The document outlines details about a Global AI Bootcamp focused on time series forecasting using AI and IoT, featuring a speaker with extensive experience. It covers various aspects of time series analysis, forecasting techniques, and key modeling algorithms including ARIMA and FB Prophet, emphasizing the importance of data preparation and model selection. The text also provides practical use cases and highlights upcoming events related to Azure and machine learning.