Download as PDF, PPTX

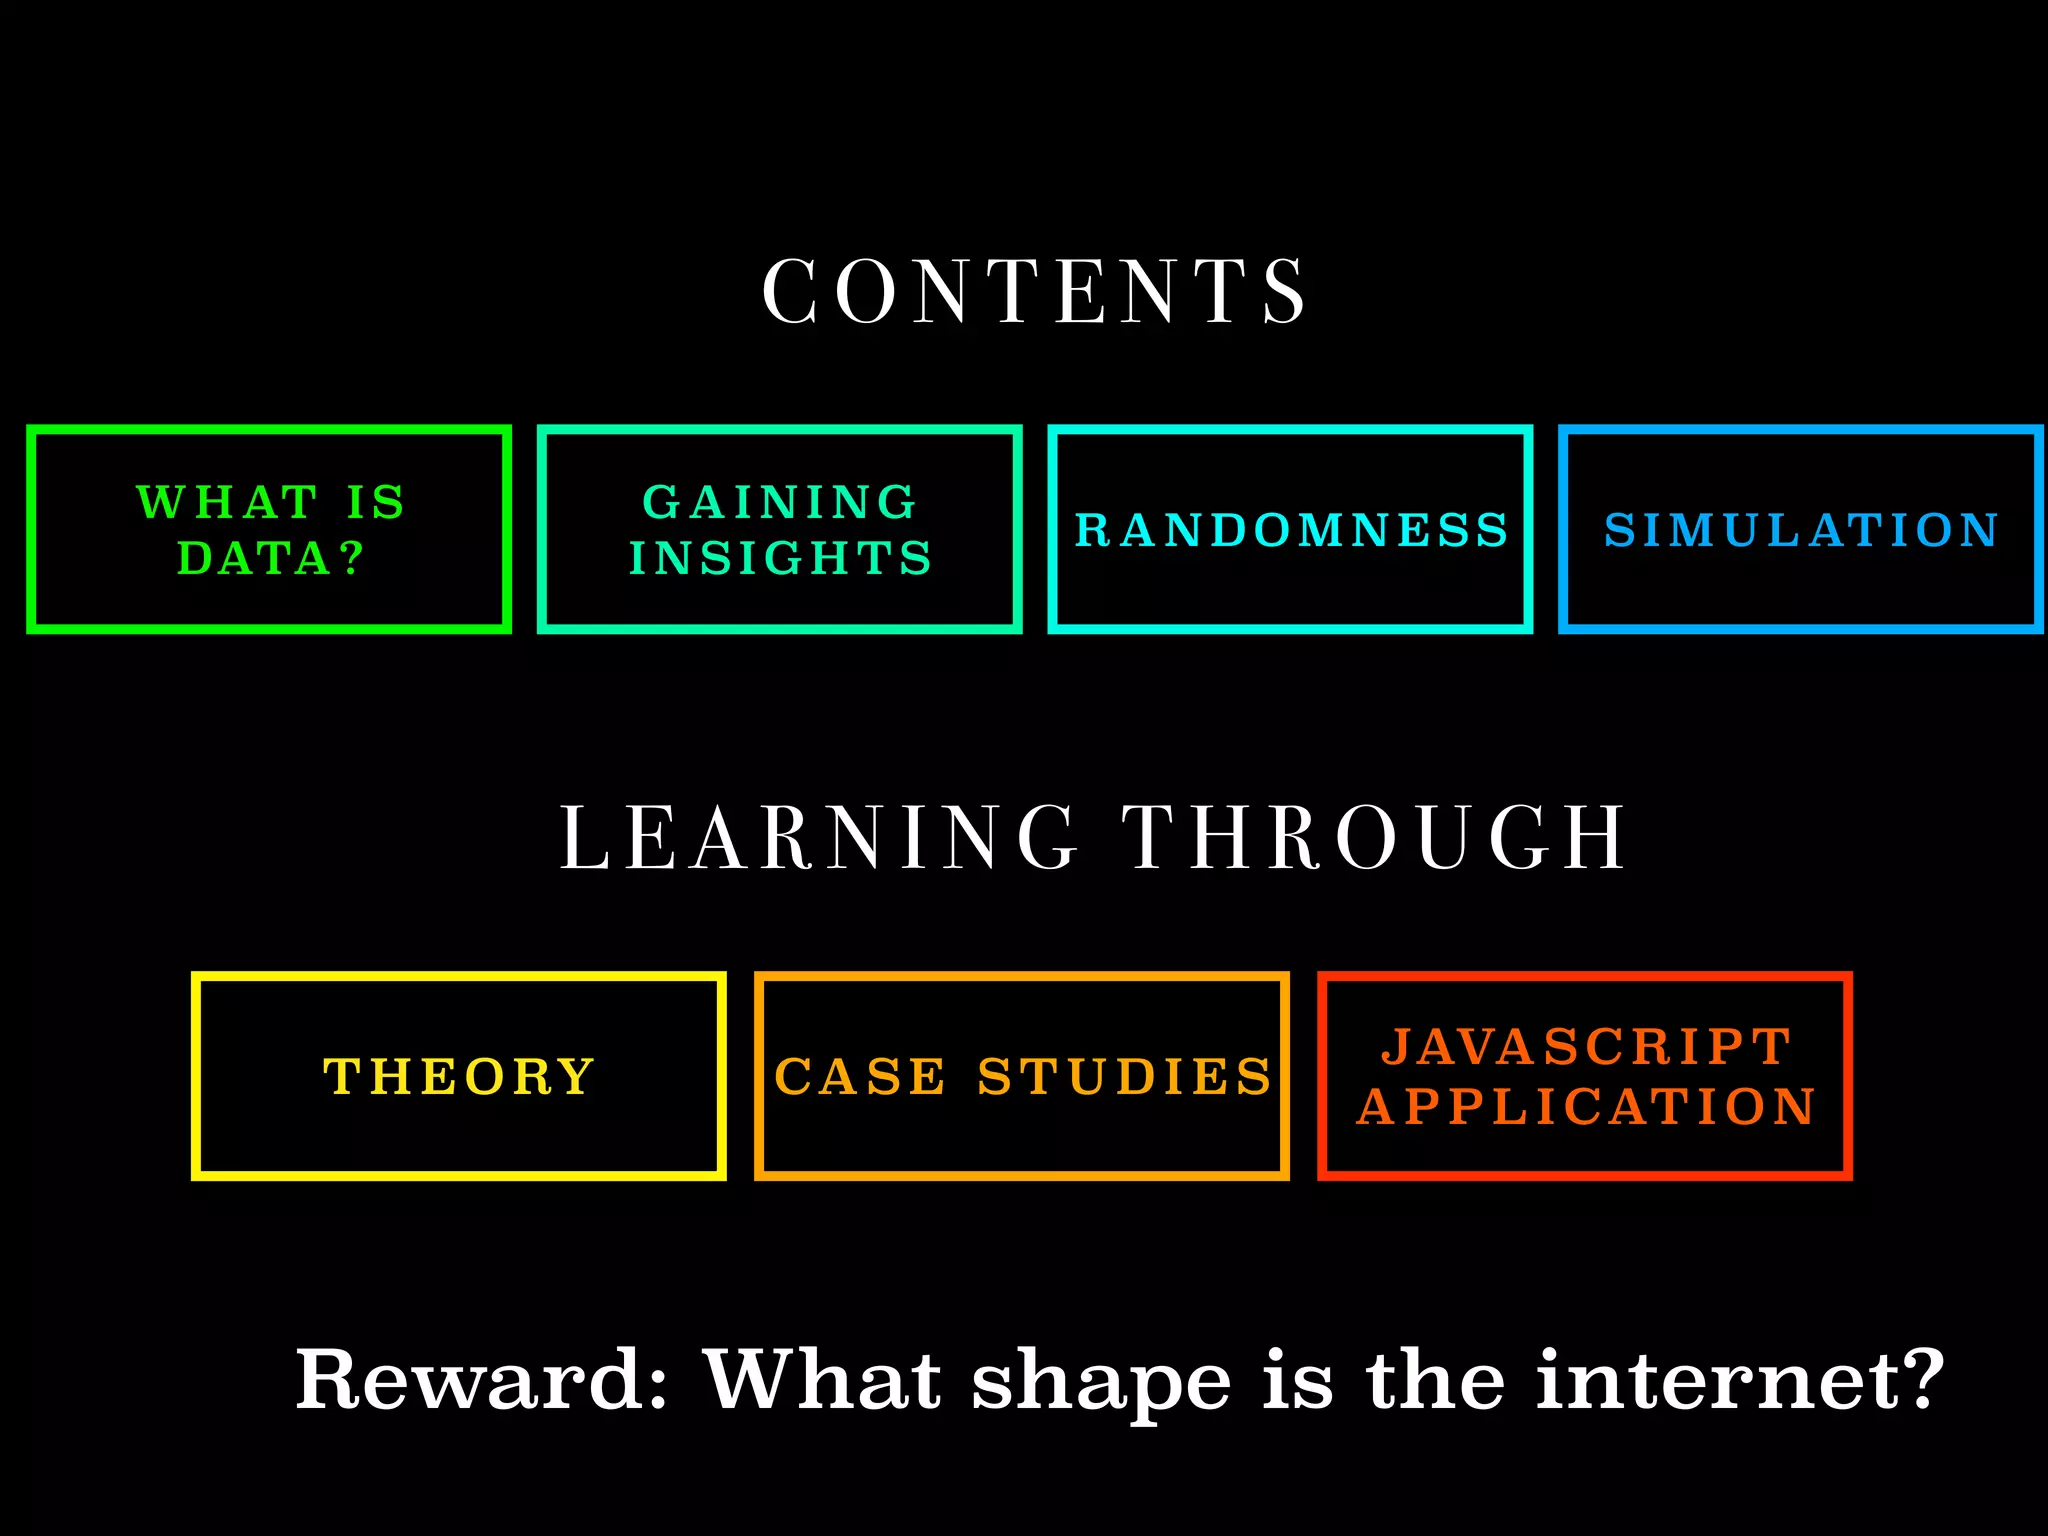
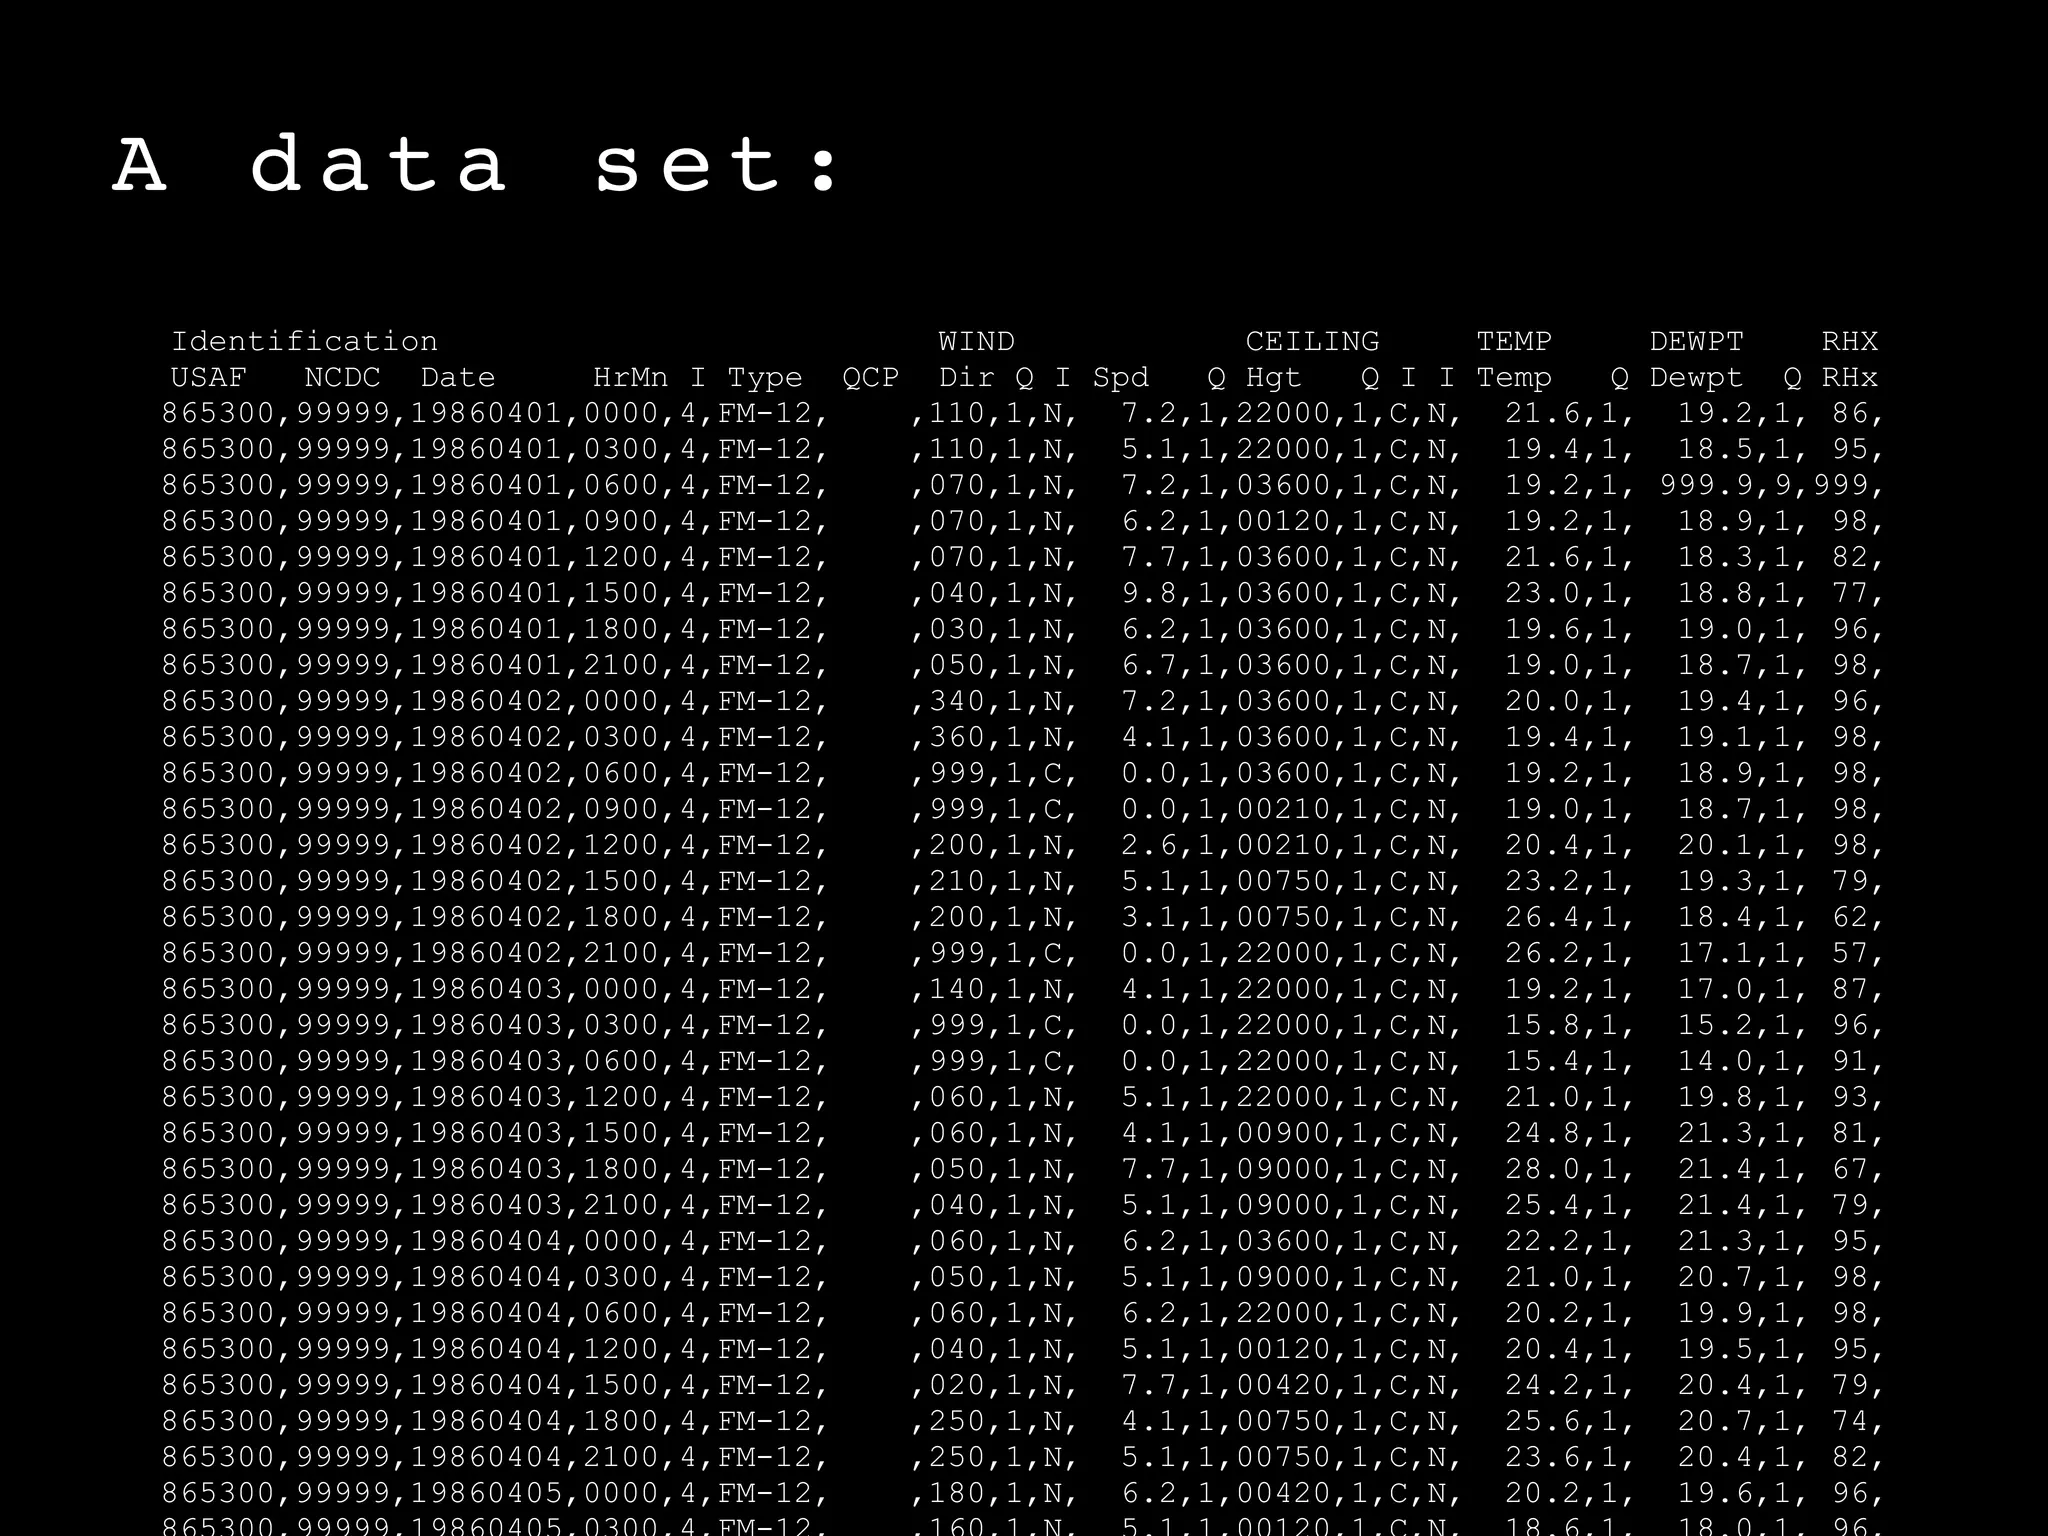


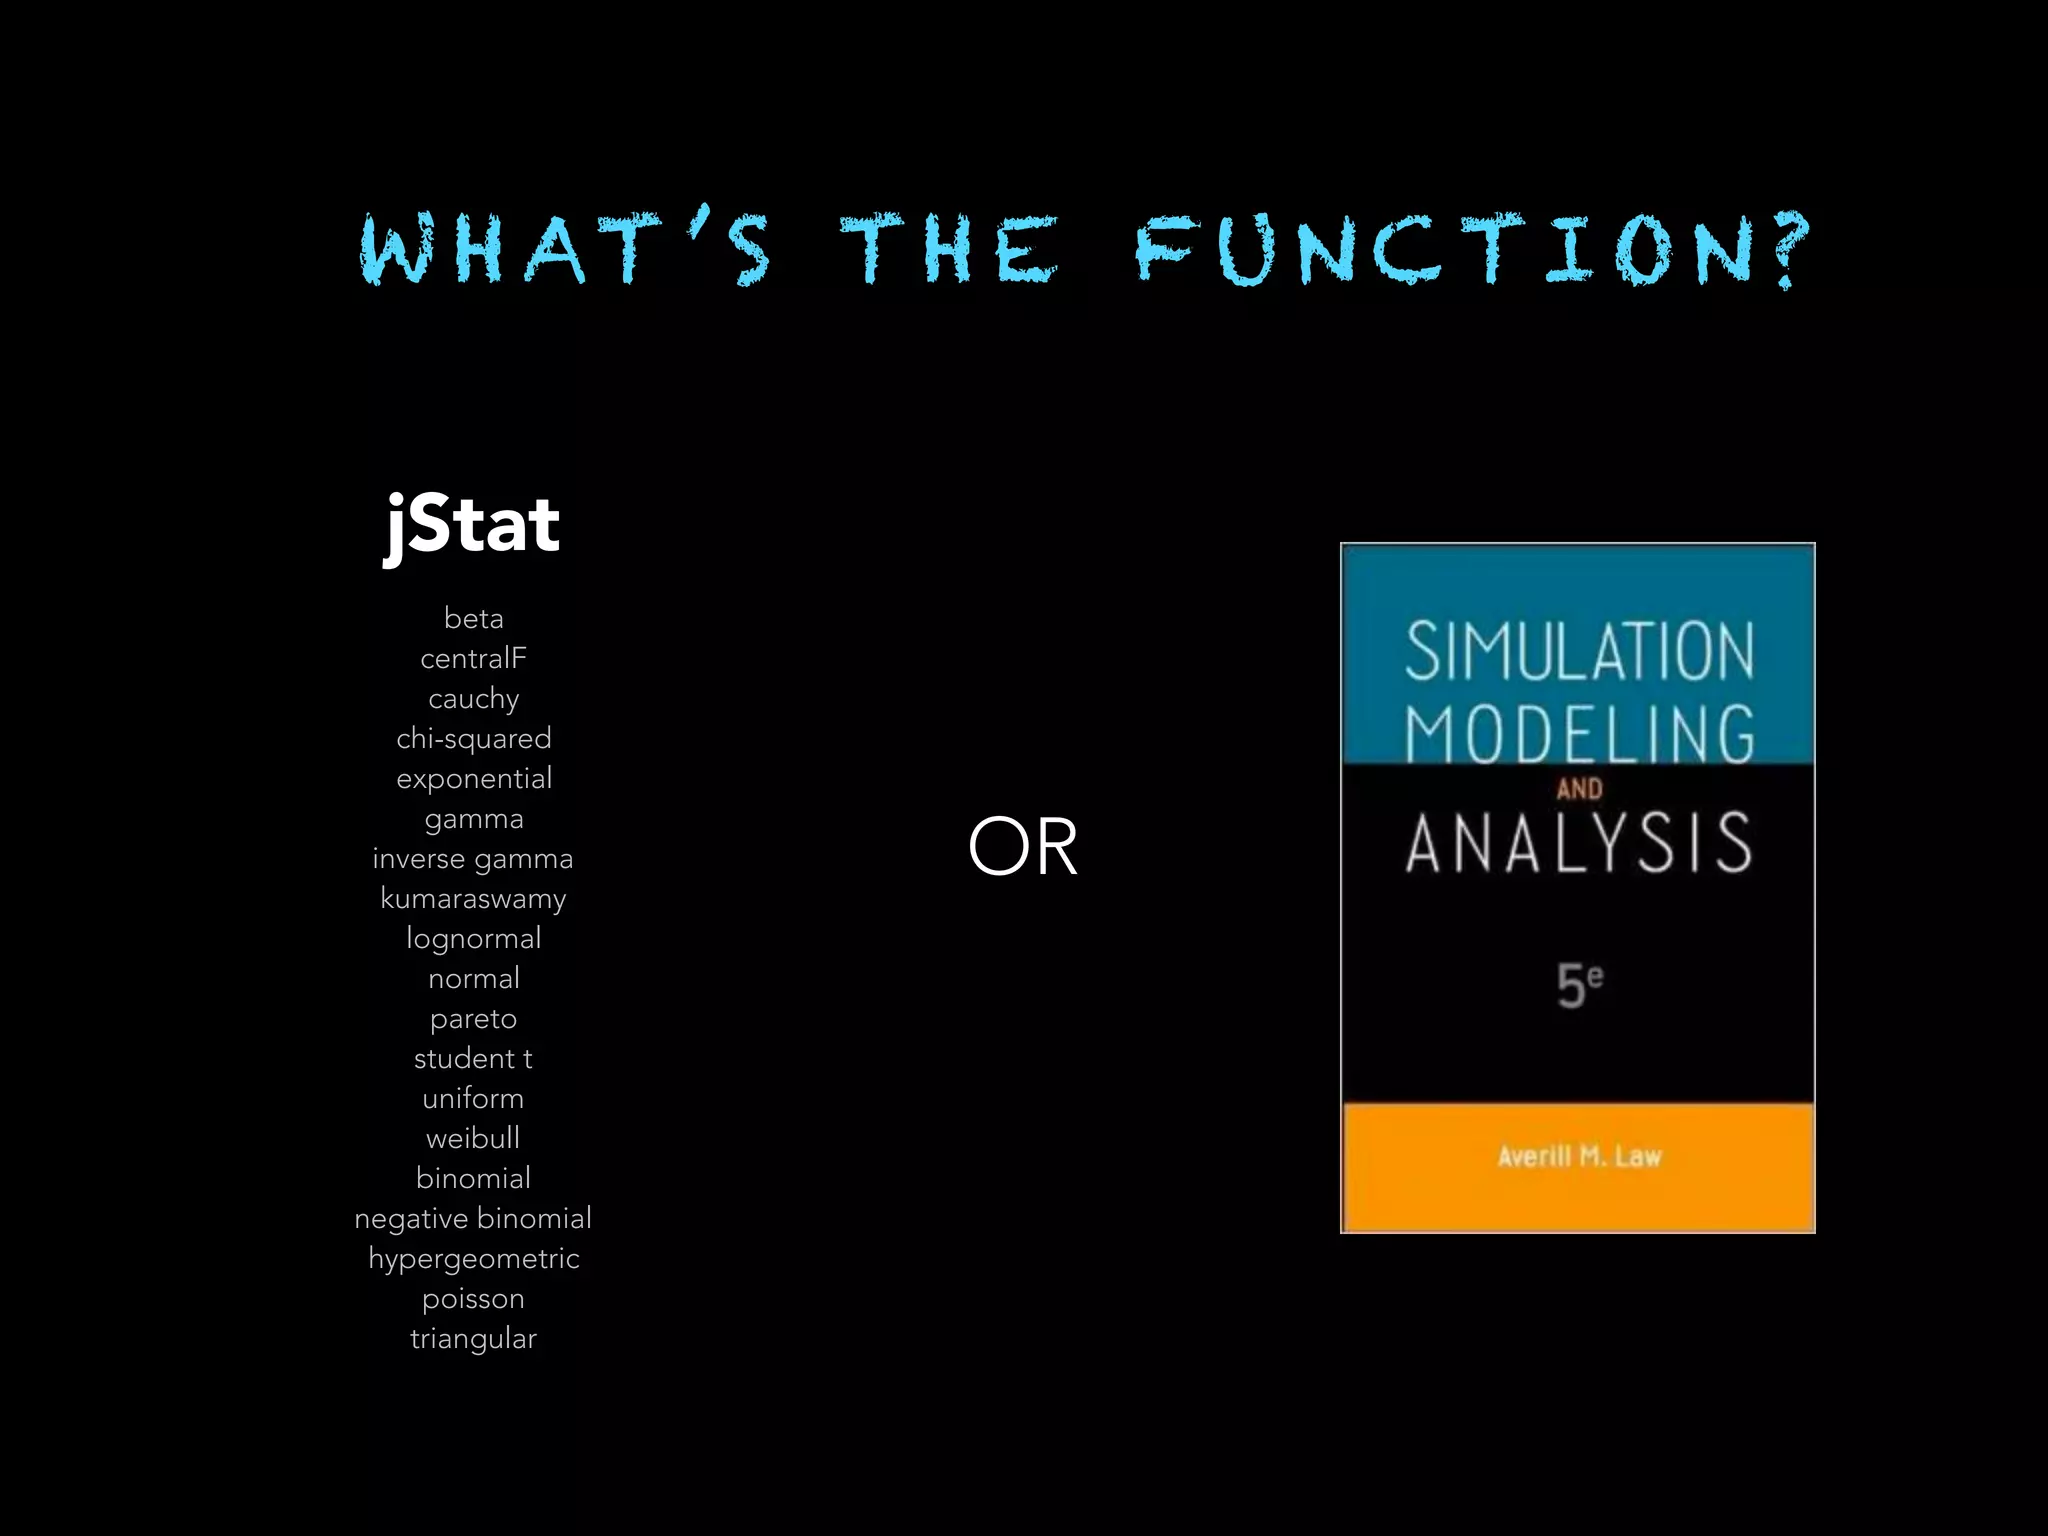


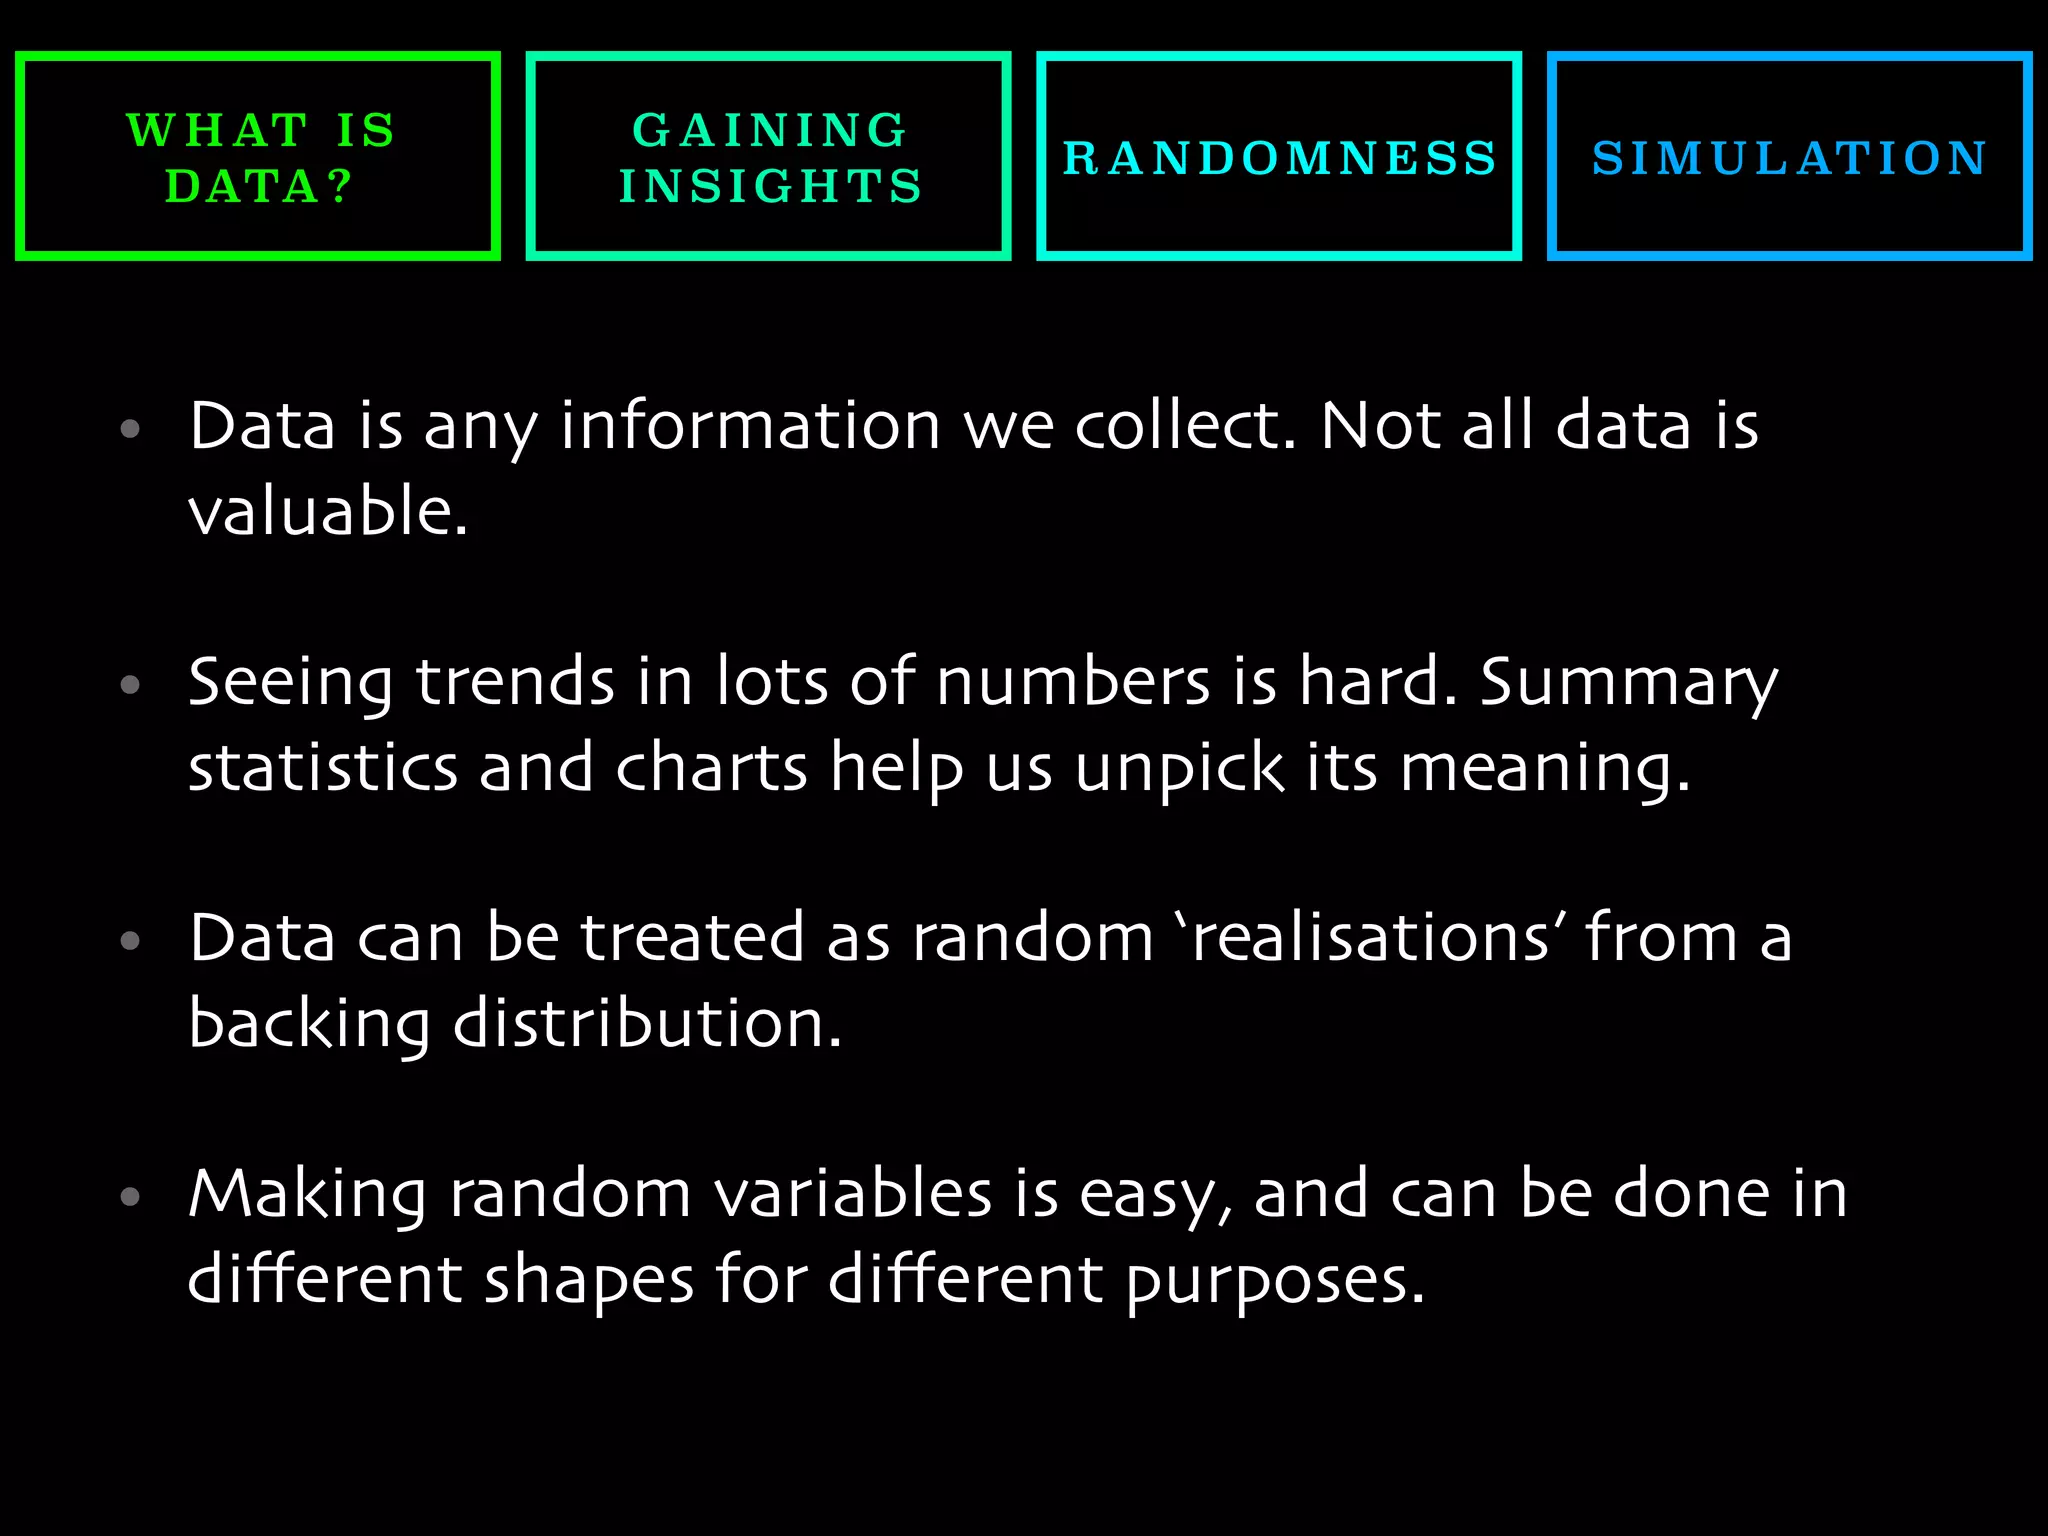


The document discusses statistical programming in JavaScript and introduces the concepts of data, insights, and random variables. It highlights the importance of understanding different types of data and various statistical measures, as well as the implications of randomness in programming and data analysis. The content includes practical applications, such as data collection methods and simulations, aimed at improving data interpretation and decision-making.


![Big Data [sorry] & Data Science: What Does a Data Scientist Do?](https://cdn.slidesharecdn.com/ss_thumbnails/dslatcloudmsevent20130125-130126065651-phpapp01-thumbnail.jpg?width=640&height=640&fit=bounds)