Downloaded 674 times


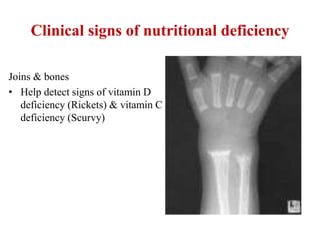
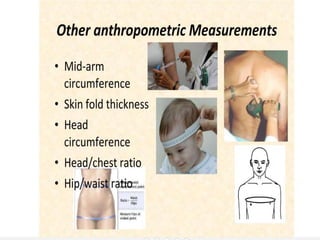


This document discusses nutritional surveys and their evaluation. It begins by defining nutrition and nutritional surveys. Nutritional surveys are important for identifying at-risk groups, developing health programs, and measuring program effectiveness. The document then discusses methods of assessing nutritional status, including anthropometric measurements, biochemical tests, clinical exams, and dietary evaluations. It provides examples of nutritional surveys and indicators used in different countries and in India, where undernutrition and new lifestyle-related diseases are both problems. Major nutritional programs in India are also mentioned.