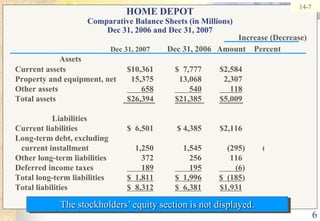
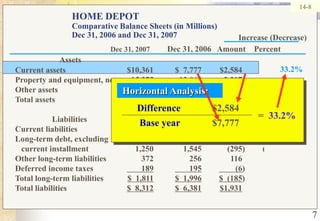
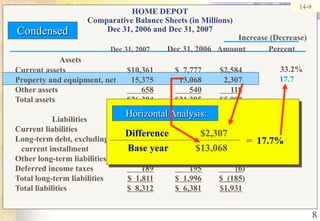
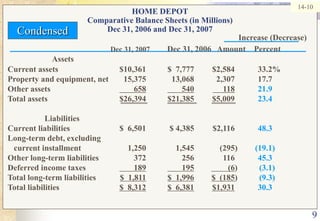
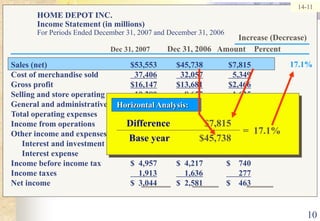
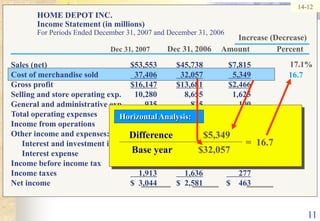
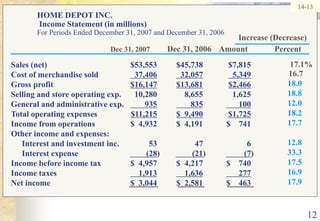
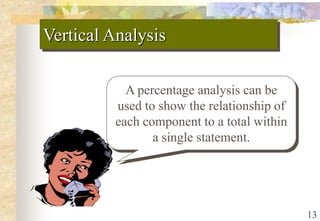
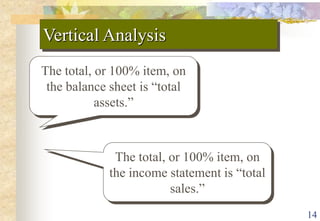
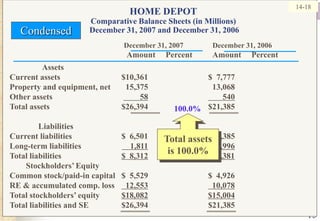
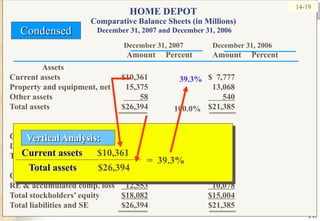
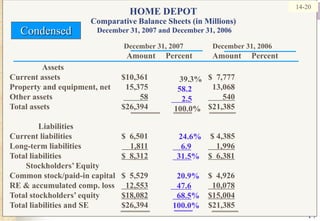
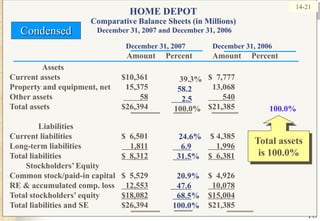
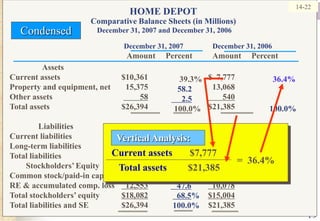
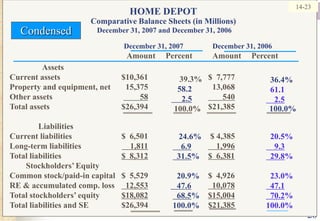
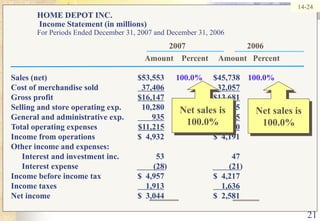
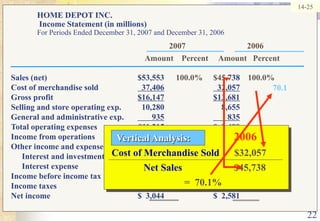
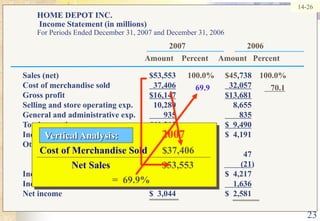
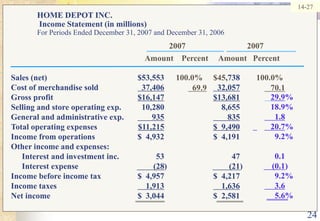
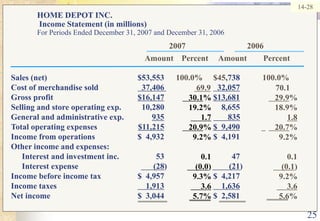
SlideShare a Scribd company logo
1 TOPIC 10: FINANCIAL STATEMENT ANALYSIS
2 Introduction Interpretation is when users evaluate financial information to make judgements It is the key to any in-depth understanding of an organisationā€™s performance. Basically, the users evaluate an organisationā€™s performance and financial position using the information from INCOME STATEMENT and BALANCE SHEET. The value of the analysis is depends on the value of the financial statements.
3 Techniques (types) of analysis: 1.HorizontalAnalysis  Comparing key figures in financial statement Evaluates a series of financial statement over a period of time. 2.	Vertical Analysis Evaluates financial statement by expressing each item in a financial statement as a percent of the base amount (key figure) Key-figure (such as sales in IS and total assets on BS) are set to 100% Other items are then expressed as percentage of 100
4 Techniques (types) of analysis: (cont.) 3. 	Trend analysis Similar to horizontal analysis, except that the first set of account in the series is given  a base of 100 4.	Ratio Analysis It expresses the relationship among selected items of financial statement data.
5 Horizontal Analysis Itā€™s an analysis of the percentage increases and decreases of related items in comparative financial statements. What is horizontal analysis?
6 14-7 HOME DEPOTComparative Balance Sheets (in Millions)Dec 31, 2006 and Dec 31, 2007  Increase (Decrease) Dec 31, 2007Dec 31, 2006   Amount	 Percent Assets		 Current assets	$10,361	$  7,777	$2,584 	33.2% Property and equipment, net	15,375	13,068	2,307	17.7 Other assets	658       540     118	21.9 Total assets	$26,394	$21,385	$5,009  	23.4                   Liabilities Current liabilities	$  6,501	$ 4,385	$2,116  	48.3 Long-term debt, excluding    current installment	1,250	1,545	(295)	(19.1) Other long-term liabilities 	372	256	116	45.3 Deferred income taxes	       189       195        (6)	(3.1) Total long-term liabilities	$  1,811$  1,996$  (185)	(9.3) Total liabilities	$  8,312$  6,381$1,931	30.3 The stockholdersā€™ equity section is not displayed.
7 Horizontal Analysis:  Difference	$2,584       Base year	$7,777 =  33.2% 14-8 HOME DEPOTComparative Balance Sheets (in Millions)Dec 31, 2006 and Dec 31, 2007  Increase (Decrease) Dec 31, 2007Dec 31, 2006   Amount	 Percent Assets		 Current assets	$10,361	$  7,777	$2,584 	33.2% Property and equipment, net	15,375	13,068	2,307	17.7 Other assets	658       540     118	21.9 Total assets	$26,394	$21,385	$5,009  	23.4                   Liabilities Current liabilities	$  6,501	$ 4,385	$2,116  	48.3 Long-term debt, excluding    current installment	1,250	1,545	(295)	(19.1) Other long-term liabilities 	372	256	116	45.3 Deferred income taxes	       189       195        (6)	(3.1) Total long-term liabilities	$  1,811$  1,996$  (185)	(9.3) Total liabilities	$  8,312$  6,381$1,931	30.3 33.2%
8 Horizontal Analysis:  Difference	$2,307       Base year	$13,068 =  17.7% 14-9 HOME DEPOTComparative Balance Sheets (in Millions)Dec 31, 2006 and Dec 31, 2007 Condensed Increase (Decrease) Dec 31, 2007Dec 31, 2006   Amount	        Percent Assets		 Current assets	$10,361	$  7,777	$2,584 	33.2% Property and equipment, net	15,375	13,068	2,307	17.7 Other assets	658       540     118	21.9 Total assets	$26,394	$21,385	$5,009  	23.4                   Liabilities Current liabilities	$  6,501	$ 4,385	$2,116  	48.3 Long-term debt, excluding    current installment	1,250	1,545	(295)	(19.1) Other long-term liabilities 	372	256	116	45.3 Deferred income taxes	       189       195        (6)	(3.1) Total long-term liabilities	$  1,811$  1,996$  (185)	(9.3) Total liabilities	$  8,312$  6,381$1,931	30.3 33.2% 33.2% 17.7
9 14-10 HOME DEPOTComparative Balance Sheets (in Millions)Dec 31, 2006 and Dec 31, 2007 Condensed Increase (Decrease) Dec 31, 2007Dec 31, 2006   Amount	 Percent Assets		 Current assets	$10,361	$  7,777	$2,584 	33.2% Property and equipment, net	15,375	13,068	2,307	17.7 Other assets	658       540     11821.9 Total assets	$26,394	$21,385	$5,009  	23.4                   Liabilities Current liabilities	$  6,501	$ 4,385	$2,116  	48.3 Long-term debt, excluding    current installment	1,250	1,545	(295)	(19.1) Other long-term liabilities 	372	256	116	45.3 Deferred income taxes	       189       195        (6)	(3.1) Total long-term liabilities	$  1,811$  1,996$  (185)	(9.3) Total liabilities	$  8,312$  6,381$1,93130.3
10 Horizontal Analysis:  Difference	$7,815      Base year  	$45,738 =  17.1% 14-11 HOME DEPOT INC. Income Statement (in millions)For Periods Ended December 31, 2007 and December 31, 2006 Increase (Decrease) Dec 31, 2007Dec 31, 2006   Amount	 Percent 17.1% Sales (net)	$53,553	$45,738	$7,815 Cost of merchandise sold	  37,406  32,057  5,349 Gross profit	 $16,147$13,681$2,466 Selling and store operating exp.	10,280	8,655	1,625 General and administrative exp.	       935       835      100 Total operating expenses	$11,215$  9,490$1,725 Income from operations	$  4,932	$  4,191	$    741	 Other income and expenses: 	Interest and investment inc.	53	47	6	  	Interest expense	        (28)	        (21)	         (7)	 Income before income tax	$  4,957	$  4,217	$    740 	 Income taxes	    1,913    1,636      277 Net income	$  3,044	$  2,581	$    463
11 Horizontal Analysis:  Difference	$5,349      Base year  	$32,057 =  16.7 14-12 HOME DEPOT INC. Income Statement (in millions)For Periods Ended December 31, 2007 and December 31, 2006 Increase (Decrease) Dec 31, 2007Dec 31, 2006     Amount	            Percent 17.1% Sales (net)	$53,553	$45,738	$7,815 Cost of merchandise sold	  37,406  32,057  5,349 Gross profit	 $16,147$13,681$2,466 Selling and store operating exp.	10,280	8,655	1,625 General and administrative exp.	       935       835      100 Total operating expenses	$11,215$  9,490$1,725 Income from operations	$  4,932	$  4,191	$    741	 Other income and expenses: 	Interest and investment inc.	53	47	6	  	Interest expense	        (28)	        (21)	         (7)	 Income before income tax	$  4,957	$  4,217	$    740 	 Income taxes	    1,913    1,636      277 Net income	$  3,044	$  2,581	$    463 	 16.7
12 17.1% 16.7  14-13 HOME DEPOT INC.  Income Statement (in millions)For Periods Ended December 31, 2007 and December 31, 2006 Increase (Decrease) Dec 31, 2007Dec 31, 2006    Amount	           Percent Sales (net)	$53,553	$45,738	$7,815 Cost of merchandise sold	  37,406  32,057  5,349 Gross profit	 $16,147$13,681$2,466 Selling and store operating exp.	10,280	8,655	1,625 General and administrative exp.	       935       835      100 Total operating expenses	$11,215$  9,490$1,725 Income from operations	$  4,932	$  4,191	$    741	 Other income and expenses: 	Interest and investment inc.	53	47	6	  	Interest expense	        (28)	        (21)	         (7)	 Income before income tax	$  4,957	$  4,217	$    740 	 Income taxes	    1,913    1,636      277 Net income	$  3,044	$  2,581	$    463 	 18.0 18.8 12.0 18.2 17.7 12.8 33.3 17.5 16.9 17.9
13 Vertical Analysis A percentage analysis can be used to show the relationship of each component to a total within a single statement.
14 Vertical Analysis The total, or 100% item, on the balance sheet is ā€œtotal assets.ā€ The total, or 100% item, on the income statement is ā€œtotal sales.ā€
15 14-18 14-18 HOME DEPOTComparative Balance Sheets (in Millions) December 31, 2007 and December 31, 2006 Condensed December 31, 2007 	December 31, 2006                 Amount     Percent          Amount     Percent Assets		 Current assets	$10,361		$  7,777	 Property and equipment, net	15,375		13,068	 Other assets	58       540 Total assets	$26,394		$21,385               Liabilities Current liabilities	$  6,501		$ 4,385	 Long-term liabilities	    1,811    1,996 Total liabilities	$  8,312$  6,381         Stockholdersā€™ Equity Common stock/paid-in capital	$  5,529		$  4,926 RE & accumulated comp. loss	  12,553  10,078 Total stockholdersā€™ equity	$18,082$15,004 Total liabilities and SE	$26,394		$21,385	 100.0% Total assets is 100.0%
16 Vertical Analysis:  Current assets      $10,361    Total assets	       $26,394 =  39.3% 14-19 HOME DEPOTComparative Balance Sheets (in Millions)December 31, 2007 and December 31, 2006 Condensed December 31, 2007 	December 31, 2006                 Amount     Percent          Amount     Percent Assets		 Current assets	$10,361		$  7,777	 Property and equipment, net	15,375		13,068	 Other assets	58       540 Total assets	$26,394		$21,385               Liabilities Current liabilities	$  6,501		$ 4,385	 Long-term liabilities	    1,811    1,996 Total liabilities	$  8,312$  6,381         Stockholdersā€™ Equity Common stock/paid-in capital	$  5,529		$  4,926 RE & accumulated comp. loss	  12,553  10,078 Total stockholdersā€™ equity	$18,082$15,004 Total liabilities and SE	$26,394		$21,385	 39.3% 100.0%
17 14-20 HOME DEPOTComparative Balance Sheets (in Millions)December 31, 2007 and December 31, 2006 Condensed December 31, 2007 	December 31, 2006                 Amount     Percent          Amount     Percent Assets		 Current assets	$10,361		$  7,777	 Property and equipment, net	15,375		13,068	 Other assets	58       540 Total assets	$26,394		$21,385               Liabilities Current liabilities	$  6,501		$ 4,385	 Long-term liabilities	    1,811    1,996 Total liabilities	$  8,312$  6,381         Stockholdersā€™ Equity Common stock/paid-in capital	$  5,529		$  4,926 RE & accumulated comp. loss	  12,553  10,078 Total stockholdersā€™ equity	$18,082$15,004 Total liabilities and SE	$26,394		$21,385	 39.3% 58.2      2.5 100.0% 24.6%     6.9   31.5% 	20.9%    47.6   68.5% 	100.0%
18 39.3% 58.2      2.5 100.0% 24.6%     6.9   31.5% 	20.9%    47.6   68.5% 	100.0%	 14-21 HOME DEPOTComparative Balance Sheets (in Millions)December 31, 2007 and December 31, 2006 Condensed December 31, 2007  	December 31, 2006                 Amount     Percent          Amount     Percent Assets		 Current assets	$10,361		$  7,777	 Property and equipment, net	15,375		13,068	 Other assets	58       540 Total assets	$26,394		$21,385               Liabilities Current liabilities	$  6,501		$ 4,385	 Long-term liabilities	    1,811    1,996 Total liabilities	$  8,312$  6,381         Stockholdersā€™ Equity Common stock/paid-in capital	$  5,529		$  4,926 RE & accumulated comp. loss	  12,553  10,078 Total stockholdersā€™ equity	$18,082$15,004 Total liabilities and SE	$26,394		$21,385	 100.0% Total assets is 100.0%
19 39.3% 58.2      2.5 100.0% 24.6%     6.9   31.5% 	20.9%    47.6   68.5% 	100.0%	 Vertical Analysis:  Current assets       $7,777    Total assets	       $21,385 =  36.4% 14-22 HOME DEPOTComparative Balance Sheets (in Millions)December 31, 2007 and December 31, 2006 Condensed December 31, 2007 	December 31, 2006                 Amount     Percent          Amount     Percent Assets		 Current assets	$10,361		$  7,777	 Property and equipment, net	15,375		13,068	 Other assets	58       540 Total assets	$26,394		$21,385               Liabilities Current liabilities	$  6,501		$ 4,385	 Long-term liabilities	    1,811    1,996 Total liabilities	$  8,312$  6,381         Stockholdersā€™ Equity Common stock/paid-in capital	$  5,529		$  4,926 RE & accumulated comp. loss	  12,553  10,078 Total stockholdersā€™ equity	$18,082$15,004 Total liabilities and SE	$26,394		$21,385	 36.4% 100.0%
20 39.3% 58.2      2.5 100.0% 24.6%     6.9   31.5% 	20.9%    47.6   68.5% 	100.0%	 14-23 HOME DEPOTComparative Balance Sheets (in Millions)December 31, 2007 and December 31, 2006 Condensed December 31, 2007 	December 31, 2006                 Amount     Percent          Amount     Percent Assets		 Current assets	$10,361		$  7,777	 Property and equipment, net	15,375		13,068	 Other assets	58       540 Total assets	$26,394		$21,385               Liabilities Current liabilities	$  6,501		$ 4,385	 Long-term liabilities	    1,811    1,996 Total liabilities	$  8,312$  6,381         Stockholdersā€™ Equity Common stock/paid-in capital	$  5,529		$  4,926 RE & accumulated comp. loss	  12,553  10,078 Total stockholdersā€™ equity	$18,082$15,004 Total liabilities and SE	$26,394		$21,385	 36.4% 61.1     2.5 100.0% 20.5%     9.3   29.8% 	23.0%   47.1   70.2% 	100.0%
21 14-24 HOME DEPOT INC.  Income Statement (in millions)For Periods Ended December 31, 2007 and December 31, 2006 2007                              2006 Amount    Percent     Amount   Percent Sales (net)	$53,553	100.0%	$45,738	100.0% Cost of merchandise sold	  37,406  32,057 Gross profit	 $16,147$13,681 Selling and store operating exp.	10,280		8,655	 General and administrative exp.	       935       835 Total operating expenses	$11,215$  9,490 Income from operations	$  4,932		$  4,191		 Other income and expenses: 	Interest and investment inc.	53		47	  	Interest expense	        (28)		        (21) 	 Income before income tax	$  4,957		$  4,217		 Income taxes	    1,913    1,636 Net income	$  3,044		$  2,581		 Net sales is  100.0% Net sales is  100.0%
22 2006 Vertical Analysis:  Cost of Merchandise Sold      $32,057              Net Sales                     $45,738 =  70.1% 14-25 HOME DEPOT INC.  Income Statement (in millions)For Periods Ended December 31, 2007 and December 31, 2006 2007                              2006 Amount    Percent     Amount   Percent Sales (net)	$53,553	100.0%	$45,738	100.0% Cost of merchandise sold	  37,406  32,057 Gross profit	 $16,147$13,681 Selling and store operating exp.	10,280		8,655	 General and administrative exp.	       935       835 Total operating expenses	$11,215$  9,490 Income from operations	$  4,932		$  4,191		 Other income and expenses: 	Interest and investment inc.	53		47	  	Interest expense	        (28)		        (21) 	 Income before income tax	$  4,957		$  4,217		 Income taxes	    1,913    1,636 Net income	$  3,044		$  2,581		 70.1
23 2007 Vertical Analysis:  Cost of Merchandise Sold      $37,406              Net Sales                     $53,553 =  69.9% 14-26 HOME DEPOT INC.  Income Statement (in millions)For Periods Ended December 31, 2007 and December 31, 2006 2007                              2006 Amount    Percent     Amount   Percent Sales (net)	$53,553	100.0%	$45,738	100.0% Cost of merchandise sold	  37,406  32,057 Gross profit	 $16,147$13,681 Selling and store operating exp.	10,280		8,655	 General and administrative exp.	       935       835 Total operating expenses	$11,215$  9,490 Income from operations	$  4,932		$  4,191		 Other income and expenses: 	Interest and investment inc.	53		47	  	Interest expense	        (28)		        (21) 	 Income before income tax	$  4,957		$  4,217		 Income taxes	    1,913    1,636 Net income	$  3,044		$  2,581		 69.9 70.1
24 14-27 HOME DEPOT INC.  Income Statement (in millions)For Periods Ended December 31, 2007 and December 31, 2006 2007                              2007 Amount    Percent     Amount   Percent Sales (net)	$53,553	100.0%	$45,738	        100.0% Cost of merchandise sold	  37,406  32,057 Gross profit	 $16,147$13,681 Selling and store operating exp.	10,280		8,655	 General and administrative exp.	       935       835 Total operating expenses	$11,215$  9,490 Income from operations	$  4,932		$  4,191		 Other income and expenses: 	Interest and investment inc.	53		47	  	Interest expense	        (28)		        (21) 	 Income before income tax	$  4,957		$  4,217		 Income taxes	    1,913    1,636 Net income	$  3,044		$  2,581		 69.9 70.1 29.9% 	18.9%      1.8    20.7% 	9.2% 	0.1     (0.1) 	9.2%      3.6 	5.6%
25 14-28 HOME DEPOT INC.  Income Statement (in millions)For Periods Ended December 31, 2007 and December 31, 2006 2007                              2006 Amount    Percent     Amount        Percent Sales (net)	$53,553	 100.0%	$45,738	           100.0% Cost of merchandise sold	  37,406   32,057 Gross profit	 $16,147$13,681 Selling and store operating exp.	10,280		8,655	 General and administrative exp.	            935       835 Total operating expenses	$11,215$  9,490 Income from operations	$  4,932		$  4,191		 Other income and expenses: 	Interest and investment inc.	53		         47	  	Interest expense	           (28)		        (21) 	 Income before income tax	$  4,957		$  4,217		 Income taxes	    1,913    1,636 Net income	$  3,044		$  2,581		 70.1 30.1% 	19.2%      1.7    20.9% 	9.2% 	0.1     (0.0) 	9.3%      3.6 	5.7% 69.9 29.9% 	18.9%            1.8      20.7% 	9.2% 	0.1     (0.1) 	9.2%      3.6 	5.6%
26 Types of ratio analysis Profitability Ratio Efficiency/activity/asset management Ratio Liquidity Ratio Solvency Ratio Cash flow Investment
27 1. Profitability     1.  Return on capital              employed     2.  Gross profit ratio     3.  Net profit ratio 2. Liquidity    1.  Current ratio    2.  Quick ratio 3. Efficiency    1.  Debtors turnover    2. Debtors collection period    3.  Stock turnover ratio    4.  Asset turnover ratio 4.  Solvency/financial leverage management ratio       1. Debt to Equity ratio 	2.Debt ratio
28 Continueā€¦ā€¦ā€¦.. 6.  Investment      1.  Dividend yield      2.  Dividend cover      3.  Earnings per share      4.  Price/earnings ratio      5.  Interest cover 5.  Cash Flow      1. Cash flow ratio
29 Importance of Ratios ,[object Object]
Aid for comparisonsRatio provide benchmark to compare on company with another (inter-firm comparison) or to compare the same company over period of time (intra-firm comparison).
30 PROFITABILITY RATIO ,[object Object]
A low value of this ratio will affect the company ā€˜s ability to obtain debt, equity financing and the ability to grow or expand.i   Return on capital employed (ROCE) ,[object Object]
It measures the profitability from the shareholder view point.
It shows how many ringgit of the net income were earned for each ringgit invested by the owner.	=             Profit or earning after tax 	       x  100%     		       Average capital employed
31 Continueā€¦ ii.	Gross Profit Margin ,[object Object],=Sales ā€“ Cost of Goods Sold    x 100%				     	             Sales 			=	Gross Profit    x 100% Sales iii.	Net Profit Margin It measures the percentage of one ringgit of sales that results in net income. 	=	 Profit or earning after tax        x      100% 			Sales
32 LIQUIDITY RATIO It measure the short term ability of the organisation to pay debt and to meet unexpected need for cash. i.	Current Ratio To measure the ability of current asset that the company have to pay back the short term debt. 		=	  Current Asset 			Current Liability
33 Continueā€¦ ii. Quick Ratio ,[object Object],Current Asset ā€“ Stock ā€“ Prepayment                           Current Liability ,[object Object]
This ratio is useful for companies which cannot convert inventory into cash quickly if necessary. ,[object Object]
35 Generally the higher the ratio, the greater the financial stability and the lower the risk for both creditors and owners. However, the ratio should not be too high because that may indicate that the business is not reinvesting in long-term assets to maintain future productivity. High current ratio can actually indicate problems if inventories are getting larger than they should be or collections of receivables are slowing down.
36 EFFICIENCY RATIO Debtors turnover Measures how many times it takes customers to pay Credit sales  		     Average debtors
37 EFFICIENCY RATIO 1.  Debtors collection period Measures how long it takes customers to pay =	 Average debtors  x 365 days  OR365 days 		    Credit salesdebtors turnover This ratio indicates how many days it takes, on average to collect a dayā€™s sale revenue. The quicker a business collects and bank the money, the better it is to the company Large numbers of days is a negative signal, raising questions about the companyā€™s policies of granting credit such as; Unrestricted credit policies Longer credit limit Collection attempts is not very strength
38 Efficiency Ratio 3.  Stock turnover ratio measures how quickly stock moves through business This ratio means that the average length of time that the stocks are held before being sold. =	Cost of goods sold 	     Average stock It can also be calculated in days =	 Average stock   x  365 days	OR 365 days Cost of goods sold	        	    stock turnover
39 Efficiency Ratio Asset turnover ratio ,[object Object]
Measures how efficient the assets in generating sales=	          Sales           	 x 100%	         Average total assets
40 SOLVENCY/FINANCIAL LEVERAGE MANAGEMENT  RATIO 1. Debt to Equity ratio =   Total liabilities Total Equity  2. Debt ratio Also call debt to assets ratio     =   Total liabilities Total Asset
41 SOLVENCY/FINANCIAL LEVERAGE MANAGEMENT  RATIO ,[object Object]
The ability to pay interest as it come due/mature,[object Object]
43 Balance Sheet as at 31 Dec 2007
44 1.  Profitability Ratios a.  Return on Capital Employed  Profit after tax 			=  35 	= 16.3%   Average capital employed  	               215 b. Gross Profit Ratio Gross profit= 100 	= 50% 	  Sales				   200 c. Net Profit Ratio Net profit after taxation 		=  35  	= 17.5%              sales		 		   200
45 2.  Liquidity Ratios a.  Current Ratio Current assets		=	120	=	2:1	   	Current liabilities	 		60 b.  Quick Ratio Current assets - stock 	=	120-60   =	1:1 	Current liabilities	   	   	    60

More Related Content

What's hot

Analysis of financial statement of asianpaints ltd
Analysis of financial statement of asianpaints ltdAnalysis of financial statement of asianpaints ltd
Analysis of financial statement of asianpaints ltd
Brijin Jacob
Ā 
New ifrs 11 joint arrangements & associates
New ifrs 11 joint arrangements &  associatesNew ifrs 11 joint arrangements &  associates
New ifrs 11 joint arrangements & associates
ESHETIE MEKONENE AMARE
Ā 
Advanced financial accounting i
Advanced financial  accounting iAdvanced financial  accounting i
Advanced financial accounting i
Puput Hapsari
Ā 
Market value added
Market value addedMarket value added
Market value added
SowmyR
Ā 
Financial statement analysis
Financial statement analysisFinancial statement analysis
Financial statement analysis
kiran bala sahoo
Ā 

What's hot (20)

Consolidated financial statement
Consolidated financial statementConsolidated financial statement
Consolidated financial statement
Ā 
Example Presentation Of Financial Reports PowerPoint Presentation Slides
Example Presentation Of Financial Reports PowerPoint Presentation Slides Example Presentation Of Financial Reports PowerPoint Presentation Slides
Example Presentation Of Financial Reports PowerPoint Presentation Slides
Ā 
Indian accounting standard 7 (statement of cash flows)
Indian accounting standard 7 (statement of cash flows)Indian accounting standard 7 (statement of cash flows)
Indian accounting standard 7 (statement of cash flows)
Ā 
Analysis of financial statement of asianpaints ltd
Analysis of financial statement of asianpaints ltdAnalysis of financial statement of asianpaints ltd
Analysis of financial statement of asianpaints ltd
Ā 
minor project on ratio analysis of "......"
minor project on ratio analysis of "......"minor project on ratio analysis of "......"
minor project on ratio analysis of "......"
Ā 
Financial statement analysis
Financial statement analysisFinancial statement analysis
Financial statement analysis
Ā 
Accounting Standard-3 Cash Flow Statement by Nithin Raj
Accounting Standard-3 Cash Flow Statement by Nithin RajAccounting Standard-3 Cash Flow Statement by Nithin Raj
Accounting Standard-3 Cash Flow Statement by Nithin Raj
Ā 
Ratio Analysis of Coca-Cola
Ratio Analysis of Coca-ColaRatio Analysis of Coca-Cola
Ratio Analysis of Coca-Cola
Ā 
Present Value Interest Factor of an Annuity of 1$ Per Period Cumulative for 5...
Present Value Interest Factor of an Annuity of 1$ Per Period Cumulative for 5...Present Value Interest Factor of an Annuity of 1$ Per Period Cumulative for 5...
Present Value Interest Factor of an Annuity of 1$ Per Period Cumulative for 5...
Ā 
Itc financial statement analysis
Itc financial statement analysisItc financial statement analysis
Itc financial statement analysis
Ā 
New ifrs 11 joint arrangements & associates
New ifrs 11 joint arrangements &  associatesNew ifrs 11 joint arrangements &  associates
New ifrs 11 joint arrangements & associates
Ā 
Operating and financial leverage
Operating and financial leverageOperating and financial leverage
Operating and financial leverage
Ā 
Ratio Anaylsis Of Nokia .. Adeel Ahmad Wahla
Ratio Anaylsis Of Nokia .. Adeel Ahmad WahlaRatio Anaylsis Of Nokia .. Adeel Ahmad Wahla
Ratio Anaylsis Of Nokia .. Adeel Ahmad Wahla
Ā 
Advanced financial accounting i
Advanced financial  accounting iAdvanced financial  accounting i
Advanced financial accounting i
Ā 
3 years comparative ratio, trend analysis and common size statement of bajaj ...
3 years comparative ratio, trend analysis and common size statement of bajaj ...3 years comparative ratio, trend analysis and common size statement of bajaj ...
3 years comparative ratio, trend analysis and common size statement of bajaj ...
Ā 
Financial statement analysis
Financial statement analysisFinancial statement analysis
Financial statement analysis
Ā 
Market value added
Market value addedMarket value added
Market value added
Ā 
IAS 33-Earnings per share
IAS 33-Earnings per shareIAS 33-Earnings per share
IAS 33-Earnings per share
Ā 
Ifrs 11 joint arrangements
Ifrs 11 joint arrangementsIfrs 11 joint arrangements
Ifrs 11 joint arrangements
Ā 
Financial statement analysis
Financial statement analysisFinancial statement analysis
Financial statement analysis
Ā 

Viewers also liked

Biology form 4(Chap 1 (1)
Biology form 4(Chap 1 (1)Biology form 4(Chap 1 (1)
Biology form 4(Chap 1 (1)
rheetukaur
Ā 
Topic 9 Comparison Of Financial Statements
Topic 9 Comparison Of Financial StatementsTopic 9 Comparison Of Financial Statements
Topic 9 Comparison Of Financial Statements
guest441011
Ā 
Financial statement, taxes, and cash flow
Financial statement, taxes, and cash flowFinancial statement, taxes, and cash flow
Financial statement, taxes, and cash flow
Carrine Aulia
Ā 
R C F,Prashant V V
R C F,Prashant V VR C F,Prashant V V
R C F,Prashant V V
pachhya
Ā 
Chapter 2 financial statement, taxes, and cash flow
Chapter 2 financial statement, taxes, and cash flowChapter 2 financial statement, taxes, and cash flow
Chapter 2 financial statement, taxes, and cash flow
Chang Keng Kai Kent
Ā 
Information systems in the enterprise
Information systems in the enterpriseInformation systems in the enterprise
Information systems in the enterprise
Prof. Othman Alsalloum
Ā 
Material Requisite Planning
Material Requisite PlanningMaterial Requisite Planning
Material Requisite Planning
ajithsrc
Ā 
A PROJECT REPORT ON FINANCIAL ANALYSIS REFERNCE TO FEDERAL MOGUAL
A PROJECT REPORT ON FINANCIAL ANALYSIS REFERNCE TO FEDERAL MOGUALA PROJECT REPORT ON FINANCIAL ANALYSIS REFERNCE TO FEDERAL MOGUAL
A PROJECT REPORT ON FINANCIAL ANALYSIS REFERNCE TO FEDERAL MOGUAL
Harsharan Singh
Ā 

Viewers also liked (20)

A project report on financial statement analysis
A project report on financial statement analysisA project report on financial statement analysis
A project report on financial statement analysis
Ā 
Financial Statement Analysis: Learn The Best Tricks And Tips!
Financial Statement Analysis: Learn The Best Tricks And Tips!Financial Statement Analysis: Learn The Best Tricks And Tips!
Financial Statement Analysis: Learn The Best Tricks And Tips!
Ā 
Project report on Financial Statement Analysis and interpretation of A Company
Project report on Financial Statement Analysis and interpretation of A CompanyProject report on Financial Statement Analysis and interpretation of A Company
Project report on Financial Statement Analysis and interpretation of A Company
Ā 
A project report on analysis of financial statement of icici bank
A project report on analysis of financial statement of  icici bankA project report on analysis of financial statement of  icici bank
A project report on analysis of financial statement of icici bank
Ā 
Biology form 4(Chap 1 (1)
Biology form 4(Chap 1 (1)Biology form 4(Chap 1 (1)
Biology form 4(Chap 1 (1)
Ā 
PLDT Financial Statements (2013-2015)
PLDT Financial Statements (2013-2015)PLDT Financial Statements (2013-2015)
PLDT Financial Statements (2013-2015)
Ā 
Introduction to Financial Management
Introduction to Financial ManagementIntroduction to Financial Management
Introduction to Financial Management
Ā 
Topic 9 Comparison Of Financial Statements
Topic 9 Comparison Of Financial StatementsTopic 9 Comparison Of Financial Statements
Topic 9 Comparison Of Financial Statements
Ā 
PRODUCTION & OPERATIONS MANAGEMENT- QUALITY
PRODUCTION & OPERATIONS MANAGEMENT- QUALITYPRODUCTION & OPERATIONS MANAGEMENT- QUALITY
PRODUCTION & OPERATIONS MANAGEMENT- QUALITY
Ā 
Financial statement, taxes, and cash flow
Financial statement, taxes, and cash flowFinancial statement, taxes, and cash flow
Financial statement, taxes, and cash flow
Ā 
R C F,Prashant V V
R C F,Prashant V VR C F,Prashant V V
R C F,Prashant V V
Ā 
Ppt Slides On Tps,Dps & Eps
Ppt Slides On Tps,Dps & EpsPpt Slides On Tps,Dps & Eps
Ppt Slides On Tps,Dps & Eps
Ā 
Chapter 2 financial statement, taxes, and cash flow
Chapter 2 financial statement, taxes, and cash flowChapter 2 financial statement, taxes, and cash flow
Chapter 2 financial statement, taxes, and cash flow
Ā 
Information systems in the enterprise
Information systems in the enterpriseInformation systems in the enterprise
Information systems in the enterprise
Ā 
Introduction to Business Accounting
Introduction to Business AccountingIntroduction to Business Accounting
Introduction to Business Accounting
Ā 
Material Requirement Planning
Material Requirement PlanningMaterial Requirement Planning
Material Requirement Planning
Ā 
How to analyze a case study
How to analyze a case studyHow to analyze a case study
How to analyze a case study
Ā 
Chapter 16 Financial Planning
Chapter 16 Financial PlanningChapter 16 Financial Planning
Chapter 16 Financial Planning
Ā 
Material Requisite Planning
Material Requisite PlanningMaterial Requisite Planning
Material Requisite Planning
Ā 
A PROJECT REPORT ON FINANCIAL ANALYSIS REFERNCE TO FEDERAL MOGUAL
A PROJECT REPORT ON FINANCIAL ANALYSIS REFERNCE TO FEDERAL MOGUALA PROJECT REPORT ON FINANCIAL ANALYSIS REFERNCE TO FEDERAL MOGUAL
A PROJECT REPORT ON FINANCIAL ANALYSIS REFERNCE TO FEDERAL MOGUAL
Ā 

Similar to Topic 10 Financial Statement Analysis

nationwide 4Q07 Statistical Supplement
nationwide 	4Q07 Statistical Supplementnationwide 	4Q07 Statistical Supplement
nationwide 4Q07 Statistical Supplement
finance11
Ā 
nationwide 1Q07 Statistical Supplement
nationwide 	1Q07 Statistical Supplementnationwide 	1Q07 Statistical Supplement
nationwide 1Q07 Statistical Supplement
finance11
Ā 
FS-3FORD MOTOR COMPANY AND SUBSIDIARIESCONSOLIDATED INCO.docx
FS-3FORD MOTOR COMPANY AND SUBSIDIARIESCONSOLIDATED INCO.docxFS-3FORD MOTOR COMPANY AND SUBSIDIARIESCONSOLIDATED INCO.docx
FS-3FORD MOTOR COMPANY AND SUBSIDIARIESCONSOLIDATED INCO.docx
ericbrooks84875
Ā 
nationwide 1Q08 Statistical Supplement
nationwide 	1Q08 Statistical Supplementnationwide 	1Q08 Statistical Supplement
nationwide 1Q08 Statistical Supplement
finance11
Ā 
nationwide 2Q07 Statistical Supplement
nationwide 2Q07 Statistical Supplementnationwide 2Q07 Statistical Supplement
nationwide 2Q07 Statistical Supplement
finance11
Ā 
nationwide 4Q06 Statistical Supplement
nationwide 4Q06 Statistical Supplementnationwide 4Q06 Statistical Supplement
nationwide 4Q06 Statistical Supplement
finance11
Ā 
Kouris Company Consolidated Balance Sheets (in millions) Dec- 31 Year (1).pdf
Kouris Company Consolidated Balance Sheets (in millions) Dec- 31 Year (1).pdfKouris Company Consolidated Balance Sheets (in millions) Dec- 31 Year (1).pdf
Kouris Company Consolidated Balance Sheets (in millions) Dec- 31 Year (1).pdf
aalamsfashionjewels
Ā 
The Coca-Cola Company - Financial Analysis and Projections
The Coca-Cola Company - Financial Analysis and ProjectionsThe Coca-Cola Company - Financial Analysis and Projections
The Coca-Cola Company - Financial Analysis and Projections
Raeann Bailey
Ā 
Exercise 12-1Putnam Corporation had these transactions during 20.docx
Exercise 12-1Putnam Corporation had these transactions during 20.docxExercise 12-1Putnam Corporation had these transactions during 20.docx
Exercise 12-1Putnam Corporation had these transactions during 20.docx
gitagrimston
Ā 
danaher 06_4Q_Release
danaher 06_4Q_Releasedanaher 06_4Q_Release
danaher 06_4Q_Release
finance24
Ā 
AT&TFinancial and Operational Results
AT&TFinancial and Operational ResultsAT&TFinancial and Operational Results
AT&TFinancial and Operational Results
finance1
Ā 
AT&T Financial and Operational Results
AT&T Financial and Operational ResultsAT&T Financial and Operational Results
AT&T Financial and Operational Results
finance1
Ā 
John Deere 2008 Q3 10Q
 John Deere 2008 Q3 10Q John Deere 2008 Q3 10Q
John Deere 2008 Q3 10Q
finance11
Ā 

Similar to Topic 10 Financial Statement Analysis (20)

nationwide 4Q07 Statistical Supplement
nationwide 	4Q07 Statistical Supplementnationwide 	4Q07 Statistical Supplement
nationwide 4Q07 Statistical Supplement
Ā 
nationwide 1Q07 Statistical Supplement
nationwide 	1Q07 Statistical Supplementnationwide 	1Q07 Statistical Supplement
nationwide 1Q07 Statistical Supplement
Ā 
FS-3FORD MOTOR COMPANY AND SUBSIDIARIESCONSOLIDATED INCO.docx
FS-3FORD MOTOR COMPANY AND SUBSIDIARIESCONSOLIDATED INCO.docxFS-3FORD MOTOR COMPANY AND SUBSIDIARIESCONSOLIDATED INCO.docx
FS-3FORD MOTOR COMPANY AND SUBSIDIARIESCONSOLIDATED INCO.docx
Ā 
Silvercorp Metals Financial Statement
Silvercorp Metals Financial StatementSilvercorp Metals Financial Statement
Silvercorp Metals Financial Statement
Ā 
nationwide 1Q08 Statistical Supplement
nationwide 	1Q08 Statistical Supplementnationwide 	1Q08 Statistical Supplement
nationwide 1Q08 Statistical Supplement
Ā 
nationwide 2Q07 Statistical Supplement
nationwide 2Q07 Statistical Supplementnationwide 2Q07 Statistical Supplement
nationwide 2Q07 Statistical Supplement
Ā 
nationwide 4Q06 Statistical Supplement
nationwide 4Q06 Statistical Supplementnationwide 4Q06 Statistical Supplement
nationwide 4Q06 Statistical Supplement
Ā 
Kouris Company Consolidated Balance Sheets (in millions) Dec- 31 Year (1).pdf
Kouris Company Consolidated Balance Sheets (in millions) Dec- 31 Year (1).pdfKouris Company Consolidated Balance Sheets (in millions) Dec- 31 Year (1).pdf
Kouris Company Consolidated Balance Sheets (in millions) Dec- 31 Year (1).pdf
Ā 
The Coca-Cola Company - Financial Analysis and Projections
The Coca-Cola Company - Financial Analysis and ProjectionsThe Coca-Cola Company - Financial Analysis and Projections
The Coca-Cola Company - Financial Analysis and Projections
Ā 
Linkedin condensed consolidated balance sheets q2 2013
Linkedin condensed consolidated balance sheets q2 2013Linkedin condensed consolidated balance sheets q2 2013
Linkedin condensed consolidated balance sheets q2 2013
Ā 
S&W Second Quarter Fiscal 2018 Financial Results
S&W Second Quarter Fiscal 2018 Financial Results S&W Second Quarter Fiscal 2018 Financial Results
S&W Second Quarter Fiscal 2018 Financial Results
Ā 
Exercise 12-1Putnam Corporation had these transactions during 20.docx
Exercise 12-1Putnam Corporation had these transactions during 20.docxExercise 12-1Putnam Corporation had these transactions during 20.docx
Exercise 12-1Putnam Corporation had these transactions during 20.docx
Ā 
danaher 06_4Q_Release
danaher 06_4Q_Releasedanaher 06_4Q_Release
danaher 06_4Q_Release
Ā 
Project
ProjectProject
Project
Ā 
AT&TFinancial and Operational Results
AT&TFinancial and Operational ResultsAT&TFinancial and Operational Results
AT&TFinancial and Operational Results
Ā 
AT&T Financial and Operational Results
AT&T Financial and Operational ResultsAT&T Financial and Operational Results
AT&T Financial and Operational Results
Ā 
John Deere 2008 Q3 10Q
 John Deere 2008 Q3 10Q John Deere 2008 Q3 10Q
John Deere 2008 Q3 10Q
Ā 
September 2017 digital realty company overview
September 2017 digital realty company overviewSeptember 2017 digital realty company overview
September 2017 digital realty company overview
Ā 
Example of ActiveDisclosure Linked Audit Committee Package
Example of ActiveDisclosure Linked Audit Committee PackageExample of ActiveDisclosure Linked Audit Committee Package
Example of ActiveDisclosure Linked Audit Committee Package
Ā 
Digital realty 2017 investor day
Digital realty 2017 investor dayDigital realty 2017 investor day
Digital realty 2017 investor day
Ā 

More from guest441011

Topic 11 Cost Accounting And Management
Topic 11 Cost Accounting And ManagementTopic 11 Cost Accounting And Management
Topic 11 Cost Accounting And Management
guest441011
Ā 
Topic 7 Accounting For Liability And Owner Equity
Topic 7  Accounting For Liability And Owner EquityTopic 7  Accounting For Liability And Owner Equity
Topic 7 Accounting For Liability And Owner Equity
guest441011
Ā 
Topic 6 Debtors
Topic 6 DebtorsTopic 6 Debtors
Topic 6 Debtors
guest441011
Ā 
Topic 6 Cash
Topic 6 CashTopic 6 Cash
Topic 6 Cash
guest441011
Ā 
Topic 6 Non Current Asset
Topic 6 Non Current AssetTopic 6 Non Current Asset
Topic 6 Non Current Asset
guest441011
Ā 
Topic 6 Inventory
Topic 6 InventoryTopic 6 Inventory
Topic 6 Inventory
guest441011
Ā 
Stu Ch04 Completing The Accounting Cycle
Stu Ch04 Completing The Accounting CycleStu Ch04 Completing The Accounting Cycle
Stu Ch04 Completing The Accounting Cycle
guest441011
Ā 
Topic 4 The Mechanics Of Accounting
Topic 4 The Mechanics Of AccountingTopic 4 The Mechanics Of Accounting
Topic 4 The Mechanics Of Accounting
guest441011
Ā 
Topic 3 Accounting System And Control
Topic 3 Accounting System And ControlTopic 3 Accounting System And Control
Topic 3 Accounting System And Control
guest441011
Ā 
Topic 2 Business Entity
Topic 2 Business EntityTopic 2 Business Entity
Topic 2 Business Entity
guest441011
Ā 
Topic 1 ā€“ Part 2 The Accounting Areas And Professional Bodies
Topic 1 ā€“ Part 2 The Accounting Areas And Professional BodiesTopic 1 ā€“ Part 2 The Accounting Areas And Professional Bodies
Topic 1 ā€“ Part 2 The Accounting Areas And Professional Bodies
guest441011
Ā 
Introduction Of Accounting
Introduction Of AccountingIntroduction Of Accounting
Introduction Of Accounting
guest441011
Ā 
Ch05 Print
Ch05 PrintCh05 Print
Ch05 Print
guest441011
Ā 
Ch06 Print
Ch06 PrintCh06 Print
Ch06 Print
guest441011
Ā 
Ch07 Mlh Intro M.Aise Ppt
Ch07 Mlh Intro M.Aise PptCh07 Mlh Intro M.Aise Ppt
Ch07 Mlh Intro M.Aise Ppt
guest441011
Ā 
Ch02 Print
Ch02 PrintCh02 Print
Ch02 Print
guest441011
Ā 
Introduction to Marketing
Introduction to MarketingIntroduction to Marketing
Introduction to Marketing
guest441011
Ā 
Pemanasan Global
Pemanasan GlobalPemanasan Global
Pemanasan Global
guest441011
Ā 

More from guest441011 (18)

Topic 11 Cost Accounting And Management
Topic 11 Cost Accounting And ManagementTopic 11 Cost Accounting And Management
Topic 11 Cost Accounting And Management
Ā 
Topic 7 Accounting For Liability And Owner Equity
Topic 7  Accounting For Liability And Owner EquityTopic 7  Accounting For Liability And Owner Equity
Topic 7 Accounting For Liability And Owner Equity
Ā 
Topic 6 Debtors
Topic 6 DebtorsTopic 6 Debtors
Topic 6 Debtors
Ā 
Topic 6 Cash
Topic 6 CashTopic 6 Cash
Topic 6 Cash
Ā 
Topic 6 Non Current Asset
Topic 6 Non Current AssetTopic 6 Non Current Asset
Topic 6 Non Current Asset
Ā 
Topic 6 Inventory
Topic 6 InventoryTopic 6 Inventory
Topic 6 Inventory
Ā 
Stu Ch04 Completing The Accounting Cycle
Stu Ch04 Completing The Accounting CycleStu Ch04 Completing The Accounting Cycle
Stu Ch04 Completing The Accounting Cycle
Ā 
Topic 4 The Mechanics Of Accounting
Topic 4 The Mechanics Of AccountingTopic 4 The Mechanics Of Accounting
Topic 4 The Mechanics Of Accounting
Ā 
Topic 3 Accounting System And Control
Topic 3 Accounting System And ControlTopic 3 Accounting System And Control
Topic 3 Accounting System And Control
Ā 
Topic 2 Business Entity
Topic 2 Business EntityTopic 2 Business Entity
Topic 2 Business Entity
Ā 
Topic 1 ā€“ Part 2 The Accounting Areas And Professional Bodies
Topic 1 ā€“ Part 2 The Accounting Areas And Professional BodiesTopic 1 ā€“ Part 2 The Accounting Areas And Professional Bodies
Topic 1 ā€“ Part 2 The Accounting Areas And Professional Bodies
Ā 
Introduction Of Accounting
Introduction Of AccountingIntroduction Of Accounting
Introduction Of Accounting
Ā 
Ch05 Print
Ch05 PrintCh05 Print
Ch05 Print
Ā 
Ch06 Print
Ch06 PrintCh06 Print
Ch06 Print
Ā 
Ch07 Mlh Intro M.Aise Ppt
Ch07 Mlh Intro M.Aise PptCh07 Mlh Intro M.Aise Ppt
Ch07 Mlh Intro M.Aise Ppt
Ā 
Ch02 Print
Ch02 PrintCh02 Print
Ch02 Print
Ā 
Introduction to Marketing
Introduction to MarketingIntroduction to Marketing
Introduction to Marketing
Ā 
Pemanasan Global
Pemanasan GlobalPemanasan Global
Pemanasan Global
Ā 

Recently uploaded

Memorandum Of Association Constitution of Company.ppt
Memorandum Of Association Constitution of Company.pptMemorandum Of Association Constitution of Company.ppt
Memorandum Of Association Constitution of Company.ppt
seri bangash
Ā 
anas about venice for grade 6f about venice
anas about venice for grade 6f about veniceanas about venice for grade 6f about venice
anas about venice for grade 6f about venice
anasabutalha2013
Ā 
Vendors of country report usefull datass
Vendors of country report usefull datassVendors of country report usefull datass
Vendors of country report usefull datass
DilipParmar63
Ā 
NewBase 24 May 2024 Energy News issue - 1727 by Khaled Al Awadi_compresse...
NewBase   24 May  2024  Energy News issue - 1727 by Khaled Al Awadi_compresse...NewBase   24 May  2024  Energy News issue - 1727 by Khaled Al Awadi_compresse...
NewBase 24 May 2024 Energy News issue - 1727 by Khaled Al Awadi_compresse...
Khaled Al Awadi
Ā 

Recently uploaded (20)

April 2024 Nostalgia Products Newsletter
April 2024 Nostalgia Products NewsletterApril 2024 Nostalgia Products Newsletter
April 2024 Nostalgia Products Newsletter
Ā 
Team-Spandex-Northern University-CS1035.
Team-Spandex-Northern University-CS1035.Team-Spandex-Northern University-CS1035.
Team-Spandex-Northern University-CS1035.
Ā 
Memorandum Of Association Constitution of Company.ppt
Memorandum Of Association Constitution of Company.pptMemorandum Of Association Constitution of Company.ppt
Memorandum Of Association Constitution of Company.ppt
Ā 
Understanding UAE Labour Law: Key Points for Employers and Employees
Understanding UAE Labour Law: Key Points for Employers and EmployeesUnderstanding UAE Labour Law: Key Points for Employers and Employees
Understanding UAE Labour Law: Key Points for Employers and Employees
Ā 
5 Things You Need To Know Before Hiring a Videographer
5 Things You Need To Know Before Hiring a Videographer5 Things You Need To Know Before Hiring a Videographer
5 Things You Need To Know Before Hiring a Videographer
Ā 
How to Maintain Healthy Life style.pptx
How to Maintain  Healthy Life style.pptxHow to Maintain  Healthy Life style.pptx
How to Maintain Healthy Life style.pptx
Ā 
Using Generative AI for Content Marketing
Using Generative AI for Content MarketingUsing Generative AI for Content Marketing
Using Generative AI for Content Marketing
Ā 
Did Paul Haggis Ever Win an Oscar for Best Filmmaker
Did Paul Haggis Ever Win an Oscar for Best FilmmakerDid Paul Haggis Ever Win an Oscar for Best Filmmaker
Did Paul Haggis Ever Win an Oscar for Best Filmmaker
Ā 
sales plan presentation by mckinsey alum
sales plan presentation by mckinsey alumsales plan presentation by mckinsey alum
sales plan presentation by mckinsey alum
Ā 
IPTV Subscription UK: Your Guide to Choosing the Best Service
IPTV Subscription UK: Your Guide to Choosing the Best ServiceIPTV Subscription UK: Your Guide to Choosing the Best Service
IPTV Subscription UK: Your Guide to Choosing the Best Service
Ā 
Global Interconnection Group Joint Venture[960] (1).pdf
Global Interconnection Group Joint Venture[960] (1).pdfGlobal Interconnection Group Joint Venture[960] (1).pdf
Global Interconnection Group Joint Venture[960] (1).pdf
Ā 
Cracking the Change Management Code Main New.pptx
Cracking the Change Management Code Main New.pptxCracking the Change Management Code Main New.pptx
Cracking the Change Management Code Main New.pptx
Ā 
anas about venice for grade 6f about venice
anas about venice for grade 6f about veniceanas about venice for grade 6f about venice
anas about venice for grade 6f about venice
Ā 
Matt Conway - Attorney - A Knowledgeable Professional - Kentucky.pdf
Matt Conway - Attorney - A Knowledgeable Professional - Kentucky.pdfMatt Conway - Attorney - A Knowledgeable Professional - Kentucky.pdf
Matt Conway - Attorney - A Knowledgeable Professional - Kentucky.pdf
Ā 
Vendors of country report usefull datass
Vendors of country report usefull datassVendors of country report usefull datass
Vendors of country report usefull datass
Ā 
State of D2C in India: A Logistics Update
State of D2C in India: A Logistics UpdateState of D2C in India: A Logistics Update
State of D2C in India: A Logistics Update
Ā 
NewBase 24 May 2024 Energy News issue - 1727 by Khaled Al Awadi_compresse...
NewBase   24 May  2024  Energy News issue - 1727 by Khaled Al Awadi_compresse...NewBase   24 May  2024  Energy News issue - 1727 by Khaled Al Awadi_compresse...
NewBase 24 May 2024 Energy News issue - 1727 by Khaled Al Awadi_compresse...
Ā 
New Product Development.kjiy7ggbfdsddggo9lo
New Product Development.kjiy7ggbfdsddggo9loNew Product Development.kjiy7ggbfdsddggo9lo
New Product Development.kjiy7ggbfdsddggo9lo
Ā 
RMD24 | Retail media: hoe zet je dit in als je geen AH of Unilever bent? Heid...
RMD24 | Retail media: hoe zet je dit in als je geen AH of Unilever bent? Heid...RMD24 | Retail media: hoe zet je dit in als je geen AH of Unilever bent? Heid...
RMD24 | Retail media: hoe zet je dit in als je geen AH of Unilever bent? Heid...
Ā 
Unlock Your TikTok Potential: Free TikTok Likes with InstBlast
Unlock Your TikTok Potential: Free TikTok Likes with InstBlastUnlock Your TikTok Potential: Free TikTok Likes with InstBlast
Unlock Your TikTok Potential: Free TikTok Likes with InstBlast
Ā 

Topic 10 Financial Statement Analysis

  • 1. 1 TOPIC 10: FINANCIAL STATEMENT ANALYSIS
  • 2. 2 Introduction Interpretation is when users evaluate financial information to make judgements It is the key to any in-depth understanding of an organisationā€™s performance. Basically, the users evaluate an organisationā€™s performance and financial position using the information from INCOME STATEMENT and BALANCE SHEET. The value of the analysis is depends on the value of the financial statements.
  • 3. 3 Techniques (types) of analysis: 1.HorizontalAnalysis Comparing key figures in financial statement Evaluates a series of financial statement over a period of time. 2. Vertical Analysis Evaluates financial statement by expressing each item in a financial statement as a percent of the base amount (key figure) Key-figure (such as sales in IS and total assets on BS) are set to 100% Other items are then expressed as percentage of 100
  • 4. 4 Techniques (types) of analysis: (cont.) 3. Trend analysis Similar to horizontal analysis, except that the first set of account in the series is given a base of 100 4. Ratio Analysis It expresses the relationship among selected items of financial statement data.
  • 5. 5 Horizontal Analysis Itā€™s an analysis of the percentage increases and decreases of related items in comparative financial statements. What is horizontal analysis?
  • 6. 6 14-7 HOME DEPOTComparative Balance Sheets (in Millions)Dec 31, 2006 and Dec 31, 2007 Increase (Decrease) Dec 31, 2007Dec 31, 2006 Amount Percent Assets Current assets $10,361 $ 7,777 $2,584 33.2% Property and equipment, net 15,375 13,068 2,307 17.7 Other assets 658 540 118 21.9 Total assets $26,394 $21,385 $5,009 23.4 Liabilities Current liabilities $ 6,501 $ 4,385 $2,116 48.3 Long-term debt, excluding current installment 1,250 1,545 (295) (19.1) Other long-term liabilities 372 256 116 45.3 Deferred income taxes 189 195 (6) (3.1) Total long-term liabilities $ 1,811$ 1,996$ (185) (9.3) Total liabilities $ 8,312$ 6,381$1,931 30.3 The stockholdersā€™ equity section is not displayed.
  • 7. 7 Horizontal Analysis: Difference $2,584 Base year $7,777 = 33.2% 14-8 HOME DEPOTComparative Balance Sheets (in Millions)Dec 31, 2006 and Dec 31, 2007 Increase (Decrease) Dec 31, 2007Dec 31, 2006 Amount Percent Assets Current assets $10,361 $ 7,777 $2,584 33.2% Property and equipment, net 15,375 13,068 2,307 17.7 Other assets 658 540 118 21.9 Total assets $26,394 $21,385 $5,009 23.4 Liabilities Current liabilities $ 6,501 $ 4,385 $2,116 48.3 Long-term debt, excluding current installment 1,250 1,545 (295) (19.1) Other long-term liabilities 372 256 116 45.3 Deferred income taxes 189 195 (6) (3.1) Total long-term liabilities $ 1,811$ 1,996$ (185) (9.3) Total liabilities $ 8,312$ 6,381$1,931 30.3 33.2%
  • 8. 8 Horizontal Analysis: Difference $2,307 Base year $13,068 = 17.7% 14-9 HOME DEPOTComparative Balance Sheets (in Millions)Dec 31, 2006 and Dec 31, 2007 Condensed Increase (Decrease) Dec 31, 2007Dec 31, 2006 Amount Percent Assets Current assets $10,361 $ 7,777 $2,584 33.2% Property and equipment, net 15,375 13,068 2,307 17.7 Other assets 658 540 118 21.9 Total assets $26,394 $21,385 $5,009 23.4 Liabilities Current liabilities $ 6,501 $ 4,385 $2,116 48.3 Long-term debt, excluding current installment 1,250 1,545 (295) (19.1) Other long-term liabilities 372 256 116 45.3 Deferred income taxes 189 195 (6) (3.1) Total long-term liabilities $ 1,811$ 1,996$ (185) (9.3) Total liabilities $ 8,312$ 6,381$1,931 30.3 33.2% 33.2% 17.7
  • 9. 9 14-10 HOME DEPOTComparative Balance Sheets (in Millions)Dec 31, 2006 and Dec 31, 2007 Condensed Increase (Decrease) Dec 31, 2007Dec 31, 2006 Amount Percent Assets Current assets $10,361 $ 7,777 $2,584 33.2% Property and equipment, net 15,375 13,068 2,307 17.7 Other assets 658 540 11821.9 Total assets $26,394 $21,385 $5,009 23.4 Liabilities Current liabilities $ 6,501 $ 4,385 $2,116 48.3 Long-term debt, excluding current installment 1,250 1,545 (295) (19.1) Other long-term liabilities 372 256 116 45.3 Deferred income taxes 189 195 (6) (3.1) Total long-term liabilities $ 1,811$ 1,996$ (185) (9.3) Total liabilities $ 8,312$ 6,381$1,93130.3
  • 10. 10 Horizontal Analysis: Difference $7,815 Base year $45,738 = 17.1% 14-11 HOME DEPOT INC. Income Statement (in millions)For Periods Ended December 31, 2007 and December 31, 2006 Increase (Decrease) Dec 31, 2007Dec 31, 2006 Amount Percent 17.1% Sales (net) $53,553 $45,738 $7,815 Cost of merchandise sold 37,406 32,057 5,349 Gross profit $16,147$13,681$2,466 Selling and store operating exp. 10,280 8,655 1,625 General and administrative exp. 935 835 100 Total operating expenses $11,215$ 9,490$1,725 Income from operations $ 4,932 $ 4,191 $ 741 Other income and expenses: Interest and investment inc. 53 47 6 Interest expense (28) (21) (7) Income before income tax $ 4,957 $ 4,217 $ 740 Income taxes 1,913 1,636 277 Net income $ 3,044 $ 2,581 $ 463
  • 11. 11 Horizontal Analysis: Difference $5,349 Base year $32,057 = 16.7 14-12 HOME DEPOT INC. Income Statement (in millions)For Periods Ended December 31, 2007 and December 31, 2006 Increase (Decrease) Dec 31, 2007Dec 31, 2006 Amount Percent 17.1% Sales (net) $53,553 $45,738 $7,815 Cost of merchandise sold 37,406 32,057 5,349 Gross profit $16,147$13,681$2,466 Selling and store operating exp. 10,280 8,655 1,625 General and administrative exp. 935 835 100 Total operating expenses $11,215$ 9,490$1,725 Income from operations $ 4,932 $ 4,191 $ 741 Other income and expenses: Interest and investment inc. 53 47 6 Interest expense (28) (21) (7) Income before income tax $ 4,957 $ 4,217 $ 740 Income taxes 1,913 1,636 277 Net income $ 3,044 $ 2,581 $ 463 16.7
  • 12. 12 17.1% 16.7 14-13 HOME DEPOT INC. Income Statement (in millions)For Periods Ended December 31, 2007 and December 31, 2006 Increase (Decrease) Dec 31, 2007Dec 31, 2006 Amount Percent Sales (net) $53,553 $45,738 $7,815 Cost of merchandise sold 37,406 32,057 5,349 Gross profit $16,147$13,681$2,466 Selling and store operating exp. 10,280 8,655 1,625 General and administrative exp. 935 835 100 Total operating expenses $11,215$ 9,490$1,725 Income from operations $ 4,932 $ 4,191 $ 741 Other income and expenses: Interest and investment inc. 53 47 6 Interest expense (28) (21) (7) Income before income tax $ 4,957 $ 4,217 $ 740 Income taxes 1,913 1,636 277 Net income $ 3,044 $ 2,581 $ 463 18.0 18.8 12.0 18.2 17.7 12.8 33.3 17.5 16.9 17.9
  • 13. 13 Vertical Analysis A percentage analysis can be used to show the relationship of each component to a total within a single statement.
  • 14. 14 Vertical Analysis The total, or 100% item, on the balance sheet is ā€œtotal assets.ā€ The total, or 100% item, on the income statement is ā€œtotal sales.ā€
  • 15. 15 14-18 14-18 HOME DEPOTComparative Balance Sheets (in Millions) December 31, 2007 and December 31, 2006 Condensed December 31, 2007 December 31, 2006 Amount Percent Amount Percent Assets Current assets $10,361 $ 7,777 Property and equipment, net 15,375 13,068 Other assets 58 540 Total assets $26,394 $21,385 Liabilities Current liabilities $ 6,501 $ 4,385 Long-term liabilities 1,811 1,996 Total liabilities $ 8,312$ 6,381 Stockholdersā€™ Equity Common stock/paid-in capital $ 5,529 $ 4,926 RE & accumulated comp. loss 12,553 10,078 Total stockholdersā€™ equity $18,082$15,004 Total liabilities and SE $26,394 $21,385 100.0% Total assets is 100.0%
  • 16. 16 Vertical Analysis: Current assets $10,361 Total assets $26,394 = 39.3% 14-19 HOME DEPOTComparative Balance Sheets (in Millions)December 31, 2007 and December 31, 2006 Condensed December 31, 2007 December 31, 2006 Amount Percent Amount Percent Assets Current assets $10,361 $ 7,777 Property and equipment, net 15,375 13,068 Other assets 58 540 Total assets $26,394 $21,385 Liabilities Current liabilities $ 6,501 $ 4,385 Long-term liabilities 1,811 1,996 Total liabilities $ 8,312$ 6,381 Stockholdersā€™ Equity Common stock/paid-in capital $ 5,529 $ 4,926 RE & accumulated comp. loss 12,553 10,078 Total stockholdersā€™ equity $18,082$15,004 Total liabilities and SE $26,394 $21,385 39.3% 100.0%
  • 17. 17 14-20 HOME DEPOTComparative Balance Sheets (in Millions)December 31, 2007 and December 31, 2006 Condensed December 31, 2007 December 31, 2006 Amount Percent Amount Percent Assets Current assets $10,361 $ 7,777 Property and equipment, net 15,375 13,068 Other assets 58 540 Total assets $26,394 $21,385 Liabilities Current liabilities $ 6,501 $ 4,385 Long-term liabilities 1,811 1,996 Total liabilities $ 8,312$ 6,381 Stockholdersā€™ Equity Common stock/paid-in capital $ 5,529 $ 4,926 RE & accumulated comp. loss 12,553 10,078 Total stockholdersā€™ equity $18,082$15,004 Total liabilities and SE $26,394 $21,385 39.3% 58.2 2.5 100.0% 24.6% 6.9 31.5% 20.9% 47.6 68.5% 100.0%
  • 18. 18 39.3% 58.2 2.5 100.0% 24.6% 6.9 31.5% 20.9% 47.6 68.5% 100.0% 14-21 HOME DEPOTComparative Balance Sheets (in Millions)December 31, 2007 and December 31, 2006 Condensed December 31, 2007 December 31, 2006 Amount Percent Amount Percent Assets Current assets $10,361 $ 7,777 Property and equipment, net 15,375 13,068 Other assets 58 540 Total assets $26,394 $21,385 Liabilities Current liabilities $ 6,501 $ 4,385 Long-term liabilities 1,811 1,996 Total liabilities $ 8,312$ 6,381 Stockholdersā€™ Equity Common stock/paid-in capital $ 5,529 $ 4,926 RE & accumulated comp. loss 12,553 10,078 Total stockholdersā€™ equity $18,082$15,004 Total liabilities and SE $26,394 $21,385 100.0% Total assets is 100.0%
  • 19. 19 39.3% 58.2 2.5 100.0% 24.6% 6.9 31.5% 20.9% 47.6 68.5% 100.0% Vertical Analysis: Current assets $7,777 Total assets $21,385 = 36.4% 14-22 HOME DEPOTComparative Balance Sheets (in Millions)December 31, 2007 and December 31, 2006 Condensed December 31, 2007 December 31, 2006 Amount Percent Amount Percent Assets Current assets $10,361 $ 7,777 Property and equipment, net 15,375 13,068 Other assets 58 540 Total assets $26,394 $21,385 Liabilities Current liabilities $ 6,501 $ 4,385 Long-term liabilities 1,811 1,996 Total liabilities $ 8,312$ 6,381 Stockholdersā€™ Equity Common stock/paid-in capital $ 5,529 $ 4,926 RE & accumulated comp. loss 12,553 10,078 Total stockholdersā€™ equity $18,082$15,004 Total liabilities and SE $26,394 $21,385 36.4% 100.0%
  • 20. 20 39.3% 58.2 2.5 100.0% 24.6% 6.9 31.5% 20.9% 47.6 68.5% 100.0% 14-23 HOME DEPOTComparative Balance Sheets (in Millions)December 31, 2007 and December 31, 2006 Condensed December 31, 2007 December 31, 2006 Amount Percent Amount Percent Assets Current assets $10,361 $ 7,777 Property and equipment, net 15,375 13,068 Other assets 58 540 Total assets $26,394 $21,385 Liabilities Current liabilities $ 6,501 $ 4,385 Long-term liabilities 1,811 1,996 Total liabilities $ 8,312$ 6,381 Stockholdersā€™ Equity Common stock/paid-in capital $ 5,529 $ 4,926 RE & accumulated comp. loss 12,553 10,078 Total stockholdersā€™ equity $18,082$15,004 Total liabilities and SE $26,394 $21,385 36.4% 61.1 2.5 100.0% 20.5% 9.3 29.8% 23.0% 47.1 70.2% 100.0%
  • 21. 21 14-24 HOME DEPOT INC. Income Statement (in millions)For Periods Ended December 31, 2007 and December 31, 2006 2007 2006 Amount Percent Amount Percent Sales (net) $53,553 100.0% $45,738 100.0% Cost of merchandise sold 37,406 32,057 Gross profit $16,147$13,681 Selling and store operating exp. 10,280 8,655 General and administrative exp. 935 835 Total operating expenses $11,215$ 9,490 Income from operations $ 4,932 $ 4,191 Other income and expenses: Interest and investment inc. 53 47 Interest expense (28) (21) Income before income tax $ 4,957 $ 4,217 Income taxes 1,913 1,636 Net income $ 3,044 $ 2,581 Net sales is 100.0% Net sales is 100.0%
  • 22. 22 2006 Vertical Analysis: Cost of Merchandise Sold $32,057 Net Sales $45,738 = 70.1% 14-25 HOME DEPOT INC. Income Statement (in millions)For Periods Ended December 31, 2007 and December 31, 2006 2007 2006 Amount Percent Amount Percent Sales (net) $53,553 100.0% $45,738 100.0% Cost of merchandise sold 37,406 32,057 Gross profit $16,147$13,681 Selling and store operating exp. 10,280 8,655 General and administrative exp. 935 835 Total operating expenses $11,215$ 9,490 Income from operations $ 4,932 $ 4,191 Other income and expenses: Interest and investment inc. 53 47 Interest expense (28) (21) Income before income tax $ 4,957 $ 4,217 Income taxes 1,913 1,636 Net income $ 3,044 $ 2,581 70.1
  • 23. 23 2007 Vertical Analysis: Cost of Merchandise Sold $37,406 Net Sales $53,553 = 69.9% 14-26 HOME DEPOT INC. Income Statement (in millions)For Periods Ended December 31, 2007 and December 31, 2006 2007 2006 Amount Percent Amount Percent Sales (net) $53,553 100.0% $45,738 100.0% Cost of merchandise sold 37,406 32,057 Gross profit $16,147$13,681 Selling and store operating exp. 10,280 8,655 General and administrative exp. 935 835 Total operating expenses $11,215$ 9,490 Income from operations $ 4,932 $ 4,191 Other income and expenses: Interest and investment inc. 53 47 Interest expense (28) (21) Income before income tax $ 4,957 $ 4,217 Income taxes 1,913 1,636 Net income $ 3,044 $ 2,581 69.9 70.1
  • 24. 24 14-27 HOME DEPOT INC. Income Statement (in millions)For Periods Ended December 31, 2007 and December 31, 2006 2007 2007 Amount Percent Amount Percent Sales (net) $53,553 100.0% $45,738 100.0% Cost of merchandise sold 37,406 32,057 Gross profit $16,147$13,681 Selling and store operating exp. 10,280 8,655 General and administrative exp. 935 835 Total operating expenses $11,215$ 9,490 Income from operations $ 4,932 $ 4,191 Other income and expenses: Interest and investment inc. 53 47 Interest expense (28) (21) Income before income tax $ 4,957 $ 4,217 Income taxes 1,913 1,636 Net income $ 3,044 $ 2,581 69.9 70.1 29.9% 18.9% 1.8 20.7% 9.2% 0.1 (0.1) 9.2% 3.6 5.6%
  • 25. 25 14-28 HOME DEPOT INC. Income Statement (in millions)For Periods Ended December 31, 2007 and December 31, 2006 2007 2006 Amount Percent Amount Percent Sales (net) $53,553 100.0% $45,738 100.0% Cost of merchandise sold 37,406 32,057 Gross profit $16,147$13,681 Selling and store operating exp. 10,280 8,655 General and administrative exp. 935 835 Total operating expenses $11,215$ 9,490 Income from operations $ 4,932 $ 4,191 Other income and expenses: Interest and investment inc. 53 47 Interest expense (28) (21) Income before income tax $ 4,957 $ 4,217 Income taxes 1,913 1,636 Net income $ 3,044 $ 2,581 70.1 30.1% 19.2% 1.7 20.9% 9.2% 0.1 (0.0) 9.3% 3.6 5.7% 69.9 29.9% 18.9% 1.8 20.7% 9.2% 0.1 (0.1) 9.2% 3.6 5.6%
  • 26. 26 Types of ratio analysis Profitability Ratio Efficiency/activity/asset management Ratio Liquidity Ratio Solvency Ratio Cash flow Investment
  • 27. 27 1. Profitability 1. Return on capital employed 2. Gross profit ratio 3. Net profit ratio 2. Liquidity 1. Current ratio 2. Quick ratio 3. Efficiency 1. Debtors turnover 2. Debtors collection period 3. Stock turnover ratio 4. Asset turnover ratio 4. Solvency/financial leverage management ratio 1. Debt to Equity ratio 2.Debt ratio
  • 28. 28 Continueā€¦ā€¦ā€¦.. 6. Investment 1. Dividend yield 2. Dividend cover 3. Earnings per share 4. Price/earnings ratio 5. Interest cover 5. Cash Flow 1. Cash flow ratio
  • 29.
  • 30. Aid for comparisonsRatio provide benchmark to compare on company with another (inter-firm comparison) or to compare the same company over period of time (intra-firm comparison).
  • 31.
  • 32.
  • 33. It measures the profitability from the shareholder view point.
  • 34. It shows how many ringgit of the net income were earned for each ringgit invested by the owner. = Profit or earning after tax x 100% Average capital employed
  • 35.
  • 36. 32 LIQUIDITY RATIO It measure the short term ability of the organisation to pay debt and to meet unexpected need for cash. i. Current Ratio To measure the ability of current asset that the company have to pay back the short term debt. = Current Asset Current Liability
  • 37.
  • 38.
  • 39. 35 Generally the higher the ratio, the greater the financial stability and the lower the risk for both creditors and owners. However, the ratio should not be too high because that may indicate that the business is not reinvesting in long-term assets to maintain future productivity. High current ratio can actually indicate problems if inventories are getting larger than they should be or collections of receivables are slowing down.
  • 40. 36 EFFICIENCY RATIO Debtors turnover Measures how many times it takes customers to pay Credit sales Average debtors
  • 41. 37 EFFICIENCY RATIO 1. Debtors collection period Measures how long it takes customers to pay = Average debtors x 365 days OR365 days Credit salesdebtors turnover This ratio indicates how many days it takes, on average to collect a dayā€™s sale revenue. The quicker a business collects and bank the money, the better it is to the company Large numbers of days is a negative signal, raising questions about the companyā€™s policies of granting credit such as; Unrestricted credit policies Longer credit limit Collection attempts is not very strength
  • 42. 38 Efficiency Ratio 3. Stock turnover ratio measures how quickly stock moves through business This ratio means that the average length of time that the stocks are held before being sold. = Cost of goods sold Average stock It can also be calculated in days = Average stock x 365 days OR 365 days Cost of goods sold stock turnover
  • 43.
  • 44. Measures how efficient the assets in generating sales= Sales x 100% Average total assets
  • 45. 40 SOLVENCY/FINANCIAL LEVERAGE MANAGEMENT RATIO 1. Debt to Equity ratio = Total liabilities Total Equity 2. Debt ratio Also call debt to assets ratio = Total liabilities Total Asset
  • 46.
  • 47.
  • 48. 43 Balance Sheet as at 31 Dec 2007
  • 49. 44 1. Profitability Ratios a. Return on Capital Employed Profit after tax = 35 = 16.3% Average capital employed 215 b. Gross Profit Ratio Gross profit= 100 = 50% Sales 200 c. Net Profit Ratio Net profit after taxation = 35 = 17.5% sales 200
  • 50. 45 2. Liquidity Ratios a. Current Ratio Current assets = 120 = 2:1 Current liabilities 60 b. Quick Ratio Current assets - stock = 120-60 = 1:1 Current liabilities 60
  • 51. 46 3. Efficiency Ratios Debtors Collection Period Average debtors x 365 = 40 x 365 = 73 days Credit sales 200
  • 52. 47 c. Stock Turnover COGS = 100 = 1.66 times Average stock 60 d. Asset Turnover Ratio Sales x 100% = 200 x 100% Average total assets 395 = 51%
  • 53. 48 4. Financing ratio a) Debt to equity ratio Total liabilities = 180 = 0.837 Total equity 215 b) Debt ratio Total liabilities = 180 = 0.456 Total assets 395
  • 54. 49 Limitations of the Accounting Information Estimates The financial statement contains numerous estimates. Eg. Provision for doubtful debt, depreciation and contingent loss. Cost The traditional financial statements are based on historical cost, it is not adjusted for price-level change. Eg. Inflation affects the sales growth. Alternative Accounting Method A comparison may be misleading as different companies use different accounting method. Eg. FIFO and LIFO. Diversification of firms This diversification of activities of companies limit the usefulness of financial analysis. (no specific industry).
  • 55.
  • 56. Ratio analysis must be compared with past result or industry norms, not in isolation
  • 57. Things to be taken into account in using ratio analysis:
  • 58. size of the organisation
  • 59. Method used in accounting treatment