
Recommended
Recommended
More Related Content
What's hot
What's hot (11)
Viewers also liked
Similar to Linkedin condensed consolidated balance sheets q2 2013
Similar to Linkedin condensed consolidated balance sheets q2 2013 (20)
Recently uploaded
Recently uploaded (20)
Linkedin condensed consolidated balance sheets q2 2013
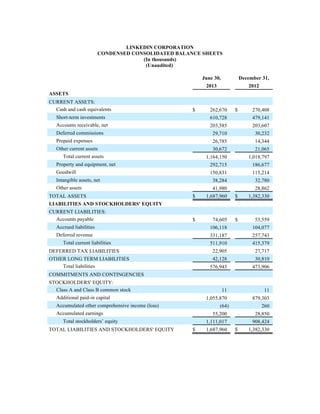
- 1. LINKEDIN CORPORATION CONDENSED CONSOLIDATED BALANCE SHEETS (In thousands) (Unaudited) June 30, December 31, 2013 2012 ASSETS CURRENT ASSETS: Cash and cash equivalents $ 262,670 $ 270,408 Short-term investments 610,728 479,141 Accounts receivable, net 203,585 203,607 Deferred commissions 29,710 30,232 Prepaid expenses 26,785 14,344 Other current assets 30,672 21,065 Total current assets 1,164,150 1,018,797 Property and equipment, net 292,715 186,677 Goodwill 150,831 115,214 Intangible assets, net 38,284 32,780 Other assets 41,980 28,862 TOTAL ASSETS $ 1,687,960 $ 1,382,330 LIABILITIES AND STOCKHOLDERS' EQUITY CURRENT LIABILITIES: Accounts payable $ 74,605 $ 53,559 Accrued liabilities 106,118 104,077 Deferred revenue 331,187 257,743 Total current liabilities 511,910 415,379 DEFERRED TAX LIABILITIES 22,905 27,717 OTHER LONG TERM LIABILITIES 42,128 30,810 Total liabilities 576,943 473,906 COMMITMENTS AND CONTINGENCIES STOCKHOLDERS' EQUITY: Class A and Class B common stock 11 11 Additional paid-in capital 1,055,870 879,303 Accumulated other comprehensive income (loss) (64) 260 Accumulated earnings 55,200 28,850 Total stockholders’ equity 1,111,017 908,424 TOTAL LIABILITIES AND STOCKHOLDERS' EQUITY $ 1,687,960 $ 1,382,330
- 2. LINKEDIN CORPORATION CONDENSED CONSOLIDATED STATEMENTS OF OPERATIONS (In thousands, except per share data) (Unaudited) Three Months Ended Six Months Ended June 30, June 30, 2013 2012 2013 2012 Net revenue $ 363,661 $ 228,207 $ 688,366 $ 416,663 Costs and expenses: Cost of revenue (exclusive of depreciation and amortization shown separately below) 49,264 30,367 91,648 55,500 Sales and marketing 122,276 75,740 231,693 141,624 Product development 95,608 60,080 176,280 107,173 General and administrative 56,225 30,974 99,009 55,828 Depreciation and amortization 32,193 17,548 57,999 32,430 Total costs and expenses 355,566 214,709 656,629 392,555 Income from operations 8,095 13,498 31,737 24,108 Other expense, net (252) (668) (560) (444) Income before income taxes 7,843 12,830 31,177 23,664 Provision for income taxes 4,109 10,019 4,827 15,864 Net income $ 3,734 $ 2,811 $ 26,350 $ 7,800 Net income per share of common stock: Basic $ 0.03 $ 0.03 $ 0.24 $ 0.08 Diluted $ 0.03 $ 0.03 $ 0.23 $ 0.07 Weighted-average shares used to compute net income per share: Basic 111,214 104,185 110,334 103,198 Diluted 116,627 112,317 116,017 111,813
- 3. LINKEDIN CORPORATION CONDENSED CONSOLIDATED STATEMENTS OF CASH FLOWS (In thousands) (Unaudited) Three Months Ended June 30, Six Months Ended June 30, 2013 2012 2013 2012 OPERATING ACTIVITIES: Net income $ 3,734 $ 2,811 $ 26,350 $ 7,800 Adjustments to reconcile net income to net cash provided by operating activities: Depreciation and amortization 32,193 17,548 57,999 32,430 Provision (benefit) for doubtful accounts and sales returns 1,639 (227) 2,953 (290) Stock-based compensation 48,354 19,323 82,293 31,949 Excess income tax benefit from stock-based compensation (5,003) (8,110) (17,559) (10,367) Changes in operating assets and liabilities: Accounts receivable 8,577 (16,949) (272) (22,457) Deferred commissions 1,185 (1,636) 543 (2,073) Prepaid expenses and other assets (8,448) (10,699) (17,846) (20,274) Accounts payable and other liabilities 24,313 16,144 20,815 26,816 Income taxes, net 3,522 11,617 (726) 14,484 Deferred revenue 14,099 17,176 73,444 52,195 Net cash provided by operating activities 124,165 46,998 227,994 110,213 INVESTING ACTIVITIES: Purchases of property and equipment (93,184) (37,604) (137,467) (59,691) Purchases of investments (98,715) (116,065) (256,925) (179,377) Sales of investments 17,389 24,304 76,420 24,304 Maturities of investments 33,897 38,361 45,127 60,726 Payments for intangible assets and acquisitions, net of cash acquired (6,321) (40,297) (6,547) (47,900) Changes in deposits and restricted cash (3,488) (648) (3,543) (2,702) Net cash used in investing activities (150,422) (131,949) (282,935) (204,640) FINANCING ACTIVITIES: Proceeds from issuance of common stock from employee stock options 7,681 14,214 19,738 23,891 Proceeds from issuance of common stock from employee stock purchase plan 11,500 7,718 11,500 7,718 Excess income tax benefit from stock-based compensation 5,003 8,110 17,559 10,367 Other financing activities 797 (176) 813 (140) Net cash provided by financing activities 24,981 29,866 49,610 41,836 EFFECT OF EXCHANGE RATE CHANGES ON CASH AND CASH EQUIVALENTS (993) (787) (2,407) (81) CHANGE IN CASH AND CASH EQUIVALENTS (2,269) (55,872) (7,738) (52,672) CASH AND CASH EQUIVALENTS—Beginning of period 264,939 342,248 270,408 339,048 CASH AND CASH EQUIVALENTS—End of period $ 262,670 $ 286,376 $ 262,670 $ 286,376 SUPPLEMENTAL DISCLOSURES OF NONCASH INVESTING AND FINANCING ACTIVITIES: Purchases of property and equipment recorded in accounts payable and accrued liabilities $ 8,032 $ 5,984 $ 36,103 $ 17,402 Vesting of early exercised stock options $ 256 $ 1,858 $ 547 $ 2,630 Issuance of Class A common stock and stock options for business combinations $ 40,927 $ 72,461 $ 40,927 $ 72,461
- 4. LINKEDIN CORPORATION SUPPLEMENTAL REVENUE INFORMATION (In thousands) (Unaudited) Three Months Ended Six Months Ended June 30, June 30, 2013 2012 2013 2012 Revenue by product: Talent Solutions $ 205,092 $ 121,592 $ 389,376 $ 224,152 Marketing Solutions 85,593 63,105 160,389 111,055 Premium Subscriptions 72,976 43,510 138,601 81,456 Total $ 363,661 $ 228,207 $ 688,366 $ 416,663 Revenue by geographic region: United States $ 224,277 $ 147,253 $ 425,680 $ 268,102 Other Americas (1) 26,857 15,047 51,033 27,056 Total Americas 251,134 162,300 476,713 295,158 EMEA (2) 84,691 50,057 159,848 92,902 APAC (3) 27,836 15,850 51,805 28,603 Total $ 363,661 $ 228,207 $ 688,366 $ 416,663 Revenue by channel: Field sales $ 209,227 $ 129,448 $ 393,198 $ 230,919 Online sales 154,434 98,759 295,168 185,744 Total $ 363,661 $ 228,207 $ 688,366 $ 416,663 ______________ (1) Canada, Latin America and South America (2) Europe, the Middle East and Africa (“EMEA”) (3) Asia-Pacific (“APAC”)
- 5. LINKEDIN CORPORATION RECONCILIATION OF GAAP TO NON-GAAP FINANCIAL MEASURES (In thousands, except per share data) (Unaudited) Three Months Ended Six Months Ended June 30, June 30, 2013 2012 2013 2012 Non-GAAP net income and net income per share: GAAP net income $ 3,734 $ 2,811 $ 26,350 $ 7,800 Add back: stock-based compensation 48,354 19,323 82,293 31,949 Add back: amortization of intangible assets 5,677 1,851 8,518 3,159 Income tax effect of non-GAAP adjustments (13,307) (5,933) (20,302) (7,923) NON-GAAP NET INCOME $ 44,458 $ 18,052 $ 96,859 $ 34,985 GAAP AND NON-GAAP DILUTED SHARES 116,627 112,317 116,017 111,813 NON-GAAP DILUTED NET INCOME PER SHARE $ 0.38 $ 0.16 $ 0.83 $ 0.31 Adjusted EBITDA: Net income $ 3,734 $ 2,811 $ 26,350 $ 7,800 Provision for income taxes 4,109 10,019 4,827 15,864 Other expense, net 252 668 560 444 Depreciation and amortization 32,193 17,548 57,999 32,430 Stock-based compensation 48,354 19,323 82,293 31,949 ADJUSTED EBITDA $ 88,642 $ 50,369 $ 172,029 $ 88,487