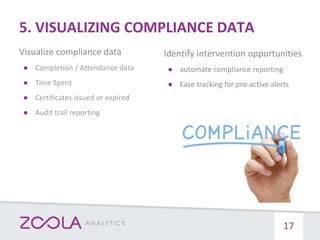
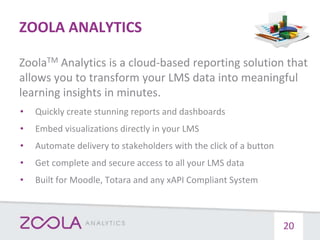
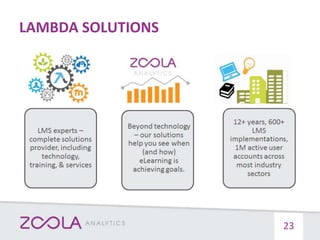
STEWART ROGERS
Director Product Management, Lambda Solutions
Tips for Driving Learning Success
with Moodle LMS Reporting
HOUSEKEEPING
2
• Sound and audio
• Poll questions
• Q&A at the end
• Presentation recording and slides
• Post-webinar survey
AGENDA
3
• Reporting A-Z
• 5 Tips for Measuring Learner Success in Moodle
• Live Zoola Analytics Demonstration
SPEAKERS TODAY
4
Nimritta Parmar
Marketing
Coordinator
Stewart Rogers
Director of
Product Management
Help you understand how to:
• Monitor Learner progress
• Report on Learner activity and engagement within your courses
• Assess “time spent” by your learners and instructors
• Collect and visualize compliance data
• Analyze trends in the effectiveness of your learning programs
OUR OBJECTIVES
5
WHAT IS DATA-DRIVEN ONLINE LEARNING?
“A data-driven approach
used to optimize how your
organization manages and
deploys learning and
development to support
the execution of your
business strategy.”
- Chief Learning Officer, 2015
6
WHAT IS REPORTING?
“the regular provision
of information to
decision-makers
within an organisation
to support them in
their work.”
7
TYPICAL REPORTING CHALLENGES
● Technology
● Data
● Skills
8
What blocks you from being data-driven?
● Technology limitations
● Access to data
● Not a reporting expert
● All of the above
● None of the above
POLL QUESTION #1
9
5 TIPS TO MEASURE LEARNER SUCCESS
1. MONITORING LEARNER PROGRESS
Monitor Learner progress
● Who is or is NOT enrolled?
● What are start, end, and due dates?
● Who is complete or not-complete?
● Measured at all Learning Plan,
Course, Activity
● Measuring date-based progress
11
Identify intervention opportunities
● See people behind before it is too late
● Tracking progress
POLL QUESTION #2
Do you provide a detailed progress report
to Learners?
● Yes and I am satisfied
● Yes but I am NOT satisfied
● No and I want to
● No and I do NOT want to
12
2. COURSE ACTIVITY AND ENGAGEMENT
13
Activity and Engagement
● Number of logins or sessions
● Number of course visits
● Number of resource views
● Forum activity
● Activity submissions
● Completion rates
● Time spent
Identify intervention opportunities
● See trends and correlations
● See what is used and not used
● Compare results with activity
POLL QUESTION #3
Do you provide an option for Learners
compare their engagement / progress /
result with the other Learners?
● Yes
● No, but I would like to
● No, I would not want to
14
3. TIME SPENT LEARNING
Assess “time spent”
● Instructional design purposes
○ Time on course
○ Time in activity
○ Activity completion criteria
● General purposes
○ Course time
○ Activity time
15
Identify intervention opportunities
● are topics difficult to grasp
● are learners actually spending time
● Time-based activity completion
4. ANALYZE LEARNING EFFECTIVENESS
16
Learning Effectiveness Reports
● Feedback Analysis
○ Feedback, Surveys, Questionnaires
● Pre/Post Assessment
○ Quiz Statistics
○ Quiz Questions
○ Grades
● Analyzing trends across courses,
sections, and groups of learners
● Identify trends of success or
opportunities for intervention
across your learning initiatives
Identify intervention opportunities
● what is gained from knowing
● how it can be done
5. VISUALIZING COMPLIANCE DATA
Visualize compliance data
● Completion / Attendance data
● Time Spent
● Certificates issued or expired
● Audit trail reporting
17
Identify intervention opportunities
● automate compliance reporting
● Ease tracking for pro-active alerts
INTRODUCING ZOOLA ANALYTICS
• Access all their data
• Create any report
• Produce business process reports
• Produce learning effectiveness reports
• Produce Big Data reports
• Role-based insights (i.e. learner, teacher, admin views)
• Automate data exports for third-party system
HOW WE HELP TODAY
19
ZoolaTM Analytics is a cloud-based reporting solution that
allows you to transform your LMS data into meaningful
learning insights in minutes.
• Quickly create stunning reports and dashboards
• Embed visualizations directly in your LMS
• Automate delivery to stakeholders with the click of a button
• Get complete and secure access to all your LMS data
• Built for Moodle, Totara and any xAPI Compliant System
ZOOLA ANALYTICS
20
21
QUESTION
What other reports would you like to know
more about?
(Please use the question panel)
22
LAMBDA SOLUTIONS
23
EDUCATION CLIENTS
24
HEALTHCARE AND CORPORATE CLIENTS
25
26
FREE TRIAL
27
• Receive your own Zoola Analytics Demo Site for 30 days,
free!
• Get your hands dirty building charts, reports, and
dashboards
• Test capabilities and features to assess for your own LMS
http://go.lambdasolutions.net/zoola-analytics-30-day-free-trial-offer
FOLLOW UP
28
• Recording & slides to follow
• Resources
• Post-webinar satisfaction survey
CONTACT US
TOLL FREE +1.877.700.1118
EMAIL SALES@LAMBDASOLUTIONS.NET
WWW LAMBDASOLUTIONS.NET

Tips for Driving Learning Success with Moodle LMS Reporting

  • 1.
    STEWART ROGERS Director ProductManagement, Lambda Solutions Tips for Driving Learning Success with Moodle LMS Reporting
  • 2.
    HOUSEKEEPING 2 • Sound andaudio • Poll questions • Q&A at the end • Presentation recording and slides • Post-webinar survey
  • 3.
    AGENDA 3 • Reporting A-Z •5 Tips for Measuring Learner Success in Moodle • Live Zoola Analytics Demonstration
  • 4.
  • 5.
    Help you understandhow to: • Monitor Learner progress • Report on Learner activity and engagement within your courses • Assess “time spent” by your learners and instructors • Collect and visualize compliance data • Analyze trends in the effectiveness of your learning programs OUR OBJECTIVES 5
  • 6.
    WHAT IS DATA-DRIVENONLINE LEARNING? “A data-driven approach used to optimize how your organization manages and deploys learning and development to support the execution of your business strategy.” - Chief Learning Officer, 2015 6
  • 7.
    WHAT IS REPORTING? “theregular provision of information to decision-makers within an organisation to support them in their work.” 7
  • 8.
    TYPICAL REPORTING CHALLENGES ●Technology ● Data ● Skills 8
  • 9.
    What blocks youfrom being data-driven? ● Technology limitations ● Access to data ● Not a reporting expert ● All of the above ● None of the above POLL QUESTION #1 9
  • 10.
    5 TIPS TOMEASURE LEARNER SUCCESS
  • 11.
    1. MONITORING LEARNERPROGRESS Monitor Learner progress ● Who is or is NOT enrolled? ● What are start, end, and due dates? ● Who is complete or not-complete? ● Measured at all Learning Plan, Course, Activity ● Measuring date-based progress 11 Identify intervention opportunities ● See people behind before it is too late ● Tracking progress
  • 12.
    POLL QUESTION #2 Doyou provide a detailed progress report to Learners? ● Yes and I am satisfied ● Yes but I am NOT satisfied ● No and I want to ● No and I do NOT want to 12
  • 13.
    2. COURSE ACTIVITYAND ENGAGEMENT 13 Activity and Engagement ● Number of logins or sessions ● Number of course visits ● Number of resource views ● Forum activity ● Activity submissions ● Completion rates ● Time spent Identify intervention opportunities ● See trends and correlations ● See what is used and not used ● Compare results with activity
  • 14.
    POLL QUESTION #3 Doyou provide an option for Learners compare their engagement / progress / result with the other Learners? ● Yes ● No, but I would like to ● No, I would not want to 14
  • 15.
    3. TIME SPENTLEARNING Assess “time spent” ● Instructional design purposes ○ Time on course ○ Time in activity ○ Activity completion criteria ● General purposes ○ Course time ○ Activity time 15 Identify intervention opportunities ● are topics difficult to grasp ● are learners actually spending time ● Time-based activity completion
  • 16.
    4. ANALYZE LEARNINGEFFECTIVENESS 16 Learning Effectiveness Reports ● Feedback Analysis ○ Feedback, Surveys, Questionnaires ● Pre/Post Assessment ○ Quiz Statistics ○ Quiz Questions ○ Grades ● Analyzing trends across courses, sections, and groups of learners ● Identify trends of success or opportunities for intervention across your learning initiatives Identify intervention opportunities ● what is gained from knowing ● how it can be done
  • 17.
    5. VISUALIZING COMPLIANCEDATA Visualize compliance data ● Completion / Attendance data ● Time Spent ● Certificates issued or expired ● Audit trail reporting 17 Identify intervention opportunities ● automate compliance reporting ● Ease tracking for pro-active alerts
  • 18.
  • 19.
    • Access alltheir data • Create any report • Produce business process reports • Produce learning effectiveness reports • Produce Big Data reports • Role-based insights (i.e. learner, teacher, admin views) • Automate data exports for third-party system HOW WE HELP TODAY 19
  • 20.
    ZoolaTM Analytics isa cloud-based reporting solution that allows you to transform your LMS data into meaningful learning insights in minutes. • Quickly create stunning reports and dashboards • Embed visualizations directly in your LMS • Automate delivery to stakeholders with the click of a button • Get complete and secure access to all your LMS data • Built for Moodle, Totara and any xAPI Compliant System ZOOLA ANALYTICS 20
  • 21.
  • 22.
    QUESTION What other reportswould you like to know more about? (Please use the question panel) 22
  • 23.
  • 24.
  • 25.
  • 26.
  • 27.
    FREE TRIAL 27 • Receiveyour own Zoola Analytics Demo Site for 30 days, free! • Get your hands dirty building charts, reports, and dashboards • Test capabilities and features to assess for your own LMS http://go.lambdasolutions.net/zoola-analytics-30-day-free-trial-offer
  • 28.
    FOLLOW UP 28 • Recording& slides to follow • Resources • Post-webinar satisfaction survey
  • 29.
    CONTACT US TOLL FREE+1.877.700.1118 EMAIL SALES@LAMBDASOLUTIONS.NET WWW LAMBDASOLUTIONS.NET