SlideShare a Scribd company logo
Journal of Educational Psychology and Counseling, volume 2, Jun 2011, Pages 285-304 / ISSN: 2231-735X
Multilevel analysis of achievement in mathematics of
Malaysian and Singaporean students
M. Najib Abd. Ghagar1
, Rohani Othman1
& Ebrahim Mohammadpour1
1
Fakulty Education, Universiti Teknologi Malaysia, 81310 Johor, Malaysia
Abstract: This article explored the variation in mathematics achievement of Malaysian and Singaporean
eighth-graders as a function of student- and school-level differences. The data obtained from 5314
students nested within 150 schools from Malaysia, and 6018 students nested within 164 schools from
Singapore who participated in the Trends in International Mathematics and Science Study (TIMSS) in the
2003. Multilevel linear modeling was employed to analyze the data. The results indicated that 57.28% of
the total variance in mathematics achievement in Malaysia accounted for school-level differences.
Meanwhile, the results showed that classroom-level differences contributed to 74.6% of the total variance
in achievement of Singaporean students. Only 5.9% of the variance in achievement in Sin gapore
accounted for school-level differences. At the student level, mathematics self-concept was the most
influential factor on achievement of students from both countries. At the school level, school climate as
perceived by the school principals was the most influential factor on achievement of students from both
countries.
Keywords: Achievement; Factor; Malaysia; Mathematics; Multilevel; Singapore; TIMSS
1.0 INTRODUCTION
The Trends in International Mathematics and Science Study (TIMSS) is a comparative
study designed in 1995 by The International Association for Evaluation of Educational
Achievement (IEA). TIMSS was designed to assess the quality of the teaching and
learning of mathematics and science among the fourth and eighth-graders across
participating countries.
Malaysia and Singapore are two multi-cultural countries having three major
ethnic groups: Malay, Chinese and Indians. Singapore is a small island that is 470 times
smaller than Malaysia and it is also 6 times smaller than Malaysia in population size. In
terms of per capita income, it is almost 6 times higher than Malaysia (Mullis et al.,
2004). In spite of these differences, there are some similarities between the education
systems. For example, the education system in both countries is centralized. Educational
structures and schooling age in both countries are the same and there is no difference in
mathematics instruction weekly time. Multi-languages is another common
characteristics of the two countries. Even though Malay is the national language of both
countries (Quek Gary et al., 2008), however, the medium of instruction in Singapore is
English (Mullis et al., 2008; Mullis et al.,2008).
Singapore has joined the TIMSS studies since 1995 at both the fourth and
eighth-graders, whereas Malaysia has joined since 1999 only at eighth-graders.
Singapore ranked first in the mathematics achievement at the eighth-graders from
M. Najib, Rohani & Ebrahim / Journal Educational Psychology and Counseling (2011) 286
TIMSS 1995 to 2003 continuously. The achievement of Singaporean in TIMSS 1999
and 2003 was higher than Malaysia by 91 score in average. In contrast, Malaysia with
mean score of 519 in 1999 stood at 16th
place among the 38 participating countries, but
later improved its ranking to 10th
place in 2003 with mean score of 508 among the 45
participating countries. It is worth mentioning that even though the ranking showed
improvement from 1999 to 2003, however, this improvement was not due to the status
promotion in Malaysia, but rather it was due to the decline in overall mathematics
achievements internationally (Mullis et al., 2004; Mullis et al., 2000).
Singapore was a part of Malaysia from the sixteenth to the nineteenth century
until it sought independence from Malaysia in 1965 (Noor Azina Ismail & Halimah
Awang, 2009). As mentioned earlier, despite many similarities between Malaysia and
Singapore, such as the centralization of the educational system, educational structure,
allocated instructional time for mathematics, schooling age, race and ethnic groups,
Malaysian students performed far lower in TIMSS studies as compared to its
counterparts in Singapore. Therefore, the main objective of this study was to explore the
factors behind the differences.
2.0 RESERCH QUATRAINS
This research aimed to answer the following research questions:
1. How much of the total variance in mathematics achievement of Malaysian
students accounted for student and school-level differences?
2. How much of the student-level variance in mathematics achievement of
Malaysian students is associated with mathematics self-concept, attitude
towards mathematics and home educational resources factors?
3. How much of the school-level variance in achievement of Malaysian students is
associated with school climate, school resources, good attendance at school and
the location of the school factors?
4. How much of the total variance in mathematics achievement of Singaporean
students accounted for student, classroom and school-level differences?
5. How much of the student-level variance in mathematics achievement of
Singaporean students is associated with mathematics self-concept, attitude
towards mathematics and home educational resources factors?
6. How much of the classroom-level variance in mathematics achievement of
Singaporean students is associated with school climate as perceived by the
mathematics teachers?
7. How much of the school-level variance in achievement of Malaysian students is
associated with school climate as perceived by the school principals, school
resources, good attendance at school and the location of the school factors?
M. Najib, Rohani & Ebrahim / Journal Educational Psychology and Counseling (2011) 287
3.0 CONCEPTUAL FRAMEWORK
For the past few decades (1960-1990) many researchers and authors had attempted to
find out the answer as to why some students learn better than others and why some
schools are more effective than others. Researcher suggests that the possible answer to
these questions could be found in educational inputs, processes and context (Huitt,
2003). Consequently, different theories and models (Carroll, 1963; Creemers, 1994;
Gage & Berliner, 1992; Huitt, 1995; Proctor, 1984; Shavelosn et al.,1987; Walberg,
1984) were developed and used in studying school effectiveness. In this study, the
following conceptual framework shown in Figure 1 which was adapted from Shavelson
et al. (1987), served as a guide in selecting the factors for this study.
Inputs Processes Outputs
Figure 1: A conceptual model for school effects research
Participation
Teaching
quality
Attitudes,
Aspirations
Achievement
Instructional
quality
Curriculum
quality
Fiscal,
other
resources
Resources
Teacher
quality
Student
background
School
quality
M. Najib, Rohani & Ebrahim / Journal Educational Psychology and Counseling (2011) 288
The model contains three main components: inputs, processes and outputs. The
inputs refer to the human and financial resources available to education. Processes refer
to what is taught and how it is taught. In other words, processes reflect who delivers the
instruction, and how the instruction is organized. Outputs refer to what students
eventually learned.
The inputs factors such as financial and physical resources, policy-related
factors at national, state and school level directly affect the teaching and learning
processes of teacher and school quality, which would directly have an effect on outputs.
Moreover, students’ background at the inputs stage would directly affect teacher
quality, teaching quality and school quality and instructional quality in the processes
stage, which would eventually, effect the students’ achievement at the outputs stage.
School quality in turn, has a direct effect on curriculum quality, teaching quality, and
instructional quality. Finally, instructional quality has a direct effect on school outputs.
This model is a multilevel model and constitutes three distinguishable levels:
student-, classroom- and school-level, and it is deemed appropriate for the analysis of
the TIMSS data. As shown in Figure 1, there are many factors which have either a
direct or an indirect influence on students’ achievement. To consider all of these
existing factors in one study was not possible, therefore, based on the model and
research evidences only a few factors from student, classroom and school-level were
selected to assess their effects on mathematics achievement.
4.0 LITERATURE REVIEW
Learning and teaching process takes place in the classroom, which in turn is situated in
school (Leung et al.,2006; Mullis et al., 2005; Oakes, 1989). School environment
consists of various elements, ranging from the desk where students sit; to the student
who sits next to him/her; and includes the teacher who stands in front of his/her
classroom (Coleman et al., 1966; Creemers, 1994).
Several studies have been conducted to answer the question of how much of the
variance in mathematic achievement contributes to school-level differences. The results
indicate that the proportion of the variance accounted by school-level differences vary
across countries. Park and Park (2006) found that in South Korean about 4% of the total
variance of mathematics achievement contributed to school-level factors. In contrast, it
was 55% for South African students (Howie, 2006). Similarly, Fullarton (2004)
reported that 27% and 47% of the variance of mathematics achievement of Australian
students accounted for school-level factors in TIMSS 1995 and 1999, respectively. In
Singapore 45%, Botswana, 27%, Chili, 35% and Flenders, 14% of the variance of
mathematics achievement accounted for school-level factors (Chepete, 2008;
Mohammadpour et al., 2009; Ramírez, 2006; Van den Broeck et al.,2006). Once
the researchers had decomposed the total variance of mathematics achievement into
student and school-level, they attempted to explain the proportion of the variance at
each level by using relevant factors. Thus, some factors such as mathematics self-
M. Najib, Rohani & Ebrahim / Journal Educational Psychology and Counseling (2011) 289
concept (Kiamanesh, 2004a, 2004b; Ma & Kishor, 1997; Mullis et al., 1997; Mullis et
al., 2000; Papanastasiou, 2008; Reyes, 1984; Wilkins, 2004), attitude towards
mathematics (Cooper et al., 2001; Goodykoontz, 2008; Kiamanesh, 2006; Ma & Kishor,
1997), home educational resources (Bos & Kuiper, 1999; Coleman et al., 1966;
Fullarton, 2004; Howie, 2003; Jencks et al., 1972; Kiamanesh & Mahdavi, 2008) were
examined nationally and internationally and the results indicated that there is a positive
association between students’ achievemnt with mathematics self-concept and attitude
towards mathematics.
In addition, a number of school and classroom-level factors such as the location
of the school (Chepete, 2008; Howie, 2006; Ramírez, 2006), school climate (Bevans et
al., 2007; Cohen et al.,2009; Mullis et al., 2008; Mullis et al., 2004; Papanastasiou &
Papanastasiou, 2006), and school resources for mathematics instruction (Ramírez, 2006)
were explored to assess the effects of these factors on achievement and it was found that
there is a positive relationship between achievement with the location of the school and
school climate.
4.0 METHODOLOGY
Sample
TIMSS used a two-stage stratified cluster sampling design. Schools were sampled using
a systematic probability-proportional-to-size (PPS), and then one or two classrooms per
school were selected (Martin, Mullis, & Chrostowski, 2004). In Malaysia, only one
intact classroom was selected among all eighth-graders classrooms within the selected
schools. The number of students within a classroom ranged from 19 to 49 with 35
students per classroom on average. All together, the samples from Malaysia were 5314
students, 150 mathematics teachers and 150 school principals participated in TIMSS
2003 study. Singapore added a third sampling stage to the TIMSS’s basic two stage and
students were selected at random from two classrooms within each selected school. The
minimum number of students per classroom was 8 and the maximum was 23 with an
average of 18 students per classroom. Thus, a total of 6018 students, 320 mathematics
teachers and 160 school principals who participated in TIMSS 2003 were used as
samples in Singapore.
Variables
Dependent or predicted variable
TIMSS used a test to measure students’ mathematics achievement. Four different types
of scores were obtained from the test for individual students: raw scores, standardized
scores, national Rasch scores and plausible values or multiple imputation scores (Foy &
Olson, 2009). In order to extend the coverage of mathematics curriculum and measuring
M. Najib, Rohani & Ebrahim / Journal Educational Psychology and Counseling (2011) 290
the trends across TIMSS studies, the TIMSS centre used a large number of mathematics
items (190 items). Since the implementation of all 190 items on individual student was
not possible, a matrix-sampling design was used to assemble the items into different
booklets. Each student sat for a test using only one booklet which included a subtest of
all the possible items. TIMSS used Item Response Theory (IRT) scaling to describe
students’ achievement in the test (Olson et al., 2008). The raw scores were computed
based on student’s score to the individual items in the booklet. Since students had to
answer different items, their difficulty index is not comparable among the students and
the raw scores are not reliable for comparison purposes. The raw scores were
standardized to a score with a mean of 50 and a standard deviation of 10 within each
country. Because of the reasons mentioned above, comparison among students based on
standardized scores is still not reliable enough. The national Rasch scores were
standardized to have a mean of 150 and a standard deviation of 10 within each country.
Finally, the plausible values are an estimate of how a student might have performed if
all 190 items were administered to the student. TIMSS estimated five plausible values
for individual students based on their responses to a subtest of the items. The plausible
values for any given scale are the best available measures of students’ achievement on
that scale in TIMSS database (Foy & Olson, 2009). Thus, the average of the five
plausible values was obtained, and it served as the dependent or predicted variable in
this study.
Independent or predictors variables
Mathematics self-concept, attitude towards mathematics and home educational
resources are the three student-level factors derived from the Students’ Questionnaire.
School climate as perceived by the mathematics teachers is a classroom-level factor
gained from the Mathematics Teachers Questionnaire. In addition, school climate as
perceived by school principals, availability of school resources for mathematics
instruction, good attendance at school and the location of the school are the school-level
factors obtained from the School Questionnaire. The full characteristics of these factors
including items, scale, coding and amount of missing values in each item are presented
in Appendix B.
Data Consideration
Normal distribution
The HLM computer package (Raudenbush et al., 2004) produces residual files that
could be used to check the distributional assumptions of the data before running the
final model. In this study, a probability plot (Q-Q) was used to check the assumption of
a normal distribution of the dependent variable. Appendix C displays Q-Q plots for
residual errors of students’ mathematics achievement of both countries. The plots are
M. Najib, Rohani & Ebrahim / Journal Educational Psychology and Counseling (2011) 291
approximately linear. This indicates that there is no serious departure from the normal
distributions.
Missing data
Missing data are ubiquitous in social and behavioral sciences research due to a variety
of reasons (Allison, 2002; Cool, 2000; Dow & Eff, 2009; Enders, 2010; Longford,
2008; Tabachnik & Fidell, 2007) and the TIMSS data are not an exception of missing
values. A serious question with regard to missing data is whether missing data is a
function of a random or a systematic process (Meyers et al., 2006). If the data are
missing completely at random, then deleting cases with missing values does not bias the
estimates (Gelman & Hill, 2007), but such strong assumption is rarely satisfied. In these
situations, missing values should be modeled to get good estimates of parameters of
interest (Allison, 2002; Gelman & Hill, 2007). The next important question concerning
missing data is how much data are missing. Tabachnik and Fidell (2007) suggested that
if only a few data (i.e., 5% or less) are missing in random from a large data, the
problems are less serious and almost any procedure for handling missing values yields
similar results. As shown in Appendix B, the amount of missing values in all the items
are far less than the size suggested by Tabachnik and Fidell (2007). Missing data is
more complicated in multilevel structured data, because it may occur at more than one
level. In the case of two-level multilevel modeling, for example, if a level-2 unit (e.g.,
school) has missing data and then excluded from the analysis, thus, all the observations
(e.g., students) that are nested within that unit will be excluded from the analysis
(Gibson & Olejnik, 2003). There are only a small amount of missing values in the data
being analyzed (Appendix B) and the sample sizes at all the levels of analysis are
relatively large (Hox, 2009). However, instead of deleting cases or variables with
missing values, the expectation maximization (EM) which is one imputation methods of
treating missing data was used to deal with missing values (for detail about imputation
methods of missing values see for example; Enders, 2010; Little & Rubin, 2002; Peugh
& Enders, 2004; Roth et al., 1999; Rubin et al., 2007).
Weighting issue
As mentioned earlier, TIMSS used a two-stage cluster sampling design rather than a
simple random sampling. The probability of selection of sample units at both stages is
unequal and sampling weight issue must take into consideration to avoid bias in
parameters estimates (Asparouhov, 2005; Dargatz & Hill, 1996; Rabe-Hesketh &
Skrondal, 2006; Rutkowski et al., 2010; Thomas & Heck, 2001; Willms & Smith,
2005). TIMSS computes several weighting variables (e.g., TOTWGT, total student
weight, SENWGT, student senate weight, MATWGT, mathematics teacher weight).
According to Rutkowski et al. (2010), if the data involved in a study is taken from more
than one country, student senate weight (SENWGT) should be used. Thus, SENWGT,
M. Najib, Rohani & Ebrahim / Journal Educational Psychology and Counseling (2011) 292
mathematics teacher’s weight (MATWGT) and total school weight (SCHWGT) was
used at student classroom and school-level, respectively.
Centering issue
Centering or scaling of independent factors in multilevel analysis refers to subtracting a
mean from all individual raw scores on any independent variable and change the raw
metric into deviance from the mean score (Tabachnik & Fidell, 2007; Wu &
Wooldridge, 2005). According to Kreeft and de Leeuw (1998) the practical purpose of
centering an independent variable, is to change the interpretation of the intercept. In
multilevel modeling (regression analysis generally), the intercept is defined as the
expected score on the dependent variable for someone whose scores on all independent
variables in the model are zero (Raudenbush & Bryk, 2002). In social sciences, usually
variables have no meaningful zero (Kreeft & de Leeuw, 1998), in such situations, by
transferring the independent variables, the intercept will be interpreted as expected score
on the dependent variable for someone whose scores on independent variables equal to
the group mean or grand mean depending on the type of centering approaches that is
used.
The HLM program (Raudenbush et al.,2004) for analysis of multilevel data
provides three options to deal with centering of level-l variable. They are (a) raw metric
(uncentered) variable (b) group mean centered and (c) grand mean centered variable.
Grand mean centering is the most common method used in multilevel modeling (Enders
& Tofighi, 2007; Hox, 2002). Grand mean reduces the multicollinearity among
predictors (Hofmann & Gavin, 1998; Kreft, de Leeuw, & Aiken, 1995; Tabachnik &
Fidell, 2007). Thus, grand mean centering was used for all the predictor factors in this
study.
Data Analysis
The general idea of multilevel modeling is individuals (e.g., students) interact with the
contexts (e.g., classroom or school) that they belong to. Students’ characteristics are
influenced by classroom or school, and the classroom or school in turn influence
students’ performance. Students and the schools that they belong to are generally
conceptualized as hierarchical or multilevel system in which the individuals and the
context make up the separate levels of this hierarchy system (Hox, 2002). The TIMSS
data have a nested or multilevel structured in which students are nested within
classrooms and classrooms in turn nested within schools. It is worth mentioning that
however, TIMSS data in nature make three levels (student, classroom and school),
because only one classroom per school was sampled in Malaysia, it is not possible to
assess the effects of different classrooms within schools. Whereas, individual student
was sampled at random from two classrooms within each selected school in Singapore
and it provided the possibility of comparing students’ mathematics achievement across
M. Najib, Rohani & Ebrahim / Journal Educational Psychology and Counseling (2011) 293
classrooms within schools. Thus, a two and three-level multilevel modeling approach
was employed for analyzing the data from Malaysia and Singapore, respectively using
HLM6.07 (Raudenbush et al., 2004).
5.0 RESULTS
The results are presented based on research questions for each country separately.
Malaysia
Research question 1: How much of the total variance in mathematics achievement of
Malaysian students accounted for student and school-level differences?
The unconditional or null model was estimated to provide the answer for this research
question. This model gives a statistical index which is so-called “intraclass correlation
coefficient” (ICC). It is defined as the proportion of the total variance of the dependent
variable that attribute to the higher level of the model which is school in the present
study (Browne & Rasbash, 2004; Field, 2009; Heck & Thomas, 2000; Raudenbush &
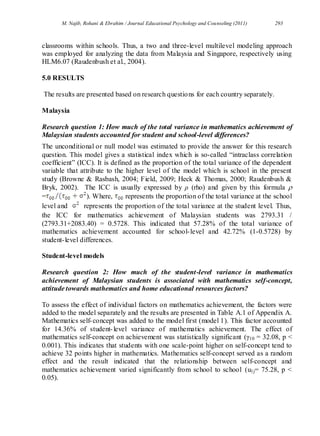
Bryk, 2002). The ICC is usually expressed by ρ (rho) and given by this formula 
= ). Where, represents the proportion of the total variance at the school
level and represents the proportion of the total variance at the student level. Thus,
the ICC for mathematics achievement of Malaysian students was 2793.31 /
(2793.31+2083.40) = 0.5728. This indicated that 57.28% of the total variance of
mathematics achievement accounted for school-level and 42.72% (1-0.5728) by
student-level differences.
Student-level models
Research question 2: How much of the student-level variance in mathematics
achievement of Malaysian students is associated with mathematics self-concept,
attitude towards mathematics and home educational resources factors?
To assess the effect of individual factors on mathematics achievement, the factors were
added to the model separately and the results are presented in Table A.1 of Appendix A.
Mathematics self-concept was added to the model first (model 1). This factor accounted
for 14.36% of student-level variance of mathematics achievement. The effect of
mathematics self-concept on achievement was statistically significant (γ10 = 32.08, p <
0.001). This indicates that students with one scale-point higher on self-concept tend to
achieve 32 points higher in mathematics. Mathematics self-concept served as a random
effect and the result indicated that the relationship between self-concept and
mathematics achievement varied significantly from school to school (u1j= 75.28, p <
0.05).
M. Najib, Rohani & Ebrahim / Journal Educational Psychology and Counseling (2011) 294
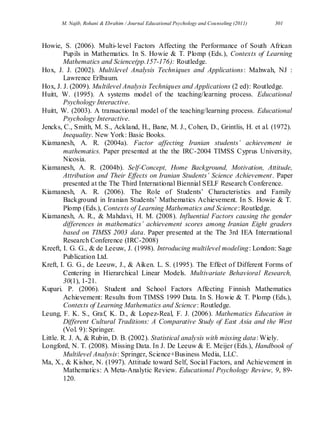
Attitude towards mathematics was the second factor that entered to the model
(model 2). Attitude accounted for a negligible amount of the variance (0.69) when the
effect of mathematics self-concept was controlled. The effect of attitude was statistically
significant (γ20 = 6.72, p < 0.001). One scale-point increase in positive attitude towards
mathematics increases achievement by 6.72 points. The relationship between attitude
towards mathematics and achievement varied significantly from school to school (u2j=
47.86, p < 0.05).
An index of home educational resources was the last factor that added to the
model (model 3). Model 3 accounted for only a small proportion of the variance (0.002)
controlling for mathematics self-concept and attitude towards mathematics. The effect
of home educational resources was not statistically significant (γ30 = 3.70, p > 0.05).
School-level models
Research question 3: How much of the school-level variance in achievement of
Malaysian students is associated with school climate, school resources, good
attendance at school and the location of the school factors?
The location of the school was the first factor added to the model (model 4). The
contribution of this factor to the school-level variance was 5%. The effect of the
location of the school was statistically significant (γ01= 25.19, p < 0.05). This indicated
that students from urban schools achieved higher scores in mathematics than their peers
from rural schools by 25.19 points.
School climate as perceived by the school principals was the second factor that
added to the model (model 5). This model accounted for 4.77% of the school-level
variance after controlling for the location of the school. Mathematics achievement
affected significantly by this factor (γ02= 19.97, p < 0.05). Average mathematics
achievement was higher by 19.97 points in schools where the principals described the
climate of the school positively. School climate as perceived by the mathematics
teachers was also a significant factor on achievement (model 6). It accounted for 5% of
the school-level variance controlling for the location of the school and school climate as
perceived by the school principals. The effect of this factor on mathematics
achievement was statistically significant (γ03 = 21.47, p < 0.05). Average mathematics
achievement was higher by 21.47 points in schools where the mathematics teachers
described the climate of the school positively.
School resources for mathematics instruction and good attendance at school
were the last two factors that added to model 7 and 8, respectively. The school resources
factor accounted for 3.78% of the school-level variance after controlling for the location
of the school and school climate as perceived by both the school principals and
mathematics teachers. The association between this factor and mathematics
achievement was significantly negative (γ04 = -13.92, p < 0.05). Average mathematics
achievement decreased by 13.92 points in schools with one scale-point more shortage in
resources for mathematics instruction.
M. Najib, Rohani & Ebrahim / Journal Educational Psychology and Counseling (2011) 295
Good attendance at school explained 1.21% of the school-level variance of
mathematics achievement after controlling the factors location of the school, school
climate as perceived by both the school principals and mathematics teachers and school
resources. The association between these factor with mathematics achievement was also
negative, but it was not statistically significant (γ05= -18.49, p > 0.05).
In order to assess the effects of student and school-level factors on achievement
simultaneously, all the factors were added to the model (full model). The full model
accounted for 14% of the student-level variance and 25% of the school-level variance in
achievement.
Singapore
Research question 4: How much of the total variance in mathematics achievement of
Singaporean students accounted for student, classroom and school-level differences?
The unconditional model was estimated to provide answer for this research question
(Appendix A, Table A.2, null model). The ICC at each level is:
For the student level, / ( ) = 1165.67/ (1165.67+4496.51+358.13) =
0.193
For the classroom level, / ( ) = 4496.51/ (1165.67+4496.51+358.13) =
0.746
For the school level, / ( ) = 358.13/ (1165.67+4496.51+358.13) = 0.059.
The results indicated that 19.3%, 74.6% and 5.9% of the total variance in
mathematics achievement of Singaporean eighth-graders accounted for student,
classroom and school-level differences, respectively.
Student-level models
Research question 5: How much of the student-level variance in mathematics
achievement of Singaporean students is associated with mathematics self-concept,
attitude towards mathematics and home educational resources factors?
Three models were estimated to answer this research question and the results are given
in Appendix A, Table A.2.
Again, mathematics self-concept was the first factor that was entered to the
model as a random effect (model 1). It accounted for 22.77% of the total student-level
variance. Mathematics self-concept affected achievement significantly (γ100= 24.23, p <
0.001). The relationship between self-concept and mathematics achievement varied
significantly from classroom to classroom within schools (u00k = 28.41, p < 0.05), but it
was not from school to school (u10k = 3.95, p > 0.05).
M. Najib, Rohani & Ebrahim / Journal Educational Psychology and Counseling (2011) 296
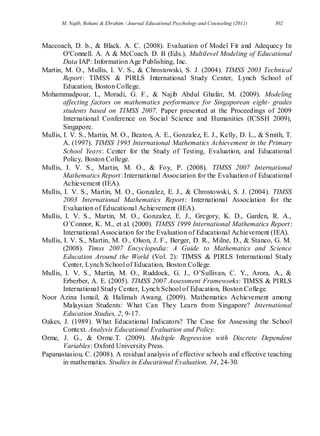
Attitude towards mathematics was added to the second model (model 2).
Attitude accounted for 5.33% of the student-level variance controlling for mathematics
self-concept. The association between attitude towards mathematics and achievement
was statistically significant (γ200= 10.87, p < 0.001).
Home educational resources factor was introduced to the model (model 3).
Model 3 accounted for a negligible amount (0.33) of the student-level variance when
mathematics self-concept and attitude towards mathematics were controlled. The effect
of home educational resources on achievement was statistically significant (γ300 = 11.01,
p < 0.001).
Classroom-level model
Research question 6: How much of the classroom-level variance in mathematics
achievement of Singaporean students is associated with school climate as perceived
by the mathematics teachers?
Model 4 was estimated with school climate as perceived by the mathematics teachers.
This model accounted for 3.50% of the total classroom-level variance of mathematics
achievement. The effect of this factor on achievement was statistically significant (γ010=
20.49, p < 0.05). This indicated that, on average, mathematics achievement in
classrooms where teachers described the climate of the school positively; was higher by
20.49 points than other classrooms.
School-level models
Research question 7: How much of the school-level variance in mathematics
achievement of Singaporean students is associated with school climate as perceived
by the school principals, school resources for mathematics instruction and good
attendance at school factors?
School climate as perceived by the school principals was the first factor that was added
to the model (model 5). This factor contributed to a substantial (54.53%) proportion of
the school-level variance in mathematics achievement. The effect of school climate as
perceived by the school principals on achievement was statistically significant (γ001=
29.70, p < 0.001).
Model 6 was estimated by adding school resources for mathematics instruction.
Model 6 accounted for 17.30% of the school-level variance after controlling for school
climate as perceived by the school principals. However, the effect of school resources
on achievement was not significant (γ002= -13.54, p > 0.05). Model 7 was estimated by
adding the factor of good attendance at school; it explained 3.42% of the school-level
variance after controlling for school climate as perceived by the school principals and
M. Najib, Rohani & Ebrahim / Journal Educational Psychology and Counseling (2011) 297
school resources for mathematics instruction. The effect of good attendance at school
also was not statistically significant (γ003= -4.33, p > 0.05).
A full model was estimated by adding all the factors from the three levels. The
full model was accounted for 27.13%, 15.62% and 35.36% of the variances at student,
classroom and school-level, respectively.
6.0 DISCUSSION
The results indicated that 57.28% of the total variance in mathematics achievement of
Malaysian eighth-graders accounted for school-level differences. Likewise, a greater
proportion of the variance in mathematics achievement in the Singapore sample was
attributed to classroom and school-level differences (74.6% to classroom level and 5.9%
to school-level). This is one the key results of the study and it indicated that schools
make a difference in students’ achievement in both countries. An interesting finding of
this study is not only that mathematics achievement of Singaporean students differed
from school to school, but it also differed substantially from a classroom to another
within a school. It is more important for Singaporean students to be placed in a
particular classroom within a school rather than being assigned to a school they are
placed in. According to Anderson (1991), school effectiveness depends to a great extent
on teacher effectiveness. Teachers have absolute veto power over innovation and
change even in the most highly centralized educational system. Therefore, what happens
in classrooms could be accounted for this great difference in students’ achievement.
School effects on students’ academic achievement have been subjected to a
considerable debate among educational researchers for a long time. Early studies, for
example, Coleman et al. (1966) and Jencks et al.(1972) on school effectiveness revealed
that the effects of school on students’ academic achievement is relatively small
compared to the effects of students characteristics and family background. Following
Coleman et al.’s (1966) report, several studies Chepete (2008), Fullarton (2004), Howie
(2006) and Park and Park (2006) for example, have been done to assess the effects of
school on mathematics achievement of students. It was found that a sizeable proportion
of the total variance in mathematics achievement attributed to school-level differences.
The proportion of the variance that attributed to school-level differences in this study is
beyond the range found in recent studies. The findings of this study added evidence to
those from previous studies that schools make a difference in students’ academic
achievement. This findings have key implications for educational policy-makers,
because, school has control over most of the classroom and school-level factors such as
those examined in this study. On the other hand, student-level factors (e.g., home
educational resources and other family background factors) are not under the control of
school.
Mathematics self-concept, attitude towards mathematics and home educational
resources altogether accounted for 15.32% of the total variance in mathematics
achievement of the Malaysians at the student level. In contrast, these three factors
M. Najib, Rohani & Ebrahim / Journal Educational Psychology and Counseling (2011) 298
accounted for 28.43% of the total variance in mathematics achievement of the
Singaporean students at the student-level. This indicated that these factors are more
effective on achievement of Singaporean students than for the Malaysians. Mathematics
self-concept among other student-level factors was the most influential factor on
achievement of students from both countries. This confirms the findings by Howie
(2003), Kiamanesh, (2004b; 2005), Ma and Kishor (1997), Papanastasiou (2008),
Wilkins (2004). The effect of mathematics self-concept on achievement differed for the
Malaysians and Singaporeans. Mathematics self-concept was more effective for the
Singaporeans in terms of the explained variance, but the association between this
mathematics self-concept and achievement was stronger for the Malaysians.
Attitude towards mathematics was the second strongest factor that affected
achievement of Malaysian students positively, whereas it was the third strongest factor
in the Singaporeans achievement. Attitude towards mathematics was more effective
factor on achievement of Singaporean students than the Malaysians. Home educational
resources had no significant effect on achievement of Malaysia students as it did for the
Singaporeans, although the contribution of this factor to the variance in achievement of
Singaporean students was very low. This is an interesting finding especially for
Malaysian students. Because generally, Singaporeans have an advantage of having
home educational resources more than Malaysian, but the contribution of home
educational resources was negligible to the variance of mathematics achievement of the
Singaporeans. The five factors of the location of the school, school climate (both
perceived by the mathematics teachers and the school principals), school resources for
mathematics instruction and good attendance at school accounted for 19.76% of the
total variance of Malaysian students at school-level. On the other hand, the three factors
of school climate as perceived by the school principals, school resources and good
attendance at school explained 75.25% of the total variance at school-level.
The location of the school had a great effect on mathematics achievement of
Malaysian students where students from urban schools performed much better than
those from rural schools. This result is consistent with Howie’s (2006) findings. This
result was expected because rural students are more disadvantaged than urban students
in terms of family background and having access to limited educational resources.
Singapore is an urban based country, thus the location of the school was not a factor in
Singapore.
School climate as perceived by school principals was the most influential factor
for both countries. However, this factor accounted for a substantial proportion of the
variance in achievement of Singaporean students than the Malaysians. School resources
for mathematics instruction had no significant effect for the Singaporeans whereas, it
did for Malaysians. One possible explanation for this finding is probably that all
Singaporean schools are well equipped with instructional resources such as computer,
audio-visual resources and library materials. In contrast, Malaysian schools are different
to some extent in terms of the availability of resources for mathematics instruction.
M. Najib, Rohani & Ebrahim / Journal Educational Psychology and Counseling (2011) 299
6.0 CONCLUSION
The results of this study revealed that mathematics achievement of Malaysia eighth-
graders is motivated mainly by differences from school to school. Mathematics
achievement of Singaporean eighth-graders is motivated mainly by differences from
classroom to classroom within school. Mathematics self-concept among other student-
level factors was the most influential factor on achievement of students from both
countries. The location of school among other school-level factors was the most
influential factor on achievement of Malaysian students. This was followed by school
climate as perceived by the school principals. For the Singaporeans, school climate as
perceived by the school principals among other school-level factors was the most
influential factor. Shortage of school resources for mathematics instruction affected
mathematics achievement of Malaysian students negatively, whereas it was a significant
factor for the Singaporeans.
REFERENCES
Allison, P. D. (2002). Missing data, series: quantitative applications in the social
sciences: Sage, Publication.Inc.
Anderson, L. W. (1991). Increasing teacher effectiveness. Paris: UNESCO.
Asparouhov. T. (2005). Sampling Weights in Latent Variable Modeling. Structural
Equation Modeling, 12(3), 411–434.
Bevans, K., Bradshaw, C. P., Miech, R., & Leaf, P. J. (2007). Staff- and School-Level
Predictors of School Organizational Health: A Multilevel Analysis. Journal of
School Health, 77, 294 - 302.
Bos, K., & Kuiper, W. (1999). Modelling TIMSS Data in a European Comparative
Perspective: Exploring Influencing Factors on Achievement in Mathematics in
Grade 8. Educational Research and Evaluation, 55.
Browne, W. J., & Rasbash, J. (2004). Multilevel Modelling. In M. A. Hardy & A.
Bryman (Eds.), Handbook of data analysis. London: Thousand Oaks: Sage.
Carroll, J. B. (1963). A model for school learning. Teacher College Record, 64, 723-
733.
Chepete, P. (2008). Modeling of the Factors Affecting Mathematical Achievement of
Form 1 Students in Botswana based on the 2003 Trends in International
Mathematics and Science Study. Unpublished Doctor of Philosophy, Indiana
University.
Cohen, J., McCabe, L., Michelli, N. M., & Pickeral, T. (2009). School Climate:
Research, Policy, Practice, and Teacher Education. Teachers College Record,
111, 180-213.
Coleman, J. S., Compbell, E. Q., Hobson, C. J., Mcpartland, J., Mood, A. M., Weinfeld,
F. D., et al. (1966). Equality Of Educational Opportunity. Washington DC:
Department of Helth, Education & Welfare Office of Education.
M. Najib, Rohani & Ebrahim / Journal Educational Psychology and Counseling (2011) 300
Cool, A. L. (2000). A Review of Methods for Dealing with Missing Data. Paper
presented at the Paper presented at the annual meeting of the Southwest
Educational Research Association, Dallas
Cooper, H., Jackson, K., Nye, B., & Lindsay, J. J. (2001). A model of homework’s
influence on the performance evaluations of elementary students. The Journal of
Experimental Education, 69(2), 181–191.
Creemers, B. P. M. (1994). The effective classroom. London: Cassell.
Dargatz, D. A., & Hill, G. W. (1996). Analysis of survey data. Preventive Veterinary
Medicine, 28, 225-237.
Dow, M. M., & Eff, E. A. (2009). Multiple Imputation of Missing Data in Cross-
Cultural Samples. Cross-Cultural Research, 43(3), 206-229.
Enders, C. K. (2010). Applied Missing Data Analysis: The Guilford Press.
Enders, C. K., & Tofighi. D. (2007). Centering Predictor Variables in Cross-Sectional
Multilevel Models: A New Look at an Old Issue. Psychological Methods, 12(2),
121–138.
Field, A. (2009). Discovering statistics using SPSS (3rd ed.). London SAGE
Publications.
Foy, P., & Olson, J. F. (2009). TIMSS 2007 User Guide for the International Database
Fullarton, S. (2004). Closing the gaps betweeen schools, accounting for variation in
mathematics achievement in Australian schools using TIMSS 95 and TIMSS
1999. Paper presented at the The 1st IEA International Research Conference,
IRC-2004
Gage, N., & Berliner, D. (1992). Educational psychology (5th ed ed.): Princeton, New
Jersey: Houghton Mifflin Company.
Gelman, A., & Hill, J. (2007). Data Analysis Using Regression and
Multilevel/Hierarchical Models. New York: Cambridge University Press.
Gibson, N. M., & Olejnik, S. (2003). Treatment of missing data at the second level of
hierarchical linear models. Educational and Psychological Measurement., 63.,
204.
Goodykoontz, E. N. (2008). Factors that Affect College Students’ Attitude toward
Mathematics. Unpublished PhD, Morgantown, West Virginia.
Heck, R. H., & Thomas, S. L. (2000). An Introduction to Multilevel Modeling
Techniques Quantitative Methodology Series: Lawrence Erlbaum Associates,
Inc.
Hofmann, D. A., & Gavin, M. B. (1998). Centering Decisions in Hierarchical Linear
Models: Implications for Research in Organizations. Journal of Management,
24, No. 5, 623-641.
Howie, S. (2003). Language and other background factors affecting secondary pupils'
performance in Mathematics in South Africa. African Journal of Research in
SMT Education, 7, 1-20.
M. Najib, Rohani & Ebrahim / Journal Educational Psychology and Counseling (2011) 301
Howie, S. (2006). Multi-level Factors Affecting the Performance of South African
Pupils in Mathematics. In S. Howie & T. Plomp (Eds.), Contexts of Learning
Mathematics and Science(pp.157-176): Routledge.
Hox, J. J. (2002). Multilevel Analysis Techniques and Applications: Mahwah, NJ :
Lawrence Erlbaum.
Hox, J. J. (2009). Multilevel Analysis Techniques and Applications (2 ed): Routledge.
Huitt, W. (1995). A systems model of the teaching/learning process. Educational
Psychology Interactive.
Huitt, W. (2003). A transactional model of the teaching/learning process. Educational
Psychology Interactive.
Jencks, C., Smith, M. S., Ackland, H., Bane, M. J., Cohen, D., Grintlis, H. et al. (1972).
Inequality. New York: Basic Books.
Kiamanesh, A. R. (2004a). Factor affecting Iranian students’ achievement in
mathematics. Paper presented at the the IRC-2004 TIMSS Cyprus University,
Nicosia.
Kiamanesh, A. R. (2004b). Self-Concept, Home Background, Motivation, Attitude,
Attribution and Their Effects on Iranian Students’ Science Achievement. Paper
presented at the The Third International Biennial SELF Research Conference.
Kiamanesh, A. R. (2006). The Role of Students’ Characteristics and Family
Background in Iranian Students’ Mathematics Achievement. In S. Howie & T.
Plomp (Eds.), Contexts of Learning Mathematics and Science: Routledge.
Kiamanesh, A. R., & Mahdavi, H. M. (2008). Influential Factors causing the gender
differences in mathematics’ achievement scores among Iranian Eight graders
based on TIMSS 2003 data. Paper presented at the The 3rd IEA International
Research Conference (IRC-2008)
Kreeft, I. G. G., & de Leeuw, J. (1998). Introducing multilevel modeling: London: Sage
Publication Ltd.
Kreft, I. G. G., de Leeuw, J., & Aiken. L. S. (1995). The Effect of Different Forms of
Centering in Hierarchical Linear Models. Multivariate Behavioral Research,
30(1), 1-21.
Kupari. P. (2006). Student and School Factors Affecting Finnish Mathematics
Achievement: Results from TIMSS 1999 Data. In S. Howie & T. Plomp (Eds.),
Contexts of Learning Mathematics and Science: Routledge.
Leung, F. K. S., Graf, K. D., & Lopez-Real, F. J. (2006). Mathematics Education in
Different Cultural Traditions: A Comparative Study of East Asia and the West
(Vol. 9): Springer.
Little. R. J. A, & Rubin, D. B. (2002). Statistical analysis with missing data: Wiely.
Longford, N. T. (2008). Missing Data. In J. De Leeuw & E. Meijer (Eds.), Handbook of
Multilevel Analysis: Springer, Science+Business Media, LLC.
Ma, X., & Kishor, N. (1997). Attitude toward Self, Social Factors, and Achievement in
Mathematics: A Meta-Analytic Review. Educational Psychology Review, 9, 89-
120.
M. Najib, Rohani & Ebrahim / Journal Educational Psychology and Counseling (2011) 302
Maccoach, D. b., & Black. A. C. (2008). Evaluation of Model Fit and Adequecy In
O'Connell. A. A & McCoach. D. B (Eds.), Multilevel Modeling of Educational
Data IAP: Information Age Publishing, Inc.
Martin, M. O., Mullis, I. V. S., & Chrostowski, S. J. (2004). TIMSS 2003 Technical
Report: TIMSS & PIRLS International Study Center, Lynch School of
Education, Boston College.
Mohammadpour, I., Moradi, G. F., & Najib Abdul Ghafar, M. (2009). Modeling
affecting factors on mathematics performance for Singaporean eight- grades
students based on TIMSS 2007. Paper presented at the Proceedings of 2009
International Conference on Social Science and Humanities (ICSSH 2009),
Singapore.
Mullis, I. V. S., Martin, M. O., Beaton, A. E., Gonzalez, E. J., Kelly, D. L., & Smith, T.
A. (1997). TIMSS 1995 International Mathematics Achievement in the Primary
School Years: Center for the Study of Testing, Evaluation, and Educational
Policy, Boston College.
Mullis, I. V. S., Martin, M. O., & Foy, P. (2008). TIMSS 2007 International
Mathematics Report: International Association for the Evaluation of Educational
Achievement (IEA).
Mullis, I. V. S., Martin, M. O., Gonzalez, E. J., & Chrostowski, S. J. (2004). TIMSS
2003 International Mathematics Report: International Association for the
Evaluation of Educational Achievement (IEA).
Mullis, I. V. S., Martin, M. O., Gonzalez, E. J., Gregory, K. D., Garden, R. A.,
O’Connor, K. M., et al. (2000). TIMSS 1999 International Mathematics Report:
International Association for the Evaluation of Educational Achievement (IEA).
Mullis, I. V. S., Martin, M. O., Olson, J. F., Berger, D. R., Milne, D., & Stanco, G. M.
(2008). Timss 2007 Encyclopedia: A Guide to Mathematics and Science
Education Around the World (Vol. 2): TIMSS & PIRLS International Study
Center, Lynch School of Education, Boston College.
Mullis, I. V. S., Martin, M. O., Ruddock, G. J., O’Sullivan, C. Y., Arora, A., &
Erberber, A. E. (2005). TIMSS 2007 Assessment Frameworks: TIMSS & PIRLS
International Study Center, Lynch School of Education, Boston College.
Noor Azina Ismail, & Halimah Awang. (2009). Mathematics Achievement among
Malaysian Students: What Can They Learn from Singapore? International
Education Studies, 2, 9-17.
Oakes, J. (1989). What Educational Indicators? The Case for Assessing the School
Context. Analysis Educational Evaluation and Policy.
Orme, J. G., & Orme.T. (2009). Multiple Regression with Discrete Dependent
Variables: Oxford University Press.
Papanastasiou, C. (2008). A residual analysis of effective schools and effective teaching
in mathematics. Studies in Educational Evaluation, 34, 24-30.
M. Najib, Rohani & Ebrahim / Journal Educational Psychology and Counseling (2011) 303
Papanastasiou, C., & Papanastasiou, E. C. (2006). Modeling Mathematics Achievement
in Cyprus. In S. Howie & T. Plomp (Eds.), Contexts of Learning Mathematics
and Science: Routledge.
Park.C, & Park. D. (2006). Factors Affecting Korean Students’ Achievement in TIMSS
1999. In S. Howie & T. Plomp (Eds.), Contexts of Learning Mathematics and
Science: Routledge.
Peugh, J. L., & Enders, C. K. (2004). Missing Data in Educational Research: A Review
of Reporting Practices and Suggestions for Improvement. Review of Educational
Research, 74(4) 525–556.
Proctor, C. P. (1984). Teacher expectations: A model for school improvement. The
Elementary School Journal Asiatique, 84, 469-481.
Quek Gary, Kien Huay Goh, Yeen Peng Yen, Yueh Mei Liu, Quee Leng Tan, Tan Ying
Chin, et al. (2008). Singapore. In I. V. S. Mullis, Martin. M. O, Olson. J. F,
Berger. D. R, Milne. D & Stanco. G. M (Eds.), Timss 2007 Encyclopedia: A
Guide to Mathematics and Science Education Around the World (Vol. 2).
Rabe-Hesketh, S., & Skrondal, A. (2006). Multilevel modelling of complex survey data.
Royal Statistical Society, 169, Part 4, 805–827.
Ramírez, M. J. (2006). Factors Related to Mathematics Achievement in Chile. In S.
Howie & T. Plomp (Eds.), Contexts of Learning Mathematics and Science:
Routledge.
Raudenbush, S. W., & Bryk, A. S. (2002). Hierarchical linear models: Application and
data analysis methods (Second ed.): Thousand Oaks,CA:Sage.
Raudenbush, S. W., Bryk, A. S., Cheong, Y. F., Congdon, R., & Toit, M. (2004). HLM6
Hierarchical linear & nonlinear modeling: Application and data analysis
methods.: SSI Scientific software international, Inc.
Reyes, L. H. (1984). Affective variables and mathematics education. The Elementary
School Journal Asiatique, 84, 558-581.
Roth, P. L., Switzer, F. S. I., & Switzer, D. M. (1999). Missing Data in Multiple Item
Scales: A Monte Carlo Analysis of Missing Data Techniques. Organizational
Research Methods, 2(3) 211-232.
Rubin, L. H., Witkiewitz. K, Andre. J. S, & Reilly. S. (2007). Methods for Handling
Missing Data in the Behavioral Neurosciences: Don’t Throw the Baby Rat out
with the Bath Water. The Journal of Undergraduate Neuroscience Education
(JUNE),, 5(2), A71-A77.
Rutkowski. L, Gonzalez, E., Joncas. M, & von Davier, M. (2010). International Large-
Scale Assessment Data: Issues in Secondary Analysis and Reporting.
Educational Researcher, 39(3), 142-151.
Shavelosn, R., McDonnell, L., Oakes, J., Carey, N., & Picus, L. (1987). Indicators
systems for Monitoring Mathematics and Science Education.
Snijders, T. A. B., & Bosker, R. J. (1999). Multilevel Analysis:An Introduction to Basic
and Advanced Multilevel Modeling (1st ed.): Thousand Oaks: Sage Publications.
M. Najib, Rohani & Ebrahim / Journal Educational Psychology and Counseling (2011) 304
Stevens.J. (2002). Applied multivariate statistics for the social sciences (4th ed.):
Lawrence Erlbaum Associates, Inc.
Tabachnik, B. G., & Fidell, L. S. (2007). Using Multivariate Statistics. (Fifth ed.):
Pearson Education,Inc.
Thomas, S. L., & Heck, R. H. (2001). Analysis of Large-Scale Secondary Data in
Higher Education Research: Potential Perils Associated with Complex Sampling
Designs. Research in Higher Education, 42 (5), 517-540.
Van den Broeck, A., Van Damme, J., & Opdenakker, M. C. (2006). The Effects of
Student, Class and School Characteristics on TIMSS 1999 Mathematics
Achievement in Flanders. In S. Howie & T. Plomp (Eds.), Contexts of Learning
Mathematics and Science: Routledge.
Walberg, H. J. (1984). Improving the productivity of America’s schools. Educational
Leadership, 41, 19-27.
Wilkins, J. L. M. (2004). Mathematics and Science Self-Concept: An International
Investigation. The Journal of Experimental Education, 72(4), 331–346.
Willms, J. D., & Smith, T. (2005). A manual for conducting analyses with data from
TIMSS and PISA: Report prepared for UNESCO Institute for Statistics.
Wu.Y, & Wooldridge. P. J. (2005). The impact of centering first-level predictors on
individual and contextual effects in multilevel data analysis. Nursing research,
54(3), 212-216.

More Related Content

What's hot

report writing
report writingreport writing
report writing
Illia Sham
 
Exploring Teachers Practices of Classroom Assessment in Secondary Science Cla...
Exploring Teachers Practices of Classroom Assessment in Secondary Science Cla...Exploring Teachers Practices of Classroom Assessment in Secondary Science Cla...
Exploring Teachers Practices of Classroom Assessment in Secondary Science Cla...
Md. Mehadi Rahman
 
The importance of intervention in developing self regulated learners
The importance of intervention in developing self regulated learnersThe importance of intervention in developing self regulated learners
The importance of intervention in developing self regulated learners
Alexander Decker
 
Attitude of lecturers towards student’s evaluation of their teaching effectiv...
Attitude of lecturers towards student’s evaluation of their teaching effectiv...Attitude of lecturers towards student’s evaluation of their teaching effectiv...
Attitude of lecturers towards student’s evaluation of their teaching effectiv...
Alexander Decker
 
Professionalism in teaching mathematics demographic profiling of secondary sc...
Professionalism in teaching mathematics demographic profiling of secondary sc...Professionalism in teaching mathematics demographic profiling of secondary sc...
Professionalism in teaching mathematics demographic profiling of secondary sc...
Alexander Decker
 
Evaluation Study of National Examination and Student New Admission in Efforts...
Evaluation Study of National Examination and Student New Admission in Efforts...Evaluation Study of National Examination and Student New Admission in Efforts...
Evaluation Study of National Examination and Student New Admission in Efforts...
inventionjournals
 
Uitm proposal
Uitm proposalUitm proposal
Uitm proposal
azlinazlan
 
A Study on Interest in Mathematics Interest and its Relation to Academic Achi...
A Study on Interest in Mathematics Interest and its Relation to Academic Achi...A Study on Interest in Mathematics Interest and its Relation to Academic Achi...
A Study on Interest in Mathematics Interest and its Relation to Academic Achi...
ijtsrd
 
Sin eng-2 - improving maths in p5
Sin eng-2 - improving maths in p5Sin eng-2 - improving maths in p5
Sin eng-2 - improving maths in p5
sochinaction
 
EFFECTS OF PRINCIPALS’ PROVISION OF TEACHING AND LEARNING MATERIALS ON STUDEN...
EFFECTS OF PRINCIPALS’ PROVISION OF TEACHING AND LEARNING MATERIALS ON STUDEN...EFFECTS OF PRINCIPALS’ PROVISION OF TEACHING AND LEARNING MATERIALS ON STUDEN...
EFFECTS OF PRINCIPALS’ PROVISION OF TEACHING AND LEARNING MATERIALS ON STUDEN...
ijejournal
 
MUHAMMAD AKBAR ZAHIDI - american journal education 2-10-2 copy
MUHAMMAD AKBAR ZAHIDI - american journal education 2-10-2 copyMUHAMMAD AKBAR ZAHIDI - american journal education 2-10-2 copy
MUHAMMAD AKBAR ZAHIDI - american journal education 2-10-2 copy
muhammadakbarzahidi
 
Timss and pisa
Timss and pisaTimss and pisa
Timss and pisa
Azam Nor
 
Effects of students attitude towards teaching profession
Effects of students attitude towards teaching professionEffects of students attitude towards teaching profession
Effects of students attitude towards teaching profession
Arul Sekar J.M.
 
Teacher Attitude
Teacher AttitudeTeacher Attitude
Teacher Attitude
Wenceslao Verdugo Rojas
 
Efforts to Improve Indonesian Language Learning Outcomes Students in Writing ...
Efforts to Improve Indonesian Language Learning Outcomes Students in Writing ...Efforts to Improve Indonesian Language Learning Outcomes Students in Writing ...
Efforts to Improve Indonesian Language Learning Outcomes Students in Writing ...
M. Ifaldi Sidik
 
7
77
Chapter I
Chapter IChapter I
Chapter I
pendixballpen
 
MUHAMMAD AKBAR ZAHIDI - international journal of innovation and applied studies
MUHAMMAD AKBAR ZAHIDI - international journal of innovation and applied studiesMUHAMMAD AKBAR ZAHIDI - international journal of innovation and applied studies
MUHAMMAD AKBAR ZAHIDI - international journal of innovation and applied studies
muhammadakbarzahidi
 
Factors influencing academic achievement in quantitative courses among busine...
Factors influencing academic achievement in quantitative courses among busine...Factors influencing academic achievement in quantitative courses among busine...
Factors influencing academic achievement in quantitative courses among busine...
Alexander Decker
 

What's hot (19)

report writing
report writingreport writing
report writing
 
Exploring Teachers Practices of Classroom Assessment in Secondary Science Cla...
Exploring Teachers Practices of Classroom Assessment in Secondary Science Cla...Exploring Teachers Practices of Classroom Assessment in Secondary Science Cla...
Exploring Teachers Practices of Classroom Assessment in Secondary Science Cla...
 
The importance of intervention in developing self regulated learners
The importance of intervention in developing self regulated learnersThe importance of intervention in developing self regulated learners
The importance of intervention in developing self regulated learners
 
Attitude of lecturers towards student’s evaluation of their teaching effectiv...
Attitude of lecturers towards student’s evaluation of their teaching effectiv...Attitude of lecturers towards student’s evaluation of their teaching effectiv...
Attitude of lecturers towards student’s evaluation of their teaching effectiv...
 
Professionalism in teaching mathematics demographic profiling of secondary sc...
Professionalism in teaching mathematics demographic profiling of secondary sc...Professionalism in teaching mathematics demographic profiling of secondary sc...
Professionalism in teaching mathematics demographic profiling of secondary sc...
 
Evaluation Study of National Examination and Student New Admission in Efforts...
Evaluation Study of National Examination and Student New Admission in Efforts...Evaluation Study of National Examination and Student New Admission in Efforts...
Evaluation Study of National Examination and Student New Admission in Efforts...
 
Uitm proposal
Uitm proposalUitm proposal
Uitm proposal
 
A Study on Interest in Mathematics Interest and its Relation to Academic Achi...
A Study on Interest in Mathematics Interest and its Relation to Academic Achi...A Study on Interest in Mathematics Interest and its Relation to Academic Achi...
A Study on Interest in Mathematics Interest and its Relation to Academic Achi...
 
Sin eng-2 - improving maths in p5
Sin eng-2 - improving maths in p5Sin eng-2 - improving maths in p5
Sin eng-2 - improving maths in p5
 
EFFECTS OF PRINCIPALS’ PROVISION OF TEACHING AND LEARNING MATERIALS ON STUDEN...
EFFECTS OF PRINCIPALS’ PROVISION OF TEACHING AND LEARNING MATERIALS ON STUDEN...EFFECTS OF PRINCIPALS’ PROVISION OF TEACHING AND LEARNING MATERIALS ON STUDEN...
EFFECTS OF PRINCIPALS’ PROVISION OF TEACHING AND LEARNING MATERIALS ON STUDEN...
 
MUHAMMAD AKBAR ZAHIDI - american journal education 2-10-2 copy
MUHAMMAD AKBAR ZAHIDI - american journal education 2-10-2 copyMUHAMMAD AKBAR ZAHIDI - american journal education 2-10-2 copy
MUHAMMAD AKBAR ZAHIDI - american journal education 2-10-2 copy
 
Timss and pisa
Timss and pisaTimss and pisa
Timss and pisa
 
Effects of students attitude towards teaching profession
Effects of students attitude towards teaching professionEffects of students attitude towards teaching profession
Effects of students attitude towards teaching profession
 
Teacher Attitude
Teacher AttitudeTeacher Attitude
Teacher Attitude
 
Efforts to Improve Indonesian Language Learning Outcomes Students in Writing ...
Efforts to Improve Indonesian Language Learning Outcomes Students in Writing ...Efforts to Improve Indonesian Language Learning Outcomes Students in Writing ...
Efforts to Improve Indonesian Language Learning Outcomes Students in Writing ...
 
7
77
7
 
Chapter I
Chapter IChapter I
Chapter I
 
MUHAMMAD AKBAR ZAHIDI - international journal of innovation and applied studies
MUHAMMAD AKBAR ZAHIDI - international journal of innovation and applied studiesMUHAMMAD AKBAR ZAHIDI - international journal of innovation and applied studies
MUHAMMAD AKBAR ZAHIDI - international journal of innovation and applied studies
 
Factors influencing academic achievement in quantitative courses among busine...
Factors influencing academic achievement in quantitative courses among busine...Factors influencing academic achievement in quantitative courses among busine...
Factors influencing academic achievement in quantitative courses among busine...
 

Viewers also liked

The Effect of Using Ipad on the Achievement of Children in Layla Kindergarten...
The Effect of Using Ipad on the Achievement of Children in Layla Kindergarten...The Effect of Using Ipad on the Achievement of Children in Layla Kindergarten...
The Effect of Using Ipad on the Achievement of Children in Layla Kindergarten...
iosrjce
 
Digital campfires: Innovations in helping faculty explore the online learning...
Digital campfires: Innovations in helping faculty explore the online learning...Digital campfires: Innovations in helping faculty explore the online learning...
Digital campfires: Innovations in helping faculty explore the online learning...
Patrick Lowenthal
 
‘Participating’ Model in Mentoring for Teachers
‘Participating’ Model in Mentoring for Teachers ‘Participating’ Model in Mentoring for Teachers
‘Participating’ Model in Mentoring for Teachers
iosrjce
 
Impact of Reading Behaviour on Teacher Efficacy among Arts and Science Colleg...
Impact of Reading Behaviour on Teacher Efficacy among Arts and Science Colleg...Impact of Reading Behaviour on Teacher Efficacy among Arts and Science Colleg...
Impact of Reading Behaviour on Teacher Efficacy among Arts and Science Colleg...
iosrjce
 
Effect of Problem-Based Learning on Senior Secondary School Students’ Achieve...
Effect of Problem-Based Learning on Senior Secondary School Students’ Achieve...Effect of Problem-Based Learning on Senior Secondary School Students’ Achieve...
Effect of Problem-Based Learning on Senior Secondary School Students’ Achieve...
IOSR Journals
 
Effects of computer based mastery learning on secondary school students’ moti...
Effects of computer based mastery learning on secondary school students’ moti...Effects of computer based mastery learning on secondary school students’ moti...
Effects of computer based mastery learning on secondary school students’ moti...
Alexander Decker
 
Standard of Practice-Professional Knowledge—Evidence for Problem-based Learni...
Standard of Practice-Professional Knowledge—Evidence for Problem-based Learni...Standard of Practice-Professional Knowledge—Evidence for Problem-based Learni...
Standard of Practice-Professional Knowledge—Evidence for Problem-based Learni...
Daniel Genesee
 
The Effect of Problem-Solving Instructional Strategies on Students’ Learning ...
The Effect of Problem-Solving Instructional Strategies on Students’ Learning ...The Effect of Problem-Solving Instructional Strategies on Students’ Learning ...
The Effect of Problem-Solving Instructional Strategies on Students’ Learning ...
iosrjce
 
Green School in the Perspective of Secondary School Students in Semarang, Cen...
Green School in the Perspective of Secondary School Students in Semarang, Cen...Green School in the Perspective of Secondary School Students in Semarang, Cen...
Green School in the Perspective of Secondary School Students in Semarang, Cen...
iosrjce
 
"Classroom in community: serving the elderly people learning from senior citi...
"Classroom in community: serving the elderly people learning from senior citi..."Classroom in community: serving the elderly people learning from senior citi...
"Classroom in community: serving the elderly people learning from senior citi...
bongsir
 
A study on classroom environment and learning of the students at secondary
A study on classroom environment and learning of the students at secondaryA study on classroom environment and learning of the students at secondary
A study on classroom environment and learning of the students at secondary
Alexander Decker
 
11.the nature of difficulties in learning english by the students at secondar...
11.the nature of difficulties in learning english by the students at secondar...11.the nature of difficulties in learning english by the students at secondar...
11.the nature of difficulties in learning english by the students at secondar...
Alexander Decker
 
The effects of collaborative learning on problem solving abilities among seni...
The effects of collaborative learning on problem solving abilities among seni...The effects of collaborative learning on problem solving abilities among seni...
The effects of collaborative learning on problem solving abilities among seni...
Alexander Decker
 
CLASSROOM MANAGEMENT JOURNAL
CLASSROOM MANAGEMENT JOURNALCLASSROOM MANAGEMENT JOURNAL
CLASSROOM MANAGEMENT JOURNAL
Juliette Ang
 
Teaching approach 3
Teaching approach 3Teaching approach 3
Teaching approach 3
Amie Joan Juanis
 
Language of instruction 2
Language of instruction 2Language of instruction 2
Language of instruction 2
Amie Joan Juanis
 
Language of instruction 3
Language of instruction 3Language of instruction 3
Language of instruction 3
Amie Joan Juanis
 
Teacher's certification 2
Teacher's certification 2Teacher's certification 2
Teacher's certification 2
Amie Joan Juanis
 
Sme6044 k3 t1_isu 11___edited
Sme6044 k3 t1_isu 11___editedSme6044 k3 t1_isu 11___edited
Sme6044 k3 t1_isu 11___edited
Amie Joan Juanis
 
Teacher's certification 3
Teacher's certification 3Teacher's certification 3
Teacher's certification 3
Amie Joan Juanis
 

Viewers also liked (20)

The Effect of Using Ipad on the Achievement of Children in Layla Kindergarten...
The Effect of Using Ipad on the Achievement of Children in Layla Kindergarten...The Effect of Using Ipad on the Achievement of Children in Layla Kindergarten...
The Effect of Using Ipad on the Achievement of Children in Layla Kindergarten...
 
Digital campfires: Innovations in helping faculty explore the online learning...
Digital campfires: Innovations in helping faculty explore the online learning...Digital campfires: Innovations in helping faculty explore the online learning...
Digital campfires: Innovations in helping faculty explore the online learning...
 
‘Participating’ Model in Mentoring for Teachers
‘Participating’ Model in Mentoring for Teachers ‘Participating’ Model in Mentoring for Teachers
‘Participating’ Model in Mentoring for Teachers
 
Impact of Reading Behaviour on Teacher Efficacy among Arts and Science Colleg...
Impact of Reading Behaviour on Teacher Efficacy among Arts and Science Colleg...Impact of Reading Behaviour on Teacher Efficacy among Arts and Science Colleg...
Impact of Reading Behaviour on Teacher Efficacy among Arts and Science Colleg...
 
Effect of Problem-Based Learning on Senior Secondary School Students’ Achieve...
Effect of Problem-Based Learning on Senior Secondary School Students’ Achieve...Effect of Problem-Based Learning on Senior Secondary School Students’ Achieve...
Effect of Problem-Based Learning on Senior Secondary School Students’ Achieve...
 
Effects of computer based mastery learning on secondary school students’ moti...
Effects of computer based mastery learning on secondary school students’ moti...Effects of computer based mastery learning on secondary school students’ moti...
Effects of computer based mastery learning on secondary school students’ moti...
 
Standard of Practice-Professional Knowledge—Evidence for Problem-based Learni...
Standard of Practice-Professional Knowledge—Evidence for Problem-based Learni...Standard of Practice-Professional Knowledge—Evidence for Problem-based Learni...
Standard of Practice-Professional Knowledge—Evidence for Problem-based Learni...
 
The Effect of Problem-Solving Instructional Strategies on Students’ Learning ...
The Effect of Problem-Solving Instructional Strategies on Students’ Learning ...The Effect of Problem-Solving Instructional Strategies on Students’ Learning ...
The Effect of Problem-Solving Instructional Strategies on Students’ Learning ...
 
Green School in the Perspective of Secondary School Students in Semarang, Cen...
Green School in the Perspective of Secondary School Students in Semarang, Cen...Green School in the Perspective of Secondary School Students in Semarang, Cen...
Green School in the Perspective of Secondary School Students in Semarang, Cen...
 
"Classroom in community: serving the elderly people learning from senior citi...
"Classroom in community: serving the elderly people learning from senior citi..."Classroom in community: serving the elderly people learning from senior citi...
"Classroom in community: serving the elderly people learning from senior citi...
 
A study on classroom environment and learning of the students at secondary
A study on classroom environment and learning of the students at secondaryA study on classroom environment and learning of the students at secondary
A study on classroom environment and learning of the students at secondary
 
11.the nature of difficulties in learning english by the students at secondar...
11.the nature of difficulties in learning english by the students at secondar...11.the nature of difficulties in learning english by the students at secondar...
11.the nature of difficulties in learning english by the students at secondar...
 
The effects of collaborative learning on problem solving abilities among seni...
The effects of collaborative learning on problem solving abilities among seni...The effects of collaborative learning on problem solving abilities among seni...
The effects of collaborative learning on problem solving abilities among seni...
 
CLASSROOM MANAGEMENT JOURNAL
CLASSROOM MANAGEMENT JOURNALCLASSROOM MANAGEMENT JOURNAL
CLASSROOM MANAGEMENT JOURNAL
 
Teaching approach 3
Teaching approach 3Teaching approach 3
Teaching approach 3
 
Language of instruction 2
Language of instruction 2Language of instruction 2
Language of instruction 2
 
Language of instruction 3
Language of instruction 3Language of instruction 3
Language of instruction 3
 
Teacher's certification 2
Teacher's certification 2Teacher's certification 2
Teacher's certification 2
 
Sme6044 k3 t1_isu 11___edited
Sme6044 k3 t1_isu 11___editedSme6044 k3 t1_isu 11___edited
Sme6044 k3 t1_isu 11___edited
 
Teacher's certification 3
Teacher's certification 3Teacher's certification 3
Teacher's certification 3
 

Similar to Timss 1

IMPACT OF TEACHER CHARACTERISTICS ON STUDENTS ACADEMIC PERFORMANCE IN PUBLIC...
IMPACT OF TEACHER CHARACTERISTICS ON STUDENTS  ACADEMIC PERFORMANCE IN PUBLIC...IMPACT OF TEACHER CHARACTERISTICS ON STUDENTS  ACADEMIC PERFORMANCE IN PUBLIC...
IMPACT OF TEACHER CHARACTERISTICS ON STUDENTS ACADEMIC PERFORMANCE IN PUBLIC...
Kimberly Williams
 
A research on teachers’ beliefs about mathematics teaching and learning betwe...
A research on teachers’ beliefs about mathematics teaching and learning betwe...A research on teachers’ beliefs about mathematics teaching and learning betwe...
A research on teachers’ beliefs about mathematics teaching and learning betwe...
Alexander Decker
 
A research on teachers’ beliefs about mathematics teaching and learning betwe...
A research on teachers’ beliefs about mathematics teaching and learning betwe...A research on teachers’ beliefs about mathematics teaching and learning betwe...
A research on teachers’ beliefs about mathematics teaching and learning betwe...
Alexander Decker
 
Approaches of classroom activities in mathematics achievements in ethiopian c...
Approaches of classroom activities in mathematics achievements in ethiopian c...Approaches of classroom activities in mathematics achievements in ethiopian c...
Approaches of classroom activities in mathematics achievements in ethiopian c...
Alexander Decker
 
THESIS POWERPOINT.pptx
THESIS POWERPOINT.pptxTHESIS POWERPOINT.pptx
THESIS POWERPOINT.pptx
ReyBorlado
 
Students and teachers’ views of difficult areas in mathematics syllabus
Students and teachers’ views of difficult areas in mathematics syllabusStudents and teachers’ views of difficult areas in mathematics syllabus
Students and teachers’ views of difficult areas in mathematics syllabus
Alexander Decker
 
Assessment in play-based kindergarten classrooms An empirical study of teach...
Assessment in play-based kindergarten classrooms  An empirical study of teach...Assessment in play-based kindergarten classrooms  An empirical study of teach...
Assessment in play-based kindergarten classrooms An empirical study of teach...
Linda Garcia
 
Protocolo Presentation
Protocolo PresentationProtocolo Presentation
Protocolo Presentation
Astrid Madera
 
School effectiveness-and-improvement-contribution-of-teacher-qualification-to...
School effectiveness-and-improvement-contribution-of-teacher-qualification-to...School effectiveness-and-improvement-contribution-of-teacher-qualification-to...
School effectiveness-and-improvement-contribution-of-teacher-qualification-to...
oircjournals
 
Attitude of teachers and school variables in secondary schools in ondo state,...
Attitude of teachers and school variables in secondary schools in ondo state,...Attitude of teachers and school variables in secondary schools in ondo state,...
Attitude of teachers and school variables in secondary schools in ondo state,...
Alexander Decker
 
Jurnal internasional print
Jurnal internasional printJurnal internasional print
Jurnal internasional print
Jonter Situngkir
 
Research proposal upload
Research proposal uploadResearch proposal upload
Research proposal upload
Nabin Bhattarai
 
Ej1102801
Ej1102801Ej1102801
Ej1102801
Pongpitak Thanak
 
Maximize Learning with Online Resources.
Maximize Learning with Online Resources.Maximize Learning with Online Resources.
Maximize Learning with Online Resources.
notrurimla
 
Access n equity 4
Access n equity 4Access n equity 4
Access n equity 4
Amie Joan Juanis
 
Effects of student teacher ratio on academic achievement of selected secondar...
Effects of student teacher ratio on academic achievement of selected secondar...Effects of student teacher ratio on academic achievement of selected secondar...
Effects of student teacher ratio on academic achievement of selected secondar...
Alexander Decker
 
Effect Of Supervised Peer-Led Group Counselling Programme On Academic Achieve...
Effect Of Supervised Peer-Led Group Counselling Programme On Academic Achieve...Effect Of Supervised Peer-Led Group Counselling Programme On Academic Achieve...
Effect Of Supervised Peer-Led Group Counselling Programme On Academic Achieve...
iosrjce
 
Factors Affecting the Contribution of 1st Year Female Students Tutorial Class...
Factors Affecting the Contribution of 1st Year Female Students Tutorial Class...Factors Affecting the Contribution of 1st Year Female Students Tutorial Class...
Factors Affecting the Contribution of 1st Year Female Students Tutorial Class...
CrimsonPublishers-SBB
 
Promoting Best Practices in Secondary Schools through Teacher Commitment
 Promoting Best Practices in Secondary Schools through Teacher Commitment Promoting Best Practices in Secondary Schools through Teacher Commitment
Promoting Best Practices in Secondary Schools through Teacher Commitment
Research Journal of Education
 
Searching for the relationship between secondary schools students' motivation...
Searching for the relationship between secondary schools students' motivation...Searching for the relationship between secondary schools students' motivation...
Searching for the relationship between secondary schools students' motivation...
inventionjournals
 

Similar to Timss 1 (20)

IMPACT OF TEACHER CHARACTERISTICS ON STUDENTS ACADEMIC PERFORMANCE IN PUBLIC...
IMPACT OF TEACHER CHARACTERISTICS ON STUDENTS  ACADEMIC PERFORMANCE IN PUBLIC...IMPACT OF TEACHER CHARACTERISTICS ON STUDENTS  ACADEMIC PERFORMANCE IN PUBLIC...
IMPACT OF TEACHER CHARACTERISTICS ON STUDENTS ACADEMIC PERFORMANCE IN PUBLIC...
 
A research on teachers’ beliefs about mathematics teaching and learning betwe...
A research on teachers’ beliefs about mathematics teaching and learning betwe...A research on teachers’ beliefs about mathematics teaching and learning betwe...
A research on teachers’ beliefs about mathematics teaching and learning betwe...
 
A research on teachers’ beliefs about mathematics teaching and learning betwe...
A research on teachers’ beliefs about mathematics teaching and learning betwe...A research on teachers’ beliefs about mathematics teaching and learning betwe...
A research on teachers’ beliefs about mathematics teaching and learning betwe...
 
Approaches of classroom activities in mathematics achievements in ethiopian c...
Approaches of classroom activities in mathematics achievements in ethiopian c...Approaches of classroom activities in mathematics achievements in ethiopian c...
Approaches of classroom activities in mathematics achievements in ethiopian c...
 
THESIS POWERPOINT.pptx
THESIS POWERPOINT.pptxTHESIS POWERPOINT.pptx
THESIS POWERPOINT.pptx
 
Students and teachers’ views of difficult areas in mathematics syllabus
Students and teachers’ views of difficult areas in mathematics syllabusStudents and teachers’ views of difficult areas in mathematics syllabus
Students and teachers’ views of difficult areas in mathematics syllabus
 
Assessment in play-based kindergarten classrooms An empirical study of teach...
Assessment in play-based kindergarten classrooms  An empirical study of teach...Assessment in play-based kindergarten classrooms  An empirical study of teach...
Assessment in play-based kindergarten classrooms An empirical study of teach...
 
Protocolo Presentation
Protocolo PresentationProtocolo Presentation
Protocolo Presentation
 
School effectiveness-and-improvement-contribution-of-teacher-qualification-to...
School effectiveness-and-improvement-contribution-of-teacher-qualification-to...School effectiveness-and-improvement-contribution-of-teacher-qualification-to...
School effectiveness-and-improvement-contribution-of-teacher-qualification-to...
 
Attitude of teachers and school variables in secondary schools in ondo state,...
Attitude of teachers and school variables in secondary schools in ondo state,...Attitude of teachers and school variables in secondary schools in ondo state,...
Attitude of teachers and school variables in secondary schools in ondo state,...
 
Jurnal internasional print
Jurnal internasional printJurnal internasional print
Jurnal internasional print
 
Research proposal upload
Research proposal uploadResearch proposal upload
Research proposal upload
 
Ej1102801
Ej1102801Ej1102801
Ej1102801
 
Maximize Learning with Online Resources.
Maximize Learning with Online Resources.Maximize Learning with Online Resources.
Maximize Learning with Online Resources.
 
Access n equity 4
Access n equity 4Access n equity 4
Access n equity 4
 
Effects of student teacher ratio on academic achievement of selected secondar...
Effects of student teacher ratio on academic achievement of selected secondar...Effects of student teacher ratio on academic achievement of selected secondar...
Effects of student teacher ratio on academic achievement of selected secondar...
 
Effect Of Supervised Peer-Led Group Counselling Programme On Academic Achieve...
Effect Of Supervised Peer-Led Group Counselling Programme On Academic Achieve...Effect Of Supervised Peer-Led Group Counselling Programme On Academic Achieve...
Effect Of Supervised Peer-Led Group Counselling Programme On Academic Achieve...
 
Factors Affecting the Contribution of 1st Year Female Students Tutorial Class...
Factors Affecting the Contribution of 1st Year Female Students Tutorial Class...Factors Affecting the Contribution of 1st Year Female Students Tutorial Class...
Factors Affecting the Contribution of 1st Year Female Students Tutorial Class...
 
Promoting Best Practices in Secondary Schools through Teacher Commitment
 Promoting Best Practices in Secondary Schools through Teacher Commitment Promoting Best Practices in Secondary Schools through Teacher Commitment
Promoting Best Practices in Secondary Schools through Teacher Commitment
 
Searching for the relationship between secondary schools students' motivation...
Searching for the relationship between secondary schools students' motivation...Searching for the relationship between secondary schools students' motivation...
Searching for the relationship between secondary schools students' motivation...
 

More from Amie Joan Juanis

Sme6044 k3 t1_isu 2____edited
Sme6044 k3 t1_isu 2____editedSme6044 k3 t1_isu 2____edited
Sme6044 k3 t1_isu 2____edited
Amie Joan Juanis
 
Teaching approach 2
Teaching approach 2Teaching approach 2
Teaching approach 2
Amie Joan Juanis
 
Teaching approach 1
Teaching approach 1Teaching approach 1
Teaching approach 1
Amie Joan Juanis
 
Teacher's certification 1
Teacher's certification 1Teacher's certification 1
Teacher's certification 1
Amie Joan Juanis
 
Professional teaching standard 2
Professional teaching standard 2Professional teaching standard 2
Professional teaching standard 2
Amie Joan Juanis
 
Professional teaching standard 3
Professional  teaching standard 3Professional  teaching standard 3
Professional teaching standard 3
Amie Joan Juanis
 
Math anxiety 3
Math anxiety 3Math anxiety 3
Math anxiety 3
Amie Joan Juanis
 
Math anxiety 2
Math anxiety 2Math anxiety 2
Math anxiety 2
Amie Joan Juanis
 
Math anxiety 1
Math anxiety 1Math anxiety 1
Math anxiety 1
Amie Joan Juanis
 
Language of instruction 1
Language of instruction 1Language of instruction 1
Language of instruction 1
Amie Joan Juanis
 
Jurang pendidikan 5
Jurang pendidikan 5Jurang pendidikan 5
Jurang pendidikan 5
Amie Joan Juanis
 
Jurang pendidikan 4
Jurang pendidikan 4Jurang pendidikan 4
Jurang pendidikan 4
Amie Joan Juanis
 
Jurang pendidikan 3
Jurang pendidikan 3Jurang pendidikan 3
Jurang pendidikan 3
Amie Joan Juanis
 
Jurang pendidikan 2
Jurang pendidikan 2Jurang pendidikan 2
Jurang pendidikan 2
Amie Joan Juanis
 
Jurang pendidikan 1
Jurang pendidikan 1Jurang pendidikan 1
Jurang pendidikan 1
Amie Joan Juanis
 
Ict 3
Ict 3Ict 3
Ict 2
Ict 2Ict 2
Ict 1
Ict 1Ict 1
Curriculum 3
Curriculum 3Curriculum 3
Curriculum 3
Amie Joan Juanis
 
Curriculum 2
Curriculum 2Curriculum 2
Curriculum 2
Amie Joan Juanis
 

More from Amie Joan Juanis (20)

Sme6044 k3 t1_isu 2____edited
Sme6044 k3 t1_isu 2____editedSme6044 k3 t1_isu 2____edited
Sme6044 k3 t1_isu 2____edited
 
Teaching approach 2
Teaching approach 2Teaching approach 2
Teaching approach 2
 
Teaching approach 1
Teaching approach 1Teaching approach 1
Teaching approach 1
 
Teacher's certification 1
Teacher's certification 1Teacher's certification 1
Teacher's certification 1
 
Professional teaching standard 2
Professional teaching standard 2Professional teaching standard 2
Professional teaching standard 2
 
Professional teaching standard 3
Professional  teaching standard 3Professional  teaching standard 3
Professional teaching standard 3
 
Math anxiety 3
Math anxiety 3Math anxiety 3
Math anxiety 3
 
Math anxiety 2
Math anxiety 2Math anxiety 2
Math anxiety 2
 
Math anxiety 1
Math anxiety 1Math anxiety 1
Math anxiety 1
 
Language of instruction 1
Language of instruction 1Language of instruction 1
Language of instruction 1
 
Jurang pendidikan 5
Jurang pendidikan 5Jurang pendidikan 5
Jurang pendidikan 5
 
Jurang pendidikan 4
Jurang pendidikan 4Jurang pendidikan 4
Jurang pendidikan 4
 
Jurang pendidikan 3
Jurang pendidikan 3Jurang pendidikan 3
Jurang pendidikan 3
 
Jurang pendidikan 2
Jurang pendidikan 2Jurang pendidikan 2
Jurang pendidikan 2
 
Jurang pendidikan 1
Jurang pendidikan 1Jurang pendidikan 1
Jurang pendidikan 1
 
Ict 3
Ict 3Ict 3
Ict 3
 
Ict 2
Ict 2Ict 2
Ict 2
 
Ict 1
Ict 1Ict 1
Ict 1
 
Curriculum 3
Curriculum 3Curriculum 3
Curriculum 3
 
Curriculum 2
Curriculum 2Curriculum 2
Curriculum 2
 

Recently uploaded

Educational Technology in the Health Sciences
Educational Technology in the Health SciencesEducational Technology in the Health Sciences
Educational Technology in the Health Sciences
Iris Thiele Isip-Tan
 
How Barcodes Can Be Leveraged Within Odoo 17
How Barcodes Can Be Leveraged Within Odoo 17How Barcodes Can Be Leveraged Within Odoo 17
How Barcodes Can Be Leveraged Within Odoo 17
Celine George
 
Présentationvvvvvvvvvvvvvvvvvvvvvvvvvvvv2.pptx
Présentationvvvvvvvvvvvvvvvvvvvvvvvvvvvv2.pptxPrésentationvvvvvvvvvvvvvvvvvvvvvvvvvvvv2.pptx
Présentationvvvvvvvvvvvvvvvvvvvvvvvvvvvv2.pptx
siemaillard
 
Philippine Edukasyong Pantahanan at Pangkabuhayan (EPP) Curriculum
Philippine Edukasyong Pantahanan at Pangkabuhayan (EPP) CurriculumPhilippine Edukasyong Pantahanan at Pangkabuhayan (EPP) Curriculum
Philippine Edukasyong Pantahanan at Pangkabuhayan (EPP) Curriculum
MJDuyan
 
What is Digital Literacy? A guest blog from Andy McLaughlin, University of Ab...
What is Digital Literacy? A guest blog from Andy McLaughlin, University of Ab...What is Digital Literacy? A guest blog from Andy McLaughlin, University of Ab...
What is Digital Literacy? A guest blog from Andy McLaughlin, University of Ab...
GeorgeMilliken2
 
Benner "Expanding Pathways to Publishing Careers"
Benner "Expanding Pathways to Publishing Careers"Benner "Expanding Pathways to Publishing Careers"
Benner "Expanding Pathways to Publishing Careers"
National Information Standards Organization (NISO)
 
Beyond Degrees - Empowering the Workforce in the Context of Skills-First.pptx
Beyond Degrees - Empowering the Workforce in the Context of Skills-First.pptxBeyond Degrees - Empowering the Workforce in the Context of Skills-First.pptx
Beyond Degrees - Empowering the Workforce in the Context of Skills-First.pptx
EduSkills OECD
 
BIOLOGY NATIONAL EXAMINATION COUNCIL (NECO) 2024 PRACTICAL MANUAL.pptx
BIOLOGY NATIONAL EXAMINATION COUNCIL (NECO) 2024 PRACTICAL MANUAL.pptxBIOLOGY NATIONAL EXAMINATION COUNCIL (NECO) 2024 PRACTICAL MANUAL.pptx
BIOLOGY NATIONAL EXAMINATION COUNCIL (NECO) 2024 PRACTICAL MANUAL.pptx
RidwanHassanYusuf
 
HYPERTENSION - SLIDE SHARE PRESENTATION.
HYPERTENSION - SLIDE SHARE PRESENTATION.HYPERTENSION - SLIDE SHARE PRESENTATION.
HYPERTENSION - SLIDE SHARE PRESENTATION.
deepaannamalai16
 
Stack Memory Organization of 8086 Microprocessor
Stack Memory Organization of 8086 MicroprocessorStack Memory Organization of 8086 Microprocessor
Stack Memory Organization of 8086 Microprocessor
JomonJoseph58
 
Geography as a Discipline Chapter 1 __ Class 11 Geography NCERT _ Class Notes...
Geography as a Discipline Chapter 1 __ Class 11 Geography NCERT _ Class Notes...Geography as a Discipline Chapter 1 __ Class 11 Geography NCERT _ Class Notes...
Geography as a Discipline Chapter 1 __ Class 11 Geography NCERT _ Class Notes...
ImMuslim
 
Wound healing PPT
Wound healing PPTWound healing PPT
Wound healing PPT
Jyoti Chand
 
Temple of Asclepius in Thrace. Excavation results
Temple of Asclepius in Thrace. Excavation resultsTemple of Asclepius in Thrace. Excavation results
Temple of Asclepius in Thrace. Excavation results
Krassimira Luka
 
Gender and Mental Health - Counselling and Family Therapy Applications and In...
Gender and Mental Health - Counselling and Family Therapy Applications and In...Gender and Mental Health - Counselling and Family Therapy Applications and In...
Gender and Mental Health - Counselling and Family Therapy Applications and In...
PsychoTech Services
 
Andreas Schleicher presents PISA 2022 Volume III - Creative Thinking - 18 Jun...
Andreas Schleicher presents PISA 2022 Volume III - Creative Thinking - 18 Jun...Andreas Schleicher presents PISA 2022 Volume III - Creative Thinking - 18 Jun...
Andreas Schleicher presents PISA 2022 Volume III - Creative Thinking - 18 Jun...
EduSkills OECD
 
Standardized tool for Intelligence test.
Standardized tool for Intelligence test.Standardized tool for Intelligence test.
Standardized tool for Intelligence test.
deepaannamalai16
 
spot a liar (Haiqa 146).pptx Technical writhing and presentation skills
spot a liar (Haiqa 146).pptx Technical writhing and presentation skillsspot a liar (Haiqa 146).pptx Technical writhing and presentation skills
spot a liar (Haiqa 146).pptx Technical writhing and presentation skills
haiqairshad
 
Haunted Houses by H W Longfellow for class 10
Haunted Houses by H W Longfellow for class 10Haunted Houses by H W Longfellow for class 10
Haunted Houses by H W Longfellow for class 10
nitinpv4ai
 
RHEOLOGY Physical pharmaceutics-II notes for B.pharm 4th sem students
RHEOLOGY Physical pharmaceutics-II notes for B.pharm 4th sem studentsRHEOLOGY Physical pharmaceutics-II notes for B.pharm 4th sem students
RHEOLOGY Physical pharmaceutics-II notes for B.pharm 4th sem students
Himanshu Rai
 
مصحف القراءات العشر أعد أحرف الخلاف سمير بسيوني.pdf
مصحف القراءات العشر   أعد أحرف الخلاف سمير بسيوني.pdfمصحف القراءات العشر   أعد أحرف الخلاف سمير بسيوني.pdf
مصحف القراءات العشر أعد أحرف الخلاف سمير بسيوني.pdf
سمير بسيوني
 

Recently uploaded (20)

Educational Technology in the Health Sciences
Educational Technology in the Health SciencesEducational Technology in the Health Sciences
Educational Technology in the Health Sciences
 
How Barcodes Can Be Leveraged Within Odoo 17
How Barcodes Can Be Leveraged Within Odoo 17How Barcodes Can Be Leveraged Within Odoo 17
How Barcodes Can Be Leveraged Within Odoo 17
 
Présentationvvvvvvvvvvvvvvvvvvvvvvvvvvvv2.pptx
Présentationvvvvvvvvvvvvvvvvvvvvvvvvvvvv2.pptxPrésentationvvvvvvvvvvvvvvvvvvvvvvvvvvvv2.pptx
Présentationvvvvvvvvvvvvvvvvvvvvvvvvvvvv2.pptx
 
Philippine Edukasyong Pantahanan at Pangkabuhayan (EPP) Curriculum
Philippine Edukasyong Pantahanan at Pangkabuhayan (EPP) CurriculumPhilippine Edukasyong Pantahanan at Pangkabuhayan (EPP) Curriculum
Philippine Edukasyong Pantahanan at Pangkabuhayan (EPP) Curriculum
 
What is Digital Literacy? A guest blog from Andy McLaughlin, University of Ab...
What is Digital Literacy? A guest blog from Andy McLaughlin, University of Ab...What is Digital Literacy? A guest blog from Andy McLaughlin, University of Ab...
What is Digital Literacy? A guest blog from Andy McLaughlin, University of Ab...
 
Benner "Expanding Pathways to Publishing Careers"
Benner "Expanding Pathways to Publishing Careers"Benner "Expanding Pathways to Publishing Careers"
Benner "Expanding Pathways to Publishing Careers"
 
Beyond Degrees - Empowering the Workforce in the Context of Skills-First.pptx
Beyond Degrees - Empowering the Workforce in the Context of Skills-First.pptxBeyond Degrees - Empowering the Workforce in the Context of Skills-First.pptx
Beyond Degrees - Empowering the Workforce in the Context of Skills-First.pptx
 
BIOLOGY NATIONAL EXAMINATION COUNCIL (NECO) 2024 PRACTICAL MANUAL.pptx
BIOLOGY NATIONAL EXAMINATION COUNCIL (NECO) 2024 PRACTICAL MANUAL.pptxBIOLOGY NATIONAL EXAMINATION COUNCIL (NECO) 2024 PRACTICAL MANUAL.pptx
BIOLOGY NATIONAL EXAMINATION COUNCIL (NECO) 2024 PRACTICAL MANUAL.pptx
 
HYPERTENSION - SLIDE SHARE PRESENTATION.
HYPERTENSION - SLIDE SHARE PRESENTATION.HYPERTENSION - SLIDE SHARE PRESENTATION.
HYPERTENSION - SLIDE SHARE PRESENTATION.
 
Stack Memory Organization of 8086 Microprocessor
Stack Memory Organization of 8086 MicroprocessorStack Memory Organization of 8086 Microprocessor
Stack Memory Organization of 8086 Microprocessor
 
Geography as a Discipline Chapter 1 __ Class 11 Geography NCERT _ Class Notes...
Geography as a Discipline Chapter 1 __ Class 11 Geography NCERT _ Class Notes...Geography as a Discipline Chapter 1 __ Class 11 Geography NCERT _ Class Notes...
Geography as a Discipline Chapter 1 __ Class 11 Geography NCERT _ Class Notes...
 
Wound healing PPT
Wound healing PPTWound healing PPT
Wound healing PPT
 
Temple of Asclepius in Thrace. Excavation results
Temple of Asclepius in Thrace. Excavation resultsTemple of Asclepius in Thrace. Excavation results
Temple of Asclepius in Thrace. Excavation results
 
Gender and Mental Health - Counselling and Family Therapy Applications and In...
Gender and Mental Health - Counselling and Family Therapy Applications and In...Gender and Mental Health - Counselling and Family Therapy Applications and In...
Gender and Mental Health - Counselling and Family Therapy Applications and In...
 
Andreas Schleicher presents PISA 2022 Volume III - Creative Thinking - 18 Jun...
Andreas Schleicher presents PISA 2022 Volume III - Creative Thinking - 18 Jun...Andreas Schleicher presents PISA 2022 Volume III - Creative Thinking - 18 Jun...
Andreas Schleicher presents PISA 2022 Volume III - Creative Thinking - 18 Jun...
 
Standardized tool for Intelligence test.
Standardized tool for Intelligence test.Standardized tool for Intelligence test.
Standardized tool for Intelligence test.
 
spot a liar (Haiqa 146).pptx Technical writhing and presentation skills
spot a liar (Haiqa 146).pptx Technical writhing and presentation skillsspot a liar (Haiqa 146).pptx Technical writhing and presentation skills
spot a liar (Haiqa 146).pptx Technical writhing and presentation skills
 
Haunted Houses by H W Longfellow for class 10
Haunted Houses by H W Longfellow for class 10Haunted Houses by H W Longfellow for class 10
Haunted Houses by H W Longfellow for class 10
 
RHEOLOGY Physical pharmaceutics-II notes for B.pharm 4th sem students
RHEOLOGY Physical pharmaceutics-II notes for B.pharm 4th sem studentsRHEOLOGY Physical pharmaceutics-II notes for B.pharm 4th sem students
RHEOLOGY Physical pharmaceutics-II notes for B.pharm 4th sem students
 
مصحف القراءات العشر أعد أحرف الخلاف سمير بسيوني.pdf
مصحف القراءات العشر   أعد أحرف الخلاف سمير بسيوني.pdfمصحف القراءات العشر   أعد أحرف الخلاف سمير بسيوني.pdf
مصحف القراءات العشر أعد أحرف الخلاف سمير بسيوني.pdf
 

Timss 1

  • 1. Journal of Educational Psychology and Counseling, volume 2, Jun 2011, Pages 285-304 / ISSN: 2231-735X Multilevel analysis of achievement in mathematics of Malaysian and Singaporean students M. Najib Abd. Ghagar1 , Rohani Othman1 & Ebrahim Mohammadpour1 1 Fakulty Education, Universiti Teknologi Malaysia, 81310 Johor, Malaysia Abstract: This article explored the variation in mathematics achievement of Malaysian and Singaporean eighth-graders as a function of student- and school-level differences. The data obtained from 5314 students nested within 150 schools from Malaysia, and 6018 students nested within 164 schools from Singapore who participated in the Trends in International Mathematics and Science Study (TIMSS) in the 2003. Multilevel linear modeling was employed to analyze the data. The results indicated that 57.28% of the total variance in mathematics achievement in Malaysia accounted for school-level differences. Meanwhile, the results showed that classroom-level differences contributed to 74.6% of the total variance in achievement of Singaporean students. Only 5.9% of the variance in achievement in Sin gapore accounted for school-level differences. At the student level, mathematics self-concept was the most influential factor on achievement of students from both countries. At the school level, school climate as perceived by the school principals was the most influential factor on achievement of students from both countries. Keywords: Achievement; Factor; Malaysia; Mathematics; Multilevel; Singapore; TIMSS 1.0 INTRODUCTION The Trends in International Mathematics and Science Study (TIMSS) is a comparative study designed in 1995 by The International Association for Evaluation of Educational Achievement (IEA). TIMSS was designed to assess the quality of the teaching and learning of mathematics and science among the fourth and eighth-graders across participating countries. Malaysia and Singapore are two multi-cultural countries having three major ethnic groups: Malay, Chinese and Indians. Singapore is a small island that is 470 times smaller than Malaysia and it is also 6 times smaller than Malaysia in population size. In terms of per capita income, it is almost 6 times higher than Malaysia (Mullis et al., 2004). In spite of these differences, there are some similarities between the education systems. For example, the education system in both countries is centralized. Educational structures and schooling age in both countries are the same and there is no difference in mathematics instruction weekly time. Multi-languages is another common characteristics of the two countries. Even though Malay is the national language of both countries (Quek Gary et al., 2008), however, the medium of instruction in Singapore is English (Mullis et al., 2008; Mullis et al.,2008). Singapore has joined the TIMSS studies since 1995 at both the fourth and eighth-graders, whereas Malaysia has joined since 1999 only at eighth-graders. Singapore ranked first in the mathematics achievement at the eighth-graders from
  • 2. M. Najib, Rohani & Ebrahim / Journal Educational Psychology and Counseling (2011) 286 TIMSS 1995 to 2003 continuously. The achievement of Singaporean in TIMSS 1999 and 2003 was higher than Malaysia by 91 score in average. In contrast, Malaysia with mean score of 519 in 1999 stood at 16th place among the 38 participating countries, but later improved its ranking to 10th place in 2003 with mean score of 508 among the 45 participating countries. It is worth mentioning that even though the ranking showed improvement from 1999 to 2003, however, this improvement was not due to the status promotion in Malaysia, but rather it was due to the decline in overall mathematics achievements internationally (Mullis et al., 2004; Mullis et al., 2000). Singapore was a part of Malaysia from the sixteenth to the nineteenth century until it sought independence from Malaysia in 1965 (Noor Azina Ismail & Halimah Awang, 2009). As mentioned earlier, despite many similarities between Malaysia and Singapore, such as the centralization of the educational system, educational structure, allocated instructional time for mathematics, schooling age, race and ethnic groups, Malaysian students performed far lower in TIMSS studies as compared to its counterparts in Singapore. Therefore, the main objective of this study was to explore the factors behind the differences. 2.0 RESERCH QUATRAINS This research aimed to answer the following research questions: 1. How much of the total variance in mathematics achievement of Malaysian students accounted for student and school-level differences? 2. How much of the student-level variance in mathematics achievement of Malaysian students is associated with mathematics self-concept, attitude towards mathematics and home educational resources factors? 3. How much of the school-level variance in achievement of Malaysian students is associated with school climate, school resources, good attendance at school and the location of the school factors? 4. How much of the total variance in mathematics achievement of Singaporean students accounted for student, classroom and school-level differences? 5. How much of the student-level variance in mathematics achievement of Singaporean students is associated with mathematics self-concept, attitude towards mathematics and home educational resources factors? 6. How much of the classroom-level variance in mathematics achievement of Singaporean students is associated with school climate as perceived by the mathematics teachers? 7. How much of the school-level variance in achievement of Malaysian students is associated with school climate as perceived by the school principals, school resources, good attendance at school and the location of the school factors?
  • 3. M. Najib, Rohani & Ebrahim / Journal Educational Psychology and Counseling (2011) 287 3.0 CONCEPTUAL FRAMEWORK For the past few decades (1960-1990) many researchers and authors had attempted to find out the answer as to why some students learn better than others and why some schools are more effective than others. Researcher suggests that the possible answer to these questions could be found in educational inputs, processes and context (Huitt, 2003). Consequently, different theories and models (Carroll, 1963; Creemers, 1994; Gage & Berliner, 1992; Huitt, 1995; Proctor, 1984; Shavelosn et al.,1987; Walberg, 1984) were developed and used in studying school effectiveness. In this study, the following conceptual framework shown in Figure 1 which was adapted from Shavelson et al. (1987), served as a guide in selecting the factors for this study. Inputs Processes Outputs Figure 1: A conceptual model for school effects research Participation Teaching quality Attitudes, Aspirations Achievement Instructional quality Curriculum quality Fiscal, other resources Resources Teacher quality Student background School quality
  • 4. M. Najib, Rohani & Ebrahim / Journal Educational Psychology and Counseling (2011) 288 The model contains three main components: inputs, processes and outputs. The inputs refer to the human and financial resources available to education. Processes refer to what is taught and how it is taught. In other words, processes reflect who delivers the instruction, and how the instruction is organized. Outputs refer to what students eventually learned. The inputs factors such as financial and physical resources, policy-related factors at national, state and school level directly affect the teaching and learning processes of teacher and school quality, which would directly have an effect on outputs. Moreover, students’ background at the inputs stage would directly affect teacher quality, teaching quality and school quality and instructional quality in the processes stage, which would eventually, effect the students’ achievement at the outputs stage. School quality in turn, has a direct effect on curriculum quality, teaching quality, and instructional quality. Finally, instructional quality has a direct effect on school outputs. This model is a multilevel model and constitutes three distinguishable levels: student-, classroom- and school-level, and it is deemed appropriate for the analysis of the TIMSS data. As shown in Figure 1, there are many factors which have either a direct or an indirect influence on students’ achievement. To consider all of these existing factors in one study was not possible, therefore, based on the model and research evidences only a few factors from student, classroom and school-level were selected to assess their effects on mathematics achievement. 4.0 LITERATURE REVIEW Learning and teaching process takes place in the classroom, which in turn is situated in school (Leung et al.,2006; Mullis et al., 2005; Oakes, 1989). School environment consists of various elements, ranging from the desk where students sit; to the student who sits next to him/her; and includes the teacher who stands in front of his/her classroom (Coleman et al., 1966; Creemers, 1994). Several studies have been conducted to answer the question of how much of the variance in mathematic achievement contributes to school-level differences. The results indicate that the proportion of the variance accounted by school-level differences vary across countries. Park and Park (2006) found that in South Korean about 4% of the total variance of mathematics achievement contributed to school-level factors. In contrast, it was 55% for South African students (Howie, 2006). Similarly, Fullarton (2004) reported that 27% and 47% of the variance of mathematics achievement of Australian students accounted for school-level factors in TIMSS 1995 and 1999, respectively. In Singapore 45%, Botswana, 27%, Chili, 35% and Flenders, 14% of the variance of mathematics achievement accounted for school-level factors (Chepete, 2008; Mohammadpour et al., 2009; Ramírez, 2006; Van den Broeck et al.,2006). Once the researchers had decomposed the total variance of mathematics achievement into student and school-level, they attempted to explain the proportion of the variance at each level by using relevant factors. Thus, some factors such as mathematics self-
  • 5. M. Najib, Rohani & Ebrahim / Journal Educational Psychology and Counseling (2011) 289 concept (Kiamanesh, 2004a, 2004b; Ma & Kishor, 1997; Mullis et al., 1997; Mullis et al., 2000; Papanastasiou, 2008; Reyes, 1984; Wilkins, 2004), attitude towards mathematics (Cooper et al., 2001; Goodykoontz, 2008; Kiamanesh, 2006; Ma & Kishor, 1997), home educational resources (Bos & Kuiper, 1999; Coleman et al., 1966; Fullarton, 2004; Howie, 2003; Jencks et al., 1972; Kiamanesh & Mahdavi, 2008) were examined nationally and internationally and the results indicated that there is a positive association between students’ achievemnt with mathematics self-concept and attitude towards mathematics. In addition, a number of school and classroom-level factors such as the location of the school (Chepete, 2008; Howie, 2006; Ramírez, 2006), school climate (Bevans et al., 2007; Cohen et al.,2009; Mullis et al., 2008; Mullis et al., 2004; Papanastasiou & Papanastasiou, 2006), and school resources for mathematics instruction (Ramírez, 2006) were explored to assess the effects of these factors on achievement and it was found that there is a positive relationship between achievement with the location of the school and school climate. 4.0 METHODOLOGY Sample TIMSS used a two-stage stratified cluster sampling design. Schools were sampled using a systematic probability-proportional-to-size (PPS), and then one or two classrooms per school were selected (Martin, Mullis, & Chrostowski, 2004). In Malaysia, only one intact classroom was selected among all eighth-graders classrooms within the selected schools. The number of students within a classroom ranged from 19 to 49 with 35 students per classroom on average. All together, the samples from Malaysia were 5314 students, 150 mathematics teachers and 150 school principals participated in TIMSS 2003 study. Singapore added a third sampling stage to the TIMSS’s basic two stage and students were selected at random from two classrooms within each selected school. The minimum number of students per classroom was 8 and the maximum was 23 with an average of 18 students per classroom. Thus, a total of 6018 students, 320 mathematics teachers and 160 school principals who participated in TIMSS 2003 were used as samples in Singapore. Variables Dependent or predicted variable TIMSS used a test to measure students’ mathematics achievement. Four different types of scores were obtained from the test for individual students: raw scores, standardized scores, national Rasch scores and plausible values or multiple imputation scores (Foy & Olson, 2009). In order to extend the coverage of mathematics curriculum and measuring
  • 6. M. Najib, Rohani & Ebrahim / Journal Educational Psychology and Counseling (2011) 290 the trends across TIMSS studies, the TIMSS centre used a large number of mathematics items (190 items). Since the implementation of all 190 items on individual student was not possible, a matrix-sampling design was used to assemble the items into different booklets. Each student sat for a test using only one booklet which included a subtest of all the possible items. TIMSS used Item Response Theory (IRT) scaling to describe students’ achievement in the test (Olson et al., 2008). The raw scores were computed based on student’s score to the individual items in the booklet. Since students had to answer different items, their difficulty index is not comparable among the students and the raw scores are not reliable for comparison purposes. The raw scores were standardized to a score with a mean of 50 and a standard deviation of 10 within each country. Because of the reasons mentioned above, comparison among students based on standardized scores is still not reliable enough. The national Rasch scores were standardized to have a mean of 150 and a standard deviation of 10 within each country. Finally, the plausible values are an estimate of how a student might have performed if all 190 items were administered to the student. TIMSS estimated five plausible values for individual students based on their responses to a subtest of the items. The plausible values for any given scale are the best available measures of students’ achievement on that scale in TIMSS database (Foy & Olson, 2009). Thus, the average of the five plausible values was obtained, and it served as the dependent or predicted variable in this study. Independent or predictors variables Mathematics self-concept, attitude towards mathematics and home educational resources are the three student-level factors derived from the Students’ Questionnaire. School climate as perceived by the mathematics teachers is a classroom-level factor gained from the Mathematics Teachers Questionnaire. In addition, school climate as perceived by school principals, availability of school resources for mathematics instruction, good attendance at school and the location of the school are the school-level factors obtained from the School Questionnaire. The full characteristics of these factors including items, scale, coding and amount of missing values in each item are presented in Appendix B. Data Consideration Normal distribution The HLM computer package (Raudenbush et al., 2004) produces residual files that could be used to check the distributional assumptions of the data before running the final model. In this study, a probability plot (Q-Q) was used to check the assumption of a normal distribution of the dependent variable. Appendix C displays Q-Q plots for residual errors of students’ mathematics achievement of both countries. The plots are
  • 7. M. Najib, Rohani & Ebrahim / Journal Educational Psychology and Counseling (2011) 291 approximately linear. This indicates that there is no serious departure from the normal distributions. Missing data Missing data are ubiquitous in social and behavioral sciences research due to a variety of reasons (Allison, 2002; Cool, 2000; Dow & Eff, 2009; Enders, 2010; Longford, 2008; Tabachnik & Fidell, 2007) and the TIMSS data are not an exception of missing values. A serious question with regard to missing data is whether missing data is a function of a random or a systematic process (Meyers et al., 2006). If the data are missing completely at random, then deleting cases with missing values does not bias the estimates (Gelman & Hill, 2007), but such strong assumption is rarely satisfied. In these situations, missing values should be modeled to get good estimates of parameters of interest (Allison, 2002; Gelman & Hill, 2007). The next important question concerning missing data is how much data are missing. Tabachnik and Fidell (2007) suggested that if only a few data (i.e., 5% or less) are missing in random from a large data, the problems are less serious and almost any procedure for handling missing values yields similar results. As shown in Appendix B, the amount of missing values in all the items are far less than the size suggested by Tabachnik and Fidell (2007). Missing data is more complicated in multilevel structured data, because it may occur at more than one level. In the case of two-level multilevel modeling, for example, if a level-2 unit (e.g., school) has missing data and then excluded from the analysis, thus, all the observations (e.g., students) that are nested within that unit will be excluded from the analysis (Gibson & Olejnik, 2003). There are only a small amount of missing values in the data being analyzed (Appendix B) and the sample sizes at all the levels of analysis are relatively large (Hox, 2009). However, instead of deleting cases or variables with missing values, the expectation maximization (EM) which is one imputation methods of treating missing data was used to deal with missing values (for detail about imputation methods of missing values see for example; Enders, 2010; Little & Rubin, 2002; Peugh & Enders, 2004; Roth et al., 1999; Rubin et al., 2007). Weighting issue As mentioned earlier, TIMSS used a two-stage cluster sampling design rather than a simple random sampling. The probability of selection of sample units at both stages is unequal and sampling weight issue must take into consideration to avoid bias in parameters estimates (Asparouhov, 2005; Dargatz & Hill, 1996; Rabe-Hesketh & Skrondal, 2006; Rutkowski et al., 2010; Thomas & Heck, 2001; Willms & Smith, 2005). TIMSS computes several weighting variables (e.g., TOTWGT, total student weight, SENWGT, student senate weight, MATWGT, mathematics teacher weight). According to Rutkowski et al. (2010), if the data involved in a study is taken from more than one country, student senate weight (SENWGT) should be used. Thus, SENWGT,
  • 8. M. Najib, Rohani & Ebrahim / Journal Educational Psychology and Counseling (2011) 292 mathematics teacher’s weight (MATWGT) and total school weight (SCHWGT) was used at student classroom and school-level, respectively. Centering issue Centering or scaling of independent factors in multilevel analysis refers to subtracting a mean from all individual raw scores on any independent variable and change the raw metric into deviance from the mean score (Tabachnik & Fidell, 2007; Wu & Wooldridge, 2005). According to Kreeft and de Leeuw (1998) the practical purpose of centering an independent variable, is to change the interpretation of the intercept. In multilevel modeling (regression analysis generally), the intercept is defined as the expected score on the dependent variable for someone whose scores on all independent variables in the model are zero (Raudenbush & Bryk, 2002). In social sciences, usually variables have no meaningful zero (Kreeft & de Leeuw, 1998), in such situations, by transferring the independent variables, the intercept will be interpreted as expected score on the dependent variable for someone whose scores on independent variables equal to the group mean or grand mean depending on the type of centering approaches that is used. The HLM program (Raudenbush et al.,2004) for analysis of multilevel data provides three options to deal with centering of level-l variable. They are (a) raw metric (uncentered) variable (b) group mean centered and (c) grand mean centered variable. Grand mean centering is the most common method used in multilevel modeling (Enders & Tofighi, 2007; Hox, 2002). Grand mean reduces the multicollinearity among predictors (Hofmann & Gavin, 1998; Kreft, de Leeuw, & Aiken, 1995; Tabachnik & Fidell, 2007). Thus, grand mean centering was used for all the predictor factors in this study. Data Analysis The general idea of multilevel modeling is individuals (e.g., students) interact with the contexts (e.g., classroom or school) that they belong to. Students’ characteristics are influenced by classroom or school, and the classroom or school in turn influence students’ performance. Students and the schools that they belong to are generally conceptualized as hierarchical or multilevel system in which the individuals and the context make up the separate levels of this hierarchy system (Hox, 2002). The TIMSS data have a nested or multilevel structured in which students are nested within classrooms and classrooms in turn nested within schools. It is worth mentioning that however, TIMSS data in nature make three levels (student, classroom and school), because only one classroom per school was sampled in Malaysia, it is not possible to assess the effects of different classrooms within schools. Whereas, individual student was sampled at random from two classrooms within each selected school in Singapore and it provided the possibility of comparing students’ mathematics achievement across
  • 9. M. Najib, Rohani & Ebrahim / Journal Educational Psychology and Counseling (2011) 293 classrooms within schools. Thus, a two and three-level multilevel modeling approach was employed for analyzing the data from Malaysia and Singapore, respectively using HLM6.07 (Raudenbush et al., 2004). 5.0 RESULTS The results are presented based on research questions for each country separately. Malaysia Research question 1: How much of the total variance in mathematics achievement of Malaysian students accounted for student and school-level differences? The unconditional or null model was estimated to provide the answer for this research question. This model gives a statistical index which is so-called “intraclass correlation coefficient” (ICC). It is defined as the proportion of the total variance of the dependent variable that attribute to the higher level of the model which is school in the present study (Browne & Rasbash, 2004; Field, 2009; Heck & Thomas, 2000; Raudenbush & Bryk, 2002). The ICC is usually expressed by ρ (rho) and given by this formula  = ). Where, represents the proportion of the total variance at the school level and represents the proportion of the total variance at the student level. Thus, the ICC for mathematics achievement of Malaysian students was 2793.31 / (2793.31+2083.40) = 0.5728. This indicated that 57.28% of the total variance of mathematics achievement accounted for school-level and 42.72% (1-0.5728) by student-level differences. Student-level models Research question 2: How much of the student-level variance in mathematics achievement of Malaysian students is associated with mathematics self-concept, attitude towards mathematics and home educational resources factors? To assess the effect of individual factors on mathematics achievement, the factors were added to the model separately and the results are presented in Table A.1 of Appendix A. Mathematics self-concept was added to the model first (model 1). This factor accounted for 14.36% of student-level variance of mathematics achievement. The effect of mathematics self-concept on achievement was statistically significant (γ10 = 32.08, p < 0.001). This indicates that students with one scale-point higher on self-concept tend to achieve 32 points higher in mathematics. Mathematics self-concept served as a random effect and the result indicated that the relationship between self-concept and mathematics achievement varied significantly from school to school (u1j= 75.28, p < 0.05).
  • 10. M. Najib, Rohani & Ebrahim / Journal Educational Psychology and Counseling (2011) 294 Attitude towards mathematics was the second factor that entered to the model (model 2). Attitude accounted for a negligible amount of the variance (0.69) when the effect of mathematics self-concept was controlled. The effect of attitude was statistically significant (γ20 = 6.72, p < 0.001). One scale-point increase in positive attitude towards mathematics increases achievement by 6.72 points. The relationship between attitude towards mathematics and achievement varied significantly from school to school (u2j= 47.86, p < 0.05). An index of home educational resources was the last factor that added to the model (model 3). Model 3 accounted for only a small proportion of the variance (0.002) controlling for mathematics self-concept and attitude towards mathematics. The effect of home educational resources was not statistically significant (γ30 = 3.70, p > 0.05). School-level models Research question 3: How much of the school-level variance in achievement of Malaysian students is associated with school climate, school resources, good attendance at school and the location of the school factors? The location of the school was the first factor added to the model (model 4). The contribution of this factor to the school-level variance was 5%. The effect of the location of the school was statistically significant (γ01= 25.19, p < 0.05). This indicated that students from urban schools achieved higher scores in mathematics than their peers from rural schools by 25.19 points. School climate as perceived by the school principals was the second factor that added to the model (model 5). This model accounted for 4.77% of the school-level variance after controlling for the location of the school. Mathematics achievement affected significantly by this factor (γ02= 19.97, p < 0.05). Average mathematics achievement was higher by 19.97 points in schools where the principals described the climate of the school positively. School climate as perceived by the mathematics teachers was also a significant factor on achievement (model 6). It accounted for 5% of the school-level variance controlling for the location of the school and school climate as perceived by the school principals. The effect of this factor on mathematics achievement was statistically significant (γ03 = 21.47, p < 0.05). Average mathematics achievement was higher by 21.47 points in schools where the mathematics teachers described the climate of the school positively. School resources for mathematics instruction and good attendance at school were the last two factors that added to model 7 and 8, respectively. The school resources factor accounted for 3.78% of the school-level variance after controlling for the location of the school and school climate as perceived by both the school principals and mathematics teachers. The association between this factor and mathematics achievement was significantly negative (γ04 = -13.92, p < 0.05). Average mathematics achievement decreased by 13.92 points in schools with one scale-point more shortage in resources for mathematics instruction.
  • 11. M. Najib, Rohani & Ebrahim / Journal Educational Psychology and Counseling (2011) 295 Good attendance at school explained 1.21% of the school-level variance of mathematics achievement after controlling the factors location of the school, school climate as perceived by both the school principals and mathematics teachers and school resources. The association between these factor with mathematics achievement was also negative, but it was not statistically significant (γ05= -18.49, p > 0.05). In order to assess the effects of student and school-level factors on achievement simultaneously, all the factors were added to the model (full model). The full model accounted for 14% of the student-level variance and 25% of the school-level variance in achievement. Singapore Research question 4: How much of the total variance in mathematics achievement of Singaporean students accounted for student, classroom and school-level differences? The unconditional model was estimated to provide answer for this research question (Appendix A, Table A.2, null model). The ICC at each level is: For the student level, / ( ) = 1165.67/ (1165.67+4496.51+358.13) = 0.193 For the classroom level, / ( ) = 4496.51/ (1165.67+4496.51+358.13) = 0.746 For the school level, / ( ) = 358.13/ (1165.67+4496.51+358.13) = 0.059. The results indicated that 19.3%, 74.6% and 5.9% of the total variance in mathematics achievement of Singaporean eighth-graders accounted for student, classroom and school-level differences, respectively. Student-level models Research question 5: How much of the student-level variance in mathematics achievement of Singaporean students is associated with mathematics self-concept, attitude towards mathematics and home educational resources factors? Three models were estimated to answer this research question and the results are given in Appendix A, Table A.2. Again, mathematics self-concept was the first factor that was entered to the model as a random effect (model 1). It accounted for 22.77% of the total student-level variance. Mathematics self-concept affected achievement significantly (γ100= 24.23, p < 0.001). The relationship between self-concept and mathematics achievement varied significantly from classroom to classroom within schools (u00k = 28.41, p < 0.05), but it was not from school to school (u10k = 3.95, p > 0.05).
  • 12. M. Najib, Rohani & Ebrahim / Journal Educational Psychology and Counseling (2011) 296 Attitude towards mathematics was added to the second model (model 2). Attitude accounted for 5.33% of the student-level variance controlling for mathematics self-concept. The association between attitude towards mathematics and achievement was statistically significant (γ200= 10.87, p < 0.001). Home educational resources factor was introduced to the model (model 3). Model 3 accounted for a negligible amount (0.33) of the student-level variance when mathematics self-concept and attitude towards mathematics were controlled. The effect of home educational resources on achievement was statistically significant (γ300 = 11.01, p < 0.001). Classroom-level model Research question 6: How much of the classroom-level variance in mathematics achievement of Singaporean students is associated with school climate as perceived by the mathematics teachers? Model 4 was estimated with school climate as perceived by the mathematics teachers. This model accounted for 3.50% of the total classroom-level variance of mathematics achievement. The effect of this factor on achievement was statistically significant (γ010= 20.49, p < 0.05). This indicated that, on average, mathematics achievement in classrooms where teachers described the climate of the school positively; was higher by 20.49 points than other classrooms. School-level models Research question 7: How much of the school-level variance in mathematics achievement of Singaporean students is associated with school climate as perceived by the school principals, school resources for mathematics instruction and good attendance at school factors? School climate as perceived by the school principals was the first factor that was added to the model (model 5). This factor contributed to a substantial (54.53%) proportion of the school-level variance in mathematics achievement. The effect of school climate as perceived by the school principals on achievement was statistically significant (γ001= 29.70, p < 0.001). Model 6 was estimated by adding school resources for mathematics instruction. Model 6 accounted for 17.30% of the school-level variance after controlling for school climate as perceived by the school principals. However, the effect of school resources on achievement was not significant (γ002= -13.54, p > 0.05). Model 7 was estimated by adding the factor of good attendance at school; it explained 3.42% of the school-level variance after controlling for school climate as perceived by the school principals and
  • 13. M. Najib, Rohani & Ebrahim / Journal Educational Psychology and Counseling (2011) 297 school resources for mathematics instruction. The effect of good attendance at school also was not statistically significant (γ003= -4.33, p > 0.05). A full model was estimated by adding all the factors from the three levels. The full model was accounted for 27.13%, 15.62% and 35.36% of the variances at student, classroom and school-level, respectively. 6.0 DISCUSSION The results indicated that 57.28% of the total variance in mathematics achievement of Malaysian eighth-graders accounted for school-level differences. Likewise, a greater proportion of the variance in mathematics achievement in the Singapore sample was attributed to classroom and school-level differences (74.6% to classroom level and 5.9% to school-level). This is one the key results of the study and it indicated that schools make a difference in students’ achievement in both countries. An interesting finding of this study is not only that mathematics achievement of Singaporean students differed from school to school, but it also differed substantially from a classroom to another within a school. It is more important for Singaporean students to be placed in a particular classroom within a school rather than being assigned to a school they are placed in. According to Anderson (1991), school effectiveness depends to a great extent on teacher effectiveness. Teachers have absolute veto power over innovation and change even in the most highly centralized educational system. Therefore, what happens in classrooms could be accounted for this great difference in students’ achievement. School effects on students’ academic achievement have been subjected to a considerable debate among educational researchers for a long time. Early studies, for example, Coleman et al. (1966) and Jencks et al.(1972) on school effectiveness revealed that the effects of school on students’ academic achievement is relatively small compared to the effects of students characteristics and family background. Following Coleman et al.’s (1966) report, several studies Chepete (2008), Fullarton (2004), Howie (2006) and Park and Park (2006) for example, have been done to assess the effects of school on mathematics achievement of students. It was found that a sizeable proportion of the total variance in mathematics achievement attributed to school-level differences. The proportion of the variance that attributed to school-level differences in this study is beyond the range found in recent studies. The findings of this study added evidence to those from previous studies that schools make a difference in students’ academic achievement. This findings have key implications for educational policy-makers, because, school has control over most of the classroom and school-level factors such as those examined in this study. On the other hand, student-level factors (e.g., home educational resources and other family background factors) are not under the control of school. Mathematics self-concept, attitude towards mathematics and home educational resources altogether accounted for 15.32% of the total variance in mathematics achievement of the Malaysians at the student level. In contrast, these three factors
  • 14. M. Najib, Rohani & Ebrahim / Journal Educational Psychology and Counseling (2011) 298 accounted for 28.43% of the total variance in mathematics achievement of the Singaporean students at the student-level. This indicated that these factors are more effective on achievement of Singaporean students than for the Malaysians. Mathematics self-concept among other student-level factors was the most influential factor on achievement of students from both countries. This confirms the findings by Howie (2003), Kiamanesh, (2004b; 2005), Ma and Kishor (1997), Papanastasiou (2008), Wilkins (2004). The effect of mathematics self-concept on achievement differed for the Malaysians and Singaporeans. Mathematics self-concept was more effective for the Singaporeans in terms of the explained variance, but the association between this mathematics self-concept and achievement was stronger for the Malaysians. Attitude towards mathematics was the second strongest factor that affected achievement of Malaysian students positively, whereas it was the third strongest factor in the Singaporeans achievement. Attitude towards mathematics was more effective factor on achievement of Singaporean students than the Malaysians. Home educational resources had no significant effect on achievement of Malaysia students as it did for the Singaporeans, although the contribution of this factor to the variance in achievement of Singaporean students was very low. This is an interesting finding especially for Malaysian students. Because generally, Singaporeans have an advantage of having home educational resources more than Malaysian, but the contribution of home educational resources was negligible to the variance of mathematics achievement of the Singaporeans. The five factors of the location of the school, school climate (both perceived by the mathematics teachers and the school principals), school resources for mathematics instruction and good attendance at school accounted for 19.76% of the total variance of Malaysian students at school-level. On the other hand, the three factors of school climate as perceived by the school principals, school resources and good attendance at school explained 75.25% of the total variance at school-level. The location of the school had a great effect on mathematics achievement of Malaysian students where students from urban schools performed much better than those from rural schools. This result is consistent with Howie’s (2006) findings. This result was expected because rural students are more disadvantaged than urban students in terms of family background and having access to limited educational resources. Singapore is an urban based country, thus the location of the school was not a factor in Singapore. School climate as perceived by school principals was the most influential factor for both countries. However, this factor accounted for a substantial proportion of the variance in achievement of Singaporean students than the Malaysians. School resources for mathematics instruction had no significant effect for the Singaporeans whereas, it did for Malaysians. One possible explanation for this finding is probably that all Singaporean schools are well equipped with instructional resources such as computer, audio-visual resources and library materials. In contrast, Malaysian schools are different to some extent in terms of the availability of resources for mathematics instruction.
  • 15. M. Najib, Rohani & Ebrahim / Journal Educational Psychology and Counseling (2011) 299 6.0 CONCLUSION The results of this study revealed that mathematics achievement of Malaysia eighth- graders is motivated mainly by differences from school to school. Mathematics achievement of Singaporean eighth-graders is motivated mainly by differences from classroom to classroom within school. Mathematics self-concept among other student- level factors was the most influential factor on achievement of students from both countries. The location of school among other school-level factors was the most influential factor on achievement of Malaysian students. This was followed by school climate as perceived by the school principals. For the Singaporeans, school climate as perceived by the school principals among other school-level factors was the most influential factor. Shortage of school resources for mathematics instruction affected mathematics achievement of Malaysian students negatively, whereas it was a significant factor for the Singaporeans. REFERENCES Allison, P. D. (2002). Missing data, series: quantitative applications in the social sciences: Sage, Publication.Inc. Anderson, L. W. (1991). Increasing teacher effectiveness. Paris: UNESCO. Asparouhov. T. (2005). Sampling Weights in Latent Variable Modeling. Structural Equation Modeling, 12(3), 411–434. Bevans, K., Bradshaw, C. P., Miech, R., & Leaf, P. J. (2007). Staff- and School-Level Predictors of School Organizational Health: A Multilevel Analysis. Journal of School Health, 77, 294 - 302. Bos, K., & Kuiper, W. (1999). Modelling TIMSS Data in a European Comparative Perspective: Exploring Influencing Factors on Achievement in Mathematics in Grade 8. Educational Research and Evaluation, 55. Browne, W. J., & Rasbash, J. (2004). Multilevel Modelling. In M. A. Hardy & A. Bryman (Eds.), Handbook of data analysis. London: Thousand Oaks: Sage. Carroll, J. B. (1963). A model for school learning. Teacher College Record, 64, 723- 733. Chepete, P. (2008). Modeling of the Factors Affecting Mathematical Achievement of Form 1 Students in Botswana based on the 2003 Trends in International Mathematics and Science Study. Unpublished Doctor of Philosophy, Indiana University. Cohen, J., McCabe, L., Michelli, N. M., & Pickeral, T. (2009). School Climate: Research, Policy, Practice, and Teacher Education. Teachers College Record, 111, 180-213. Coleman, J. S., Compbell, E. Q., Hobson, C. J., Mcpartland, J., Mood, A. M., Weinfeld, F. D., et al. (1966). Equality Of Educational Opportunity. Washington DC: Department of Helth, Education & Welfare Office of Education.
  • 16. M. Najib, Rohani & Ebrahim / Journal Educational Psychology and Counseling (2011) 300 Cool, A. L. (2000). A Review of Methods for Dealing with Missing Data. Paper presented at the Paper presented at the annual meeting of the Southwest Educational Research Association, Dallas Cooper, H., Jackson, K., Nye, B., & Lindsay, J. J. (2001). A model of homework’s influence on the performance evaluations of elementary students. The Journal of Experimental Education, 69(2), 181–191. Creemers, B. P. M. (1994). The effective classroom. London: Cassell. Dargatz, D. A., & Hill, G. W. (1996). Analysis of survey data. Preventive Veterinary Medicine, 28, 225-237. Dow, M. M., & Eff, E. A. (2009). Multiple Imputation of Missing Data in Cross- Cultural Samples. Cross-Cultural Research, 43(3), 206-229. Enders, C. K. (2010). Applied Missing Data Analysis: The Guilford Press. Enders, C. K., & Tofighi. D. (2007). Centering Predictor Variables in Cross-Sectional Multilevel Models: A New Look at an Old Issue. Psychological Methods, 12(2), 121–138. Field, A. (2009). Discovering statistics using SPSS (3rd ed.). London SAGE Publications. Foy, P., & Olson, J. F. (2009). TIMSS 2007 User Guide for the International Database Fullarton, S. (2004). Closing the gaps betweeen schools, accounting for variation in mathematics achievement in Australian schools using TIMSS 95 and TIMSS 1999. Paper presented at the The 1st IEA International Research Conference, IRC-2004 Gage, N., & Berliner, D. (1992). Educational psychology (5th ed ed.): Princeton, New Jersey: Houghton Mifflin Company. Gelman, A., & Hill, J. (2007). Data Analysis Using Regression and Multilevel/Hierarchical Models. New York: Cambridge University Press. Gibson, N. M., & Olejnik, S. (2003). Treatment of missing data at the second level of hierarchical linear models. Educational and Psychological Measurement., 63., 204. Goodykoontz, E. N. (2008). Factors that Affect College Students’ Attitude toward Mathematics. Unpublished PhD, Morgantown, West Virginia. Heck, R. H., & Thomas, S. L. (2000). An Introduction to Multilevel Modeling Techniques Quantitative Methodology Series: Lawrence Erlbaum Associates, Inc. Hofmann, D. A., & Gavin, M. B. (1998). Centering Decisions in Hierarchical Linear Models: Implications for Research in Organizations. Journal of Management, 24, No. 5, 623-641. Howie, S. (2003). Language and other background factors affecting secondary pupils' performance in Mathematics in South Africa. African Journal of Research in SMT Education, 7, 1-20.
  • 17. M. Najib, Rohani & Ebrahim / Journal Educational Psychology and Counseling (2011) 301 Howie, S. (2006). Multi-level Factors Affecting the Performance of South African Pupils in Mathematics. In S. Howie & T. Plomp (Eds.), Contexts of Learning Mathematics and Science(pp.157-176): Routledge. Hox, J. J. (2002). Multilevel Analysis Techniques and Applications: Mahwah, NJ : Lawrence Erlbaum. Hox, J. J. (2009). Multilevel Analysis Techniques and Applications (2 ed): Routledge. Huitt, W. (1995). A systems model of the teaching/learning process. Educational Psychology Interactive. Huitt, W. (2003). A transactional model of the teaching/learning process. Educational Psychology Interactive. Jencks, C., Smith, M. S., Ackland, H., Bane, M. J., Cohen, D., Grintlis, H. et al. (1972). Inequality. New York: Basic Books. Kiamanesh, A. R. (2004a). Factor affecting Iranian students’ achievement in mathematics. Paper presented at the the IRC-2004 TIMSS Cyprus University, Nicosia. Kiamanesh, A. R. (2004b). Self-Concept, Home Background, Motivation, Attitude, Attribution and Their Effects on Iranian Students’ Science Achievement. Paper presented at the The Third International Biennial SELF Research Conference. Kiamanesh, A. R. (2006). The Role of Students’ Characteristics and Family Background in Iranian Students’ Mathematics Achievement. In S. Howie & T. Plomp (Eds.), Contexts of Learning Mathematics and Science: Routledge. Kiamanesh, A. R., & Mahdavi, H. M. (2008). Influential Factors causing the gender differences in mathematics’ achievement scores among Iranian Eight graders based on TIMSS 2003 data. Paper presented at the The 3rd IEA International Research Conference (IRC-2008) Kreeft, I. G. G., & de Leeuw, J. (1998). Introducing multilevel modeling: London: Sage Publication Ltd. Kreft, I. G. G., de Leeuw, J., & Aiken. L. S. (1995). The Effect of Different Forms of Centering in Hierarchical Linear Models. Multivariate Behavioral Research, 30(1), 1-21. Kupari. P. (2006). Student and School Factors Affecting Finnish Mathematics Achievement: Results from TIMSS 1999 Data. In S. Howie & T. Plomp (Eds.), Contexts of Learning Mathematics and Science: Routledge. Leung, F. K. S., Graf, K. D., & Lopez-Real, F. J. (2006). Mathematics Education in Different Cultural Traditions: A Comparative Study of East Asia and the West (Vol. 9): Springer. Little. R. J. A, & Rubin, D. B. (2002). Statistical analysis with missing data: Wiely. Longford, N. T. (2008). Missing Data. In J. De Leeuw & E. Meijer (Eds.), Handbook of Multilevel Analysis: Springer, Science+Business Media, LLC. Ma, X., & Kishor, N. (1997). Attitude toward Self, Social Factors, and Achievement in Mathematics: A Meta-Analytic Review. Educational Psychology Review, 9, 89- 120.
  • 18. M. Najib, Rohani & Ebrahim / Journal Educational Psychology and Counseling (2011) 302 Maccoach, D. b., & Black. A. C. (2008). Evaluation of Model Fit and Adequecy In O'Connell. A. A & McCoach. D. B (Eds.), Multilevel Modeling of Educational Data IAP: Information Age Publishing, Inc. Martin, M. O., Mullis, I. V. S., & Chrostowski, S. J. (2004). TIMSS 2003 Technical Report: TIMSS & PIRLS International Study Center, Lynch School of Education, Boston College. Mohammadpour, I., Moradi, G. F., & Najib Abdul Ghafar, M. (2009). Modeling affecting factors on mathematics performance for Singaporean eight- grades students based on TIMSS 2007. Paper presented at the Proceedings of 2009 International Conference on Social Science and Humanities (ICSSH 2009), Singapore. Mullis, I. V. S., Martin, M. O., Beaton, A. E., Gonzalez, E. J., Kelly, D. L., & Smith, T. A. (1997). TIMSS 1995 International Mathematics Achievement in the Primary School Years: Center for the Study of Testing, Evaluation, and Educational Policy, Boston College. Mullis, I. V. S., Martin, M. O., & Foy, P. (2008). TIMSS 2007 International Mathematics Report: International Association for the Evaluation of Educational Achievement (IEA). Mullis, I. V. S., Martin, M. O., Gonzalez, E. J., & Chrostowski, S. J. (2004). TIMSS 2003 International Mathematics Report: International Association for the Evaluation of Educational Achievement (IEA). Mullis, I. V. S., Martin, M. O., Gonzalez, E. J., Gregory, K. D., Garden, R. A., O’Connor, K. M., et al. (2000). TIMSS 1999 International Mathematics Report: International Association for the Evaluation of Educational Achievement (IEA). Mullis, I. V. S., Martin, M. O., Olson, J. F., Berger, D. R., Milne, D., & Stanco, G. M. (2008). Timss 2007 Encyclopedia: A Guide to Mathematics and Science Education Around the World (Vol. 2): TIMSS & PIRLS International Study Center, Lynch School of Education, Boston College. Mullis, I. V. S., Martin, M. O., Ruddock, G. J., O’Sullivan, C. Y., Arora, A., & Erberber, A. E. (2005). TIMSS 2007 Assessment Frameworks: TIMSS & PIRLS International Study Center, Lynch School of Education, Boston College. Noor Azina Ismail, & Halimah Awang. (2009). Mathematics Achievement among Malaysian Students: What Can They Learn from Singapore? International Education Studies, 2, 9-17. Oakes, J. (1989). What Educational Indicators? The Case for Assessing the School Context. Analysis Educational Evaluation and Policy. Orme, J. G., & Orme.T. (2009). Multiple Regression with Discrete Dependent Variables: Oxford University Press. Papanastasiou, C. (2008). A residual analysis of effective schools and effective teaching in mathematics. Studies in Educational Evaluation, 34, 24-30.
  • 19. M. Najib, Rohani & Ebrahim / Journal Educational Psychology and Counseling (2011) 303 Papanastasiou, C., & Papanastasiou, E. C. (2006). Modeling Mathematics Achievement in Cyprus. In S. Howie & T. Plomp (Eds.), Contexts of Learning Mathematics and Science: Routledge. Park.C, & Park. D. (2006). Factors Affecting Korean Students’ Achievement in TIMSS 1999. In S. Howie & T. Plomp (Eds.), Contexts of Learning Mathematics and Science: Routledge. Peugh, J. L., & Enders, C. K. (2004). Missing Data in Educational Research: A Review of Reporting Practices and Suggestions for Improvement. Review of Educational Research, 74(4) 525–556. Proctor, C. P. (1984). Teacher expectations: A model for school improvement. The Elementary School Journal Asiatique, 84, 469-481. Quek Gary, Kien Huay Goh, Yeen Peng Yen, Yueh Mei Liu, Quee Leng Tan, Tan Ying Chin, et al. (2008). Singapore. In I. V. S. Mullis, Martin. M. O, Olson. J. F, Berger. D. R, Milne. D & Stanco. G. M (Eds.), Timss 2007 Encyclopedia: A Guide to Mathematics and Science Education Around the World (Vol. 2). Rabe-Hesketh, S., & Skrondal, A. (2006). Multilevel modelling of complex survey data. Royal Statistical Society, 169, Part 4, 805–827. Ramírez, M. J. (2006). Factors Related to Mathematics Achievement in Chile. In S. Howie & T. Plomp (Eds.), Contexts of Learning Mathematics and Science: Routledge. Raudenbush, S. W., & Bryk, A. S. (2002). Hierarchical linear models: Application and data analysis methods (Second ed.): Thousand Oaks,CA:Sage. Raudenbush, S. W., Bryk, A. S., Cheong, Y. F., Congdon, R., & Toit, M. (2004). HLM6 Hierarchical linear & nonlinear modeling: Application and data analysis methods.: SSI Scientific software international, Inc. Reyes, L. H. (1984). Affective variables and mathematics education. The Elementary School Journal Asiatique, 84, 558-581. Roth, P. L., Switzer, F. S. I., & Switzer, D. M. (1999). Missing Data in Multiple Item Scales: A Monte Carlo Analysis of Missing Data Techniques. Organizational Research Methods, 2(3) 211-232. Rubin, L. H., Witkiewitz. K, Andre. J. S, & Reilly. S. (2007). Methods for Handling Missing Data in the Behavioral Neurosciences: Don’t Throw the Baby Rat out with the Bath Water. The Journal of Undergraduate Neuroscience Education (JUNE),, 5(2), A71-A77. Rutkowski. L, Gonzalez, E., Joncas. M, & von Davier, M. (2010). International Large- Scale Assessment Data: Issues in Secondary Analysis and Reporting. Educational Researcher, 39(3), 142-151. Shavelosn, R., McDonnell, L., Oakes, J., Carey, N., & Picus, L. (1987). Indicators systems for Monitoring Mathematics and Science Education. Snijders, T. A. B., & Bosker, R. J. (1999). Multilevel Analysis:An Introduction to Basic and Advanced Multilevel Modeling (1st ed.): Thousand Oaks: Sage Publications.
  • 20. M. Najib, Rohani & Ebrahim / Journal Educational Psychology and Counseling (2011) 304 Stevens.J. (2002). Applied multivariate statistics for the social sciences (4th ed.): Lawrence Erlbaum Associates, Inc. Tabachnik, B. G., & Fidell, L. S. (2007). Using Multivariate Statistics. (Fifth ed.): Pearson Education,Inc. Thomas, S. L., & Heck, R. H. (2001). Analysis of Large-Scale Secondary Data in Higher Education Research: Potential Perils Associated with Complex Sampling Designs. Research in Higher Education, 42 (5), 517-540. Van den Broeck, A., Van Damme, J., & Opdenakker, M. C. (2006). The Effects of Student, Class and School Characteristics on TIMSS 1999 Mathematics Achievement in Flanders. In S. Howie & T. Plomp (Eds.), Contexts of Learning Mathematics and Science: Routledge. Walberg, H. J. (1984). Improving the productivity of America’s schools. Educational Leadership, 41, 19-27. Wilkins, J. L. M. (2004). Mathematics and Science Self-Concept: An International Investigation. The Journal of Experimental Education, 72(4), 331–346. Willms, J. D., & Smith, T. (2005). A manual for conducting analyses with data from TIMSS and PISA: Report prepared for UNESCO Institute for Statistics. Wu.Y, & Wooldridge. P. J. (2005). The impact of centering first-level predictors on individual and contextual effects in multilevel data analysis. Nursing research, 54(3), 212-216.