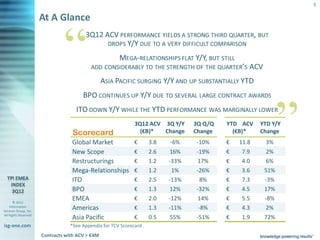
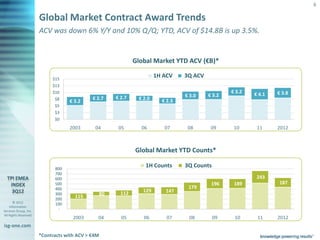
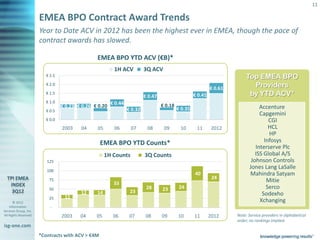
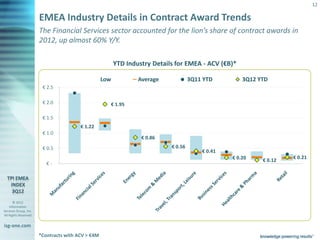
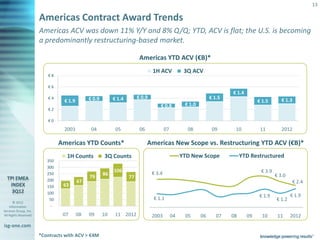
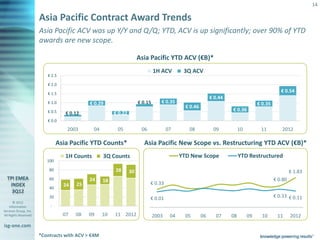
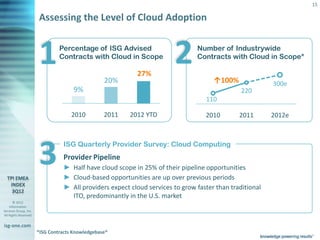
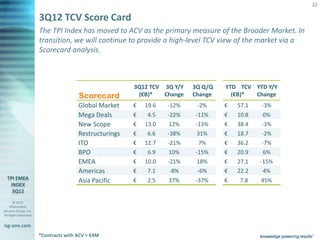
SlideShare a Scribd company logo
The TPI EMEA Index
EMEA Outsourcing Market Data and Insights

                      Third Quarter 2012


                               Hosted by:
                                John King
                          Barclays Capital


                        19 October 2012
2

                       Welcome to the 40th Quarterly Outsourcing Index Call
                       Covering the state of the outsourcing industry for global, commercial contracts.


                                                   Duncan Aitchison
                                                   Partner


                                                                 Bernd Schaefer
                                                                 Partner


       © 2012
    Information
Services Group, Inc.
All Rights Reserved


isg-one.com
                       *Contracts with ACV > €4M
3

                       Milestones
                       40th quarterly presentation signals a decade of TPI Index Conference Calls


                           Spring            Winter             Summer                Fall              Spring
                                                                                                                   Today
                            2003             2004                2005                2008                2011


                          Inaugural         Recognised         Identified the      Led in calling     Identified the
                         Global and       India-heritage     growing influence        out the        growing shift of
                            EMEA         providers as an     of restructurings,   industry-wide      sourcing growth
                         Index Calls     emerging entity    and their impact on      sourcing       towards emerging
                                        that would affect    service providers      downturn             markets
                                        how SPs compete


                                              The Index audience routinely includes 250 analysts,
                                                         clients and service providers.
       © 2012
    Information
Services Group, Inc.                                  The ISG Contracts Knowledgebase®
All Rights Reserved
                                                       exceeds 24,000 contract records.
isg-one.com
                       *Contracts with ACV > €4M
4

                       Refocusing on ACV as the Primary Measure of the Market
                       Going forward, an ACV-based analysis of the market will avoid masking the effects of
                       declining contract durations on TCV.


                                       TCV Change Over Time                                ACV Change Over Time
                                         Year-to-date at 3Q                                  Year-to-date at 3Q

                                       Growth since 2003 = 9%                              Growth since 2003 = 40%
                                                                          € 57                                                   € 12
                             € 52

                                                                                 €8


                             2003 04    05   06    07   08   09   10   11 2012   2003 04    05   06   07     08   09   10   11 2012
       © 2012
    Information
Services Group, Inc.
                                                                                                           Typical Quarterly ACV = €4B
All Rights Reserved                                                                                         Typical Annual ACV = €16B

isg-one.com
                       *Contracts with ACV > €4M
5

                       At A Glance


                                                               3Q12 ACV 3Q Y/Y     3Q Q/Q   YTD ACV    YTD Y/Y
                                     Scorecard                   (€B)*  Change     Change     (€B)*    Change
                                    Global Market              €      3.8   -6%    -10%     €   11.8    3%
                                    New Scope                  €      2.6    16%   -19%     €    7.9     2%
                                    Restructurings             €      1.2   -33%    17%     €    4.0     6%
                                    Mega-Relationships         €      1.2    1%    -26%     €    3.6    51%
                                    ITO                        €      2.5   -13%     8%     €    7.3    -3%
                                    BPO                        €      1.3    12%   -32%     €    4.5    17%

       © 2012
                                    EMEA                       €      2.0   -12%    14%     €    5.5    -8%
    Information
Services Group, Inc.
                                    Americas                   €      1.3   -11%    -8%     €    4.3     2%
All Rights Reserved
                                    Asia Pacific               €      0.5   55%    -51%     €    1.9    72%
isg-one.com                         *See Appendix for TCV Scorecard
                       *Contracts with ACV > €4M
6

                       Global Market Contract Award Trends
                       ACV was down 6% Y/Y and 10% Q/Q; YTD, ACV of $14.8B is up 3.5%.


                                                             Global Market YTD ACV (€B)*

                            $15
                                                                      1H ACV    3Q ACV
                            $13
                            $10                                                                  € 3.2   € 4.1   € 3.8
                                                     € 2.7                      € 3.0    € 3.2
                             $8              € 2.7            € 2.0     € 2.3
                                   € 3.2
                             $5
                             $3
                             $0
                                   2003       04      05       06        07      08       09      10      11     2012


                                                             Global Market YTD Counts*

                             800
                                                                 1H Counts      3Q Counts
                             700
                             600                                                                          243
                             500                                                          196     189            187
                             400                                                 179
                                                       112      129      147
                             300
                                      115      80
                             200
       © 2012                100
    Information
Services Group, Inc.           -
All Rights Reserved
                                     2003      04      05       06        07     08         09    10      11     2012
isg-one.com
                       *Contracts with ACV > €4M
7

                       Global Market Contract Trends for the Largest Deals
                       26 mega-relationships have been awarded YTD, surpassing total for all of 2011;
                       greater percentage of larger deal activity occurring in emerging markets.

                                                          YTD Contracts Counts with ACV > €80M
                                                                1H Counts            3Q Counts
                             30

                                                                 3                 6                                 8
                             20      9        10          5                                             6
                                                                         4                 4
                             10                                                                             5

                              0
                                   2003       04          05     06      07        08      09       10      11     2012

                                                      Emerging Markets
                                               Contract Counts with ACV > €40M

                                                                                                            Emerging Markets
                                                                                                 16 e       defined as outside
                                     8                                         8                            North
                                                    7                                                       American, Western
                                                                     4
                                                                                                            Europe and ANZ
       © 2012                                                                                               markets.
    Information
Services Group, Inc.
All Rights Reserved
                                   2008            2009          2010         2011          2012e
isg-one.com
                       *Contracts with ACV > €4M
8

                       EMEA Contract Award Trends
                       EMEA ACV was down 13% Y/Y but up 18% Q/Q; both restructuring and new scope
                       activity is down year to date.

                                                                           EMEA YTD ACV (€B)*
                                                                                1H ACV           3Q ACV
                           $8

                           $6
                                                                                                  € 1.6                 € 1.4         € 2.3
                           $4
                                                                                                                                                    € 2.0
                                                           € 1.1                                               € 1.3
                                 € 1.2        € 1.5                     € 1.0           € 1.2
                           $2

                           $0
                                 2003          04           05           06              07        08           09          10         11           2012

                                 EMEA YTD Counts*                               EMEA New Scope vs. Restructuring YTD ACV (€B)*
                                 1H Counts          3Q Counts                                   YTD New Scope               YTD Restructured
                          400
                                                                                                                                              € 3.9
                          300
                                                           109                  € 3.2                                                 € 3.6            € 3.6
                                              93                   80
                          200            87           85
                                 60
                          100
                                                                                € 0.3                                                 € 1.9 € 2.2 € 1.9
       © 2012
    Information            -
Services Group, Inc.
All Rights Reserved             07       08   09      10   11 2012              2003       04     05      06     07    08        09    10      11     2012
isg-one.com
                       *Contracts with ACV > €4M
9

                       EMEA Country Details in Contract Award Trends
                       ACV awards in the UK rose substantially YTD, while DACH fell almost 40% on a
                       tough compare with 2011 and Nordics dropped by 17%

                                                          YTD Sub-regions for EMEA - ACV (€B)*

                                               Low             Average             3Q11 YTD                 3Q12 YTD
                        € 3.0
                        € 2.8
                        € 2.5
                                        € 2.40
                        € 2.3
                        € 2.0
                        € 1.8
                        € 1.5
                        € 1.3
                        € 1.0                         € 1.05
                                                                    € 0.83
                        € 0.8
                                                                                  € 0.61
                        € 0.5
                        € 0.3                                                                  € 0.22                                € 0.09
                                                                                                             € 0.16       € 0.17
                          €-
       © 2012
    Information                 UK & Ireland       DACH    Scandinavia       Benelux       France       Southern    Africa &   E. Europe &
Services Group, Inc.
All Rights Reserved                                                                                      Europe    Middle East    Russia

isg-one.com
                       *Contracts with ACV > €4M
10

                       EMEA ITO Contract Award Trends
                       Third quarter ITO ACV was one of the strongest on record, up 40% Q/Q . Year to
                       date ACV is down around 20%, while contract numbers fell 24%

                                                  EMEA ITO YTD ACV (€B)*
                                                         1H ACV          3Q ACV
                           €5
                                                                                                                       Top EMEA ITO
                                                                                         € 1.1
                           €4                                            € 1.1
                                                                                                 € 1.9                   Providers
                                                € 0.9
                           €3
                                                                 € 0.9
                                                                                 € 1.1                   € 1.4          by YTD ACV*
                           €2   € 1.0   € 1.3
                                                         € 0.5                                                             Accenture
                           €1                                                                                                 Atos
                           €0                                                                                                   BT
                                2003     04      05       06      07      08      09      10      11     2012
                                                                                                                           Capgemini
                                                                                                                               CSC
                                                                                                                             Fujitsu
                                                   EMEA ITO YTD Counts*                                                        HCL
                                                        1H Counts        3Q Counts                                              HP
                          250                                                                                                  IBM
                                                                                                                             Infosys
                          200
                                                                                                  69                     Mahindra Satyam
                                                                                  70
                          150                                             59              61              56                 Orange
                          100                                     37                                                           TCS
                                         21      31                                                                        T-Systems
                                 29                       32
                           50                                                                                                 Wipro
       © 2012
    Information            -
Services Group, Inc.
All Rights Reserved             2003     04      05       06      07      08      09      10      11     2012    Note: Service providers in alphabetical
                                                                                                                 order; no rankings implied.
isg-one.com
                       *Contracts with ACV > €4M
11

                       EMEA BPO Contract Award Trends
                       Year to Date ACV in 2012 has been the highest ever in EMEA, though the pace of
                       contract awards has slowed.

                                                 EMEA BPO YTD ACV (€B)*
                                                          1H ACV           3Q ACV
                          € 2.5                                                                                              Top EMEA BPO
                          € 2.0
                                                                                                               € 0.61          Providers
                          € 1.5
                                                                           € 0.47                     € 0.41                  by YTD ACV*
                          € 1.0                          € 0.44
                                  € 0.23 € 0.26 € 0.20                              € 0.18                                         Accenture
                          € 0.5                                   € 0.32                     € 0.35
                                                                                                                                   Capgemini
                          € 0.0                                                                                                        CGI
                                  2003    04     05       06       07       08       09       10       11       2012                   HCL
                                                                                                                                       HP
                                                   EMEA BPO YTD Counts*                                                              Infosys
                                                                                                                                 Interserve Plc
                                                      1H Counts            3Q Counts                                             ISS Global A/S
                          125                                                                                                  Johnson Controls
                                                                                                                              Jones Lang LaSalle
                          100
                                                                                                      40                      Mahindra Satyam
                                                                                                                24
                           75
                                                          33
                                                                                                                                      Mitie
                           50                                               28      23        24                                      Serco
                                          12     14                23                                                               Sodexho
                           25      11
       © 2012                                                                                                                      Xchanging
    Information             -
Services Group, Inc.
All Rights Reserved               2003    04     05       06       07      08       09       10       11       2012     Note: Service providers in alphabetical
                                                                                                                        order; no rankings implied.
isg-one.com
                       *Contracts with ACV > €4M
12

                       EMEA Industry Details in Contract Award Trends
                       The Financial Services sector accounted for the lion’s share of contract awards in
                       2012, up almost 60% Y/Y.

                                                         YTD Industry Details for EMEA - ACV (€B)*

                                                   Low           Average             3Q11 YTD         3Q12 YTD
                        € 2.5

                        € 2.0                        € 1.95

                        € 1.5
                                        € 1.22
                        € 1.0
                                                                  € 0.86
                        € 0.5                                               € 0.56
                                                                                         € 0.41
                                                                                                  € 0.20             € 0.21
                                                                                                            € 0.12
                          €-


       © 2012
    Information
Services Group, Inc.
All Rights Reserved


isg-one.com
                       *Contracts with ACV > €4M
13

                       Americas Contract Award Trends
                       Americas ACV was down 11% Y/Y and 8% Q/Q; YTD, ACV is flat; the U.S. is becoming
                       a predominantly restructuring-based market.

                                                                         Americas YTD ACV (€B)*
                                                                                1H ACV             3Q ACV
                          €8

                          €6
                                                                                                                        € 1.4
                          €4                  € 0.9        € 1.4        € 0.9                                   € 1.5
                                 € 1.9                                                                                               € 1.5       € 1.3
                                                                                    € 0.8          € 1.0
                          €2

                          €0
                                 2003          04           05           06             07          08           09      10           11         2012

                                Americas YTD Counts*                          Americas New Scope vs. Restructuring YTD ACV (€B)*
                                  1H Counts           3Q Counts                                   YTD New Scope              YTD Restructured
                          350
                          300
                                                           106                  € 3.4                                                 € 3.9
                          250                         86                                                                                      € 3.0
                                              79                   77
                          200            67                                                                                                              € 2.4
                          150    63
                          100
                                                                                                                                     € 1.9            € 1.9
                           50                                                   € 1.1                                                         € 1.2
       © 2012
    Information             -
Services Group, Inc.
All Rights Reserved              07      08   09      10    11 2012             2003         04    05      06      07   08      09     10      11     2012
isg-one.com
                       *Contracts with ACV > €4M
14

                       Asia Pacific Contract Award Trends
                       Asia Pacific ACV was up Y/Y and Q/Q; YTD, ACV is up significantly; over 90% of YTD
                       awards are new scope.

                                                                       Asia Pacific YTD ACV (€B)*
                                                                                1H ACV        3Q ACV
                          € 2.5

                          € 2.0

                          € 1.5
                                                                                                                                                 € 0.54
                                                                                                             € 0.44
                          € 1.0             € 0.29                     € 0.15      € 0.35                                            € 0.35
                                                                                               € 0.46
                          € 0.5                                                                                       € 0.36
                                   € 0.12                € 0.22
                          € 0.0
                                   2003        04         05            06             07       08            09           10         11          2012

                                Asia Pacific YTD Counts*                 Asia Pacific New Scope vs. Restructuring YTD ACV (€B)*
                                   1H Counts        3Q Counts                                YTD New Scope                 YTD Restructured
                          100

                           80                            28       30                                                                                   € 1.83
                           60               24      18                                                                                        € 0.80
                                  24   25                                    € 0.33
                           40

                           20                                                € 0.01                                                           € 0.33 € 0.11
       © 2012
    Information            -
Services Group, Inc.
All Rights Reserved               07   08   09      10   11 2012                2003    04     05       06     07     08        09     10      11      2012
isg-one.com
                       *Contracts with ACV > €4M
15

                       Assessing the Level of Cloud Adoption


                        1       Percentage of ISG Advised
                                Contracts with Cloud in Scope

                                                           27%
                                                                       2       Number of Industrywide
                                                                               Contracts with Cloud in Scope*


                                                  20%                                ↑100%               300e
                                      9%                                                       220
                                                                                  110

                                     2010         2011   2012 YTD                 2010        2011       2012e


                        3        ISG Quarterly Provider Survey: Cloud Computing
                                 Provider Pipeline
                                 ► Half have cloud scope in 25% of their pipeline opportunities
                                 ► Cloud-based opportunities are up over previous periods
                                 ► All providers expect cloud services to grow faster than traditional
                                   ITO, predominantly in the U.S. market
       © 2012
    Information
Services Group, Inc.
All Rights Reserved


isg-one.com
                       *ISG Contracts Knowledgebase®
                        *Contracts with ACV > €4M
16

                       Recognising the Realities of Cloud Deployment

                                                                Cloud
                                                               Strategy

                                                    Cloud Deployment Models
                             Public Cloud                                                               Private Cloud
                             Shared Infrastructure                                             Dedicated Infrastructure


                                               Opportunity     Perceived Risk      Caution!
                                               • Economies    Security & data    Does not fully
                                                   of Scale   privacy concerns   realise cloud’s
                                                • Standard                          promise
                                                 • Modern


                                                                                 Converged / Utility / Dynamic
                                 IaaS              SaaS          BPaaS
                                                                                         Computing
       © 2012
    Information
Services Group, Inc.
All Rights Reserved
                                                               Cloud Service Models
isg-one.com
                       *Contracts with ACV > €4M
17

                       Opportunities and Challenges in the Provider Community
                                                               Traditional Multinational
                                                                       Providers

                                                                   Expansion of existing ITO
                                                                   business
                                                                                                          India-heritage
                          Pure-play SaaS and IaaS                                                           Providers
                                                                   Integrating acquisitions
                                 Providers
                                                                                                         Application
                              Unbound by legacy                             1                            transformation and
                              constraints                                                                modernisation
                                                                                                2
                                                         5
                              Security and privacy                   Solution                            Reliance on infrastructure
                              concerns                              Assessment                           partners


                                                                       4                         Mid-market
                                             Traditional Software                   3          Hosting Providers
                                                 Companies
                                                                                               Innovative shared hosting
                                               Existing relationship with                      platforms
                                               IT and procurement
                                                                                               Supporting large, complex
       © 2012                                  Cannibalisation of licence                      clients
    Information
Services Group, Inc.                           revenue streams
All Rights Reserved


isg-one.com
                       *Contracts with ACV > €4M
18

                       Cloud Trends
                       Cloud’s disruptive effects on sourcing will accelerate, especially for the sourcing
                       market’s traditional IT providers.

                                 Less
                              Disruptive
                               Trends

                                             IaaS will lag in favour of dedicated, standardised and
                                             virtualised infrastructure services

                                             Cloud growth will be choppy at the enterprise level with
                                             SaaS leading the way in HR, CRM and collaboration

                                             Traditional IT providers face significant pressure from well-
                                             known software vendors, nimble mid-market players and
                                             emerging pure-play infrastructure and SaaS providers
                                              Buyer type shifting from the IT department to the functional
                                              business units, especially SaaS-based HR and CRM
                                Highly
       © 2012                 Disruptive
    Information
Services Group, Inc.           Trends
All Rights Reserved


isg-one.com
                       *Contracts with ACV > €4M
19


                        3Q12 TPI Index Summary and Outlook


                                                      EMEA ACV rose 14% Q/Q but year-to-date is down 8%
                                                      Broader Market 3Q ACV down due to tough 3Q11 compare
                            market                    YTD ACV strengthened slightly on larger contracts, BPO
                            summary                    and Asia Pacific results
                                                      Contract counts fell Q/Q and year-to-date from 2011 but
                                                       remain within broader historical norms


                                                      While TCV performance may lag, from an ACV perspective,
                            market                     the end result will likely be in line with recent year’s
                            outlook                    performance of approximately €16 billion

       © 2012
    Information
Services Group, Inc.
All Rights Reserved


isg-one.com
                       *Contracts with ACV > €4M
20

                       Learn More
                       Please contact us with your questions and comments.

                                ► John Keppel                              ► Duncan Aitchison
                                    Partner & President Research &             Partner & President
                                    Managed Services and Chief                 North Europe, ISG
                                    Marketing Officer                          +44 7879 471 758
                                    +44 7879 432 212                           duncan.aitchison@isg-one.com
                                    john.keppel@isg-one.com


                                                           --- Media Contacts ---

                                ► Denise Colgan                            ► Louise Fernley
                                    Marketing Director, EMEA, ISG              Cohn & Wolfe for ISG
                                    +44 1737 371523                            +44 207 331 5365
                                    denise.colgan@isg-one.com                  louise.fernley@cohnwolfe.com


       © 2012
    Information
Services Group, Inc.
All Rights Reserved


isg-one.com                                                 blog.isg-one.com
                       *Contracts with ACV > €4M
Third Quarter 2012
22

                       3Q12 TCV Score Card
                       The TPI Index has moved to ACV as the primary measure of the Broader Market. In
                       transition, we will continue to provide a high-level TCV view of the market via a
                       Scorecard analysis.


                                                        3Q12 TCV 3Q Y/Y   3Q Q/Q   YTD TCV YTD Y/Y
                                       Scorecard         (€B)*   Change   Change     (€B)* Change
                                       Global Market    €   19.6   -12%    -2%     €   57.1   -3%
                                       Mega Deals       €    4.5   -22%   -11%     €   10.8     0%
                                       New Scope        €   13.0    12%   -13%     €   38.4    -3%
                                       Restructurings   €    6.6   -38%    31%     €   18.7    -2%
                                       ITO              €   12.7   -21%     7%     €   36.2    -7%
                                       BPO              €    6.9    10%   -15%     €   20.9     6%
                                       EMEA             €   10.0   -21%    18%     €   27.1   -15%
                                       Americas         €    7.1    -8%    -6%     €   22.2     4%
                                       Asia Pacific     €    2.5   37%    -37%     €    7.8   45%


       © 2012
    Information
Services Group, Inc.
All Rights Reserved


isg-one.com
                       *Contracts with ACV > €4M
www.isg-one.com

More Related Content

What's hot

R com ru4-qfy2010-180510
R com ru4-qfy2010-180510R com ru4-qfy2010-180510
R com ru4-qfy2010-180510Angel Broking
 
Q1 2006 Presentation
Q1 2006 PresentationQ1 2006 Presentation
Q1 2006 Presentation
Modern Times Group MTG AB
 
Results Presentation 2012 | Resultados Financieros 2012
Results Presentation 2012 | Resultados Financieros 2012Results Presentation 2012 | Resultados Financieros 2012
Results Presentation 2012 | Resultados Financieros 2012Ferrovial
 
Bharti airtel result update 4 qfy2010
Bharti airtel  result update 4 qfy2010Bharti airtel  result update 4 qfy2010
Bharti airtel result update 4 qfy2010Angel Broking
 
CMD2012 - vetlana Skvortsova - Inessa Galaktionova - Market Area Russia
CMD2012 - vetlana Skvortsova - Inessa Galaktionova - Market Area RussiaCMD2012 - vetlana Skvortsova - Inessa Galaktionova - Market Area Russia
CMD2012 - vetlana Skvortsova - Inessa Galaktionova - Market Area RussiaTele2
 
All cargo result update 1 qcy2010 050510
All cargo result update 1 qcy2010 050510All cargo result update 1 qcy2010 050510
All cargo result update 1 qcy2010 050510Angel Broking
 
The Politics Of Cloud Computing
The Politics Of Cloud ComputingThe Politics Of Cloud Computing
The Politics Of Cloud Computing
Martin Hingley
 
L&t ru4 qfy2010-170510
L&t ru4 qfy2010-170510L&t ru4 qfy2010-170510
L&t ru4 qfy2010-170510Angel Broking
 
Al Fried Llc Analytics Report CVC 070909 Ak Marked
Al Fried Llc Analytics Report CVC 070909 Ak MarkedAl Fried Llc Analytics Report CVC 070909 Ak Marked
Al Fried Llc Analytics Report CVC 070909 Ak Marked
ttgoods
 
Sadbhav engg ru4 qfy2010-240510
Sadbhav engg ru4 qfy2010-240510Sadbhav engg ru4 qfy2010-240510
Sadbhav engg ru4 qfy2010-240510Angel Broking
 
Treasury minister's presentation to Chamber of Commerce 27 june 2012
Treasury minister's presentation to Chamber of Commerce 27 june 2012Treasury minister's presentation to Chamber of Commerce 27 june 2012
Treasury minister's presentation to Chamber of Commerce 27 june 2012
States of Jersey
 
CMD2012 - Thomas Ekman - Market Area Nordic
CMD2012 - Thomas Ekman - Market Area NordicCMD2012 - Thomas Ekman - Market Area Nordic
CMD2012 - Thomas Ekman - Market Area NordicTele2
 
Cccl ru4 qfy2010-100510
Cccl  ru4 qfy2010-100510Cccl  ru4 qfy2010-100510
Cccl ru4 qfy2010-100510Angel Broking
 
Mario Orasche, Eagle Ventures @ TMT.Ventures'08 Zagreb
Mario Orasche, Eagle Ventures @ TMT.Ventures'08 ZagrebMario Orasche, Eagle Ventures @ TMT.Ventures'08 Zagreb
Mario Orasche, Eagle Ventures @ TMT.Ventures'08 Zagreb
Ewa Stepien
 
H1 2012 Results Investor Presentation
H1 2012 Results Investor PresentationH1 2012 Results Investor Presentation
H1 2012 Results Investor PresentationMelbourne IT
 
CMD2012 - Niklas Sonkin - Market Area Central Europe and Eurasia
CMD2012 - Niklas Sonkin - Market Area Central Europe and EurasiaCMD2012 - Niklas Sonkin - Market Area Central Europe and Eurasia
CMD2012 - Niklas Sonkin - Market Area Central Europe and EurasiaTele2
 
CMD2012 - Mats Granryd - Tele2's strategy
CMD2012 - Mats Granryd - Tele2's strategyCMD2012 - Mats Granryd - Tele2's strategy
CMD2012 - Mats Granryd - Tele2's strategyTele2
 
Infotech Result Update
Infotech Result UpdateInfotech Result Update
Infotech Result UpdateAngel Broking
 
Quarterly report (Q4) 2007
Quarterly report (Q4) 2007Quarterly report (Q4) 2007
Quarterly report (Q4) 2007
Tele2
 

What's hot (19)

R com ru4-qfy2010-180510
R com ru4-qfy2010-180510R com ru4-qfy2010-180510
R com ru4-qfy2010-180510
 
Q1 2006 Presentation
Q1 2006 PresentationQ1 2006 Presentation
Q1 2006 Presentation
 
Results Presentation 2012 | Resultados Financieros 2012
Results Presentation 2012 | Resultados Financieros 2012Results Presentation 2012 | Resultados Financieros 2012
Results Presentation 2012 | Resultados Financieros 2012
 
Bharti airtel result update 4 qfy2010
Bharti airtel  result update 4 qfy2010Bharti airtel  result update 4 qfy2010
Bharti airtel result update 4 qfy2010
 
CMD2012 - vetlana Skvortsova - Inessa Galaktionova - Market Area Russia
CMD2012 - vetlana Skvortsova - Inessa Galaktionova - Market Area RussiaCMD2012 - vetlana Skvortsova - Inessa Galaktionova - Market Area Russia
CMD2012 - vetlana Skvortsova - Inessa Galaktionova - Market Area Russia
 
All cargo result update 1 qcy2010 050510
All cargo result update 1 qcy2010 050510All cargo result update 1 qcy2010 050510
All cargo result update 1 qcy2010 050510
 
The Politics Of Cloud Computing
The Politics Of Cloud ComputingThe Politics Of Cloud Computing
The Politics Of Cloud Computing
 
L&t ru4 qfy2010-170510
L&t ru4 qfy2010-170510L&t ru4 qfy2010-170510
L&t ru4 qfy2010-170510
 
Al Fried Llc Analytics Report CVC 070909 Ak Marked
Al Fried Llc Analytics Report CVC 070909 Ak MarkedAl Fried Llc Analytics Report CVC 070909 Ak Marked
Al Fried Llc Analytics Report CVC 070909 Ak Marked
 
Sadbhav engg ru4 qfy2010-240510
Sadbhav engg ru4 qfy2010-240510Sadbhav engg ru4 qfy2010-240510
Sadbhav engg ru4 qfy2010-240510
 
Treasury minister's presentation to Chamber of Commerce 27 june 2012
Treasury minister's presentation to Chamber of Commerce 27 june 2012Treasury minister's presentation to Chamber of Commerce 27 june 2012
Treasury minister's presentation to Chamber of Commerce 27 june 2012
 
CMD2012 - Thomas Ekman - Market Area Nordic
CMD2012 - Thomas Ekman - Market Area NordicCMD2012 - Thomas Ekman - Market Area Nordic
CMD2012 - Thomas Ekman - Market Area Nordic
 
Cccl ru4 qfy2010-100510
Cccl  ru4 qfy2010-100510Cccl  ru4 qfy2010-100510
Cccl ru4 qfy2010-100510
 
Mario Orasche, Eagle Ventures @ TMT.Ventures'08 Zagreb
Mario Orasche, Eagle Ventures @ TMT.Ventures'08 ZagrebMario Orasche, Eagle Ventures @ TMT.Ventures'08 Zagreb
Mario Orasche, Eagle Ventures @ TMT.Ventures'08 Zagreb
 
H1 2012 Results Investor Presentation
H1 2012 Results Investor PresentationH1 2012 Results Investor Presentation
H1 2012 Results Investor Presentation
 
CMD2012 - Niklas Sonkin - Market Area Central Europe and Eurasia
CMD2012 - Niklas Sonkin - Market Area Central Europe and EurasiaCMD2012 - Niklas Sonkin - Market Area Central Europe and Eurasia
CMD2012 - Niklas Sonkin - Market Area Central Europe and Eurasia
 
CMD2012 - Mats Granryd - Tele2's strategy
CMD2012 - Mats Granryd - Tele2's strategyCMD2012 - Mats Granryd - Tele2's strategy
CMD2012 - Mats Granryd - Tele2's strategy
 
Infotech Result Update
Infotech Result UpdateInfotech Result Update
Infotech Result Update
 
Quarterly report (Q4) 2007
Quarterly report (Q4) 2007Quarterly report (Q4) 2007
Quarterly report (Q4) 2007
 

Viewers also liked

Dasar JQuery! Hello world
Dasar JQuery! Hello worldDasar JQuery! Hello world
Dasar JQuery! Hello worldAchmad Akbar
 
SIC 2016 Be Memorable
SIC 2016 Be MemorableSIC 2016 Be Memorable
SIC 2016 Be Memorable
Information Services Group (ISG)
 
I Didn't Floss (Psalm 130) by Harry Zeiders
I Didn't Floss (Psalm 130) by Harry ZeidersI Didn't Floss (Psalm 130) by Harry Zeiders
I Didn't Floss (Psalm 130) by Harry Zeiders
HarryKZeiders
 
Terror en la casa 21 carlos sanmartin 8 b
Terror en la casa 21 carlos sanmartin 8 bTerror en la casa 21 carlos sanmartin 8 b
Terror en la casa 21 carlos sanmartin 8 b20de
 
Dry Cleaners & Laundromats in Pop Culture
Dry Cleaners & Laundromats in Pop CultureDry Cleaners & Laundromats in Pop Culture
Dry Cleaners & Laundromats in Pop CultureCleanTie.com
 
SMART Seminar Series: Formal Models of Social Processes
SMART Seminar Series: Formal Models of Social ProcessesSMART Seminar Series: Formal Models of Social Processes
SMART Seminar Series: Formal Models of Social Processes
SMART Infrastructure Facility
 
Bab ii kondisi geografis desa penujak
Bab ii kondisi geografis desa penujakBab ii kondisi geografis desa penujak
Bab ii kondisi geografis desa penujakSopia Kartika
 
Conclusión Unidad III
Conclusión Unidad IIIConclusión Unidad III
Conclusión Unidad III
JORGESTALINVILCACUNDOVARGAS
 
Evaluacion breve
Evaluacion breveEvaluacion breve
Evaluacion breve
JORGESTALINVILCACUNDOVARGAS
 
2 secriancagovernasse-130911123503-phpapp01
2 secriancagovernasse-130911123503-phpapp012 secriancagovernasse-130911123503-phpapp01
2 secriancagovernasse-130911123503-phpapp01
Dyone Andrade
 
SMART International Symposium for Next Generation Infrastructure: Modelling I...
SMART International Symposium for Next Generation Infrastructure: Modelling I...SMART International Symposium for Next Generation Infrastructure: Modelling I...
SMART International Symposium for Next Generation Infrastructure: Modelling I...
SMART Infrastructure Facility
 
ISNGI 2016 - Pitch: "Smart buildings and precincts" - Dr Massimo Fiorentini
ISNGI 2016 - Pitch: "Smart buildings and precincts" - Dr Massimo FiorentiniISNGI 2016 - Pitch: "Smart buildings and precincts" - Dr Massimo Fiorentini
ISNGI 2016 - Pitch: "Smart buildings and precincts" - Dr Massimo Fiorentini
SMART Infrastructure Facility
 
Car Lease in Europe Travel Booklet - Wheels in Europe
Car Lease in Europe Travel Booklet - Wheels in EuropeCar Lease in Europe Travel Booklet - Wheels in Europe
Car Lease in Europe Travel Booklet - Wheels in Europe
VW Agatha
 
Barcelona, Catalunya
Barcelona, CatalunyaBarcelona, Catalunya
Barcelona, Catalunya
Carlos Colomer
 
Adding Cloud to the Service Delivery Mix: Business Drivers and Organizational...
Adding Cloud to the Service Delivery Mix: Business Drivers and Organizational...Adding Cloud to the Service Delivery Mix: Business Drivers and Organizational...
Adding Cloud to the Service Delivery Mix: Business Drivers and Organizational...
Information Services Group (ISG)
 
El raval xxv anys 3
El raval xxv anys 3El raval xxv anys 3
El raval xxv anys 3
Joanvi Sempere
 
LI-FI Technology ppt
LI-FI Technology pptLI-FI Technology ppt
LI-FI Technology ppt
Deepak Khatri
 

Viewers also liked (20)

Dasar JQuery! Hello world
Dasar JQuery! Hello worldDasar JQuery! Hello world
Dasar JQuery! Hello world
 
SIC 2016 Be Memorable
SIC 2016 Be MemorableSIC 2016 Be Memorable
SIC 2016 Be Memorable
 
Onet m6 52 art
Onet m6 52  artOnet m6 52  art
Onet m6 52 art
 
I Didn't Floss (Psalm 130) by Harry Zeiders
I Didn't Floss (Psalm 130) by Harry ZeidersI Didn't Floss (Psalm 130) by Harry Zeiders
I Didn't Floss (Psalm 130) by Harry Zeiders
 
CCRT GROUP
CCRT GROUPCCRT GROUP
CCRT GROUP
 
Terror en la casa 21 carlos sanmartin 8 b
Terror en la casa 21 carlos sanmartin 8 bTerror en la casa 21 carlos sanmartin 8 b
Terror en la casa 21 carlos sanmartin 8 b
 
Dry Cleaners & Laundromats in Pop Culture
Dry Cleaners & Laundromats in Pop CultureDry Cleaners & Laundromats in Pop Culture
Dry Cleaners & Laundromats in Pop Culture
 
Closed manual
Closed manualClosed manual
Closed manual
 
SMART Seminar Series: Formal Models of Social Processes
SMART Seminar Series: Formal Models of Social ProcessesSMART Seminar Series: Formal Models of Social Processes
SMART Seminar Series: Formal Models of Social Processes
 
Bab ii kondisi geografis desa penujak
Bab ii kondisi geografis desa penujakBab ii kondisi geografis desa penujak
Bab ii kondisi geografis desa penujak
 
Conclusión Unidad III
Conclusión Unidad IIIConclusión Unidad III
Conclusión Unidad III
 
Evaluacion breve
Evaluacion breveEvaluacion breve
Evaluacion breve
 
2 secriancagovernasse-130911123503-phpapp01
2 secriancagovernasse-130911123503-phpapp012 secriancagovernasse-130911123503-phpapp01
2 secriancagovernasse-130911123503-phpapp01
 
SMART International Symposium for Next Generation Infrastructure: Modelling I...
SMART International Symposium for Next Generation Infrastructure: Modelling I...SMART International Symposium for Next Generation Infrastructure: Modelling I...
SMART International Symposium for Next Generation Infrastructure: Modelling I...
 
ISNGI 2016 - Pitch: "Smart buildings and precincts" - Dr Massimo Fiorentini
ISNGI 2016 - Pitch: "Smart buildings and precincts" - Dr Massimo FiorentiniISNGI 2016 - Pitch: "Smart buildings and precincts" - Dr Massimo Fiorentini
ISNGI 2016 - Pitch: "Smart buildings and precincts" - Dr Massimo Fiorentini
 
Car Lease in Europe Travel Booklet - Wheels in Europe
Car Lease in Europe Travel Booklet - Wheels in EuropeCar Lease in Europe Travel Booklet - Wheels in Europe
Car Lease in Europe Travel Booklet - Wheels in Europe
 
Barcelona, Catalunya
Barcelona, CatalunyaBarcelona, Catalunya
Barcelona, Catalunya
 
Adding Cloud to the Service Delivery Mix: Business Drivers and Organizational...
Adding Cloud to the Service Delivery Mix: Business Drivers and Organizational...Adding Cloud to the Service Delivery Mix: Business Drivers and Organizational...
Adding Cloud to the Service Delivery Mix: Business Drivers and Organizational...
 
El raval xxv anys 3
El raval xxv anys 3El raval xxv anys 3
El raval xxv anys 3
 
LI-FI Technology ppt
LI-FI Technology pptLI-FI Technology ppt
LI-FI Technology ppt
 

Similar to Third Quarter 2012, EMEA TPI Index

EMEA TPI Index - 4Q12 and FY12
EMEA TPI Index - 4Q12 and FY12EMEA TPI Index - 4Q12 and FY12
EMEA TPI Index - 4Q12 and FY12
Information Services Group (ISG)
 
1st Quarter 2012, EMEA TPI Index
1st Quarter 2012, EMEA TPI Index1st Quarter 2012, EMEA TPI Index
1st Quarter 2012, EMEA TPI Index
Information Services Group (ISG)
 
EMEA ISG Outsourcing Index Q3/2014
EMEA ISG Outsourcing Index Q3/2014EMEA ISG Outsourcing Index Q3/2014
EMEA ISG Outsourcing Index Q3/2014
Werner Feld
 
2Q14 EMEA ISG Outsourcing Index
2Q14 EMEA ISG Outsourcing Index2Q14 EMEA ISG Outsourcing Index
2Q14 EMEA ISG Outsourcing Index
Werner Feld
 
1Q13 ISG Outsourcing Index, EMEA
1Q13 ISG Outsourcing Index, EMEA1Q13 ISG Outsourcing Index, EMEA
1Q13 ISG Outsourcing Index, EMEA
Information Services Group (ISG)
 
Fourth Quarter and Full Year 2013 ISG EMEA Outsourcing Index
Fourth Quarter and Full Year 2013 ISG EMEA Outsourcing IndexFourth Quarter and Full Year 2013 ISG EMEA Outsourcing Index
Fourth Quarter and Full Year 2013 ISG EMEA Outsourcing Index
Information Services Group (ISG)
 
2nd Quarter 2012, EMEA TPI Index
2nd Quarter 2012, EMEA TPI Index2nd Quarter 2012, EMEA TPI Index
2nd Quarter 2012, EMEA TPI Index
Information Services Group (ISG)
 
Natalia Meylunas - Head of Regional Programme, Small Business Support Team at...
Natalia Meylunas - Head of Regional Programme, Small Business Support Team at...Natalia Meylunas - Head of Regional Programme, Small Business Support Team at...
Natalia Meylunas - Head of Regional Programme, Small Business Support Team at...
Serbian Business Angels Network
 
1Q 2016 EMEA ISG Outsourcing Index®
1Q 2016 EMEA ISG Outsourcing Index®1Q 2016 EMEA ISG Outsourcing Index®
1Q 2016 EMEA ISG Outsourcing Index®
Information Services Group (ISG)
 
Naspers Finance Analyst 20100723
Naspers Finance Analyst 20100723Naspers Finance Analyst 20100723
Naspers Finance Analyst 20100723YOICHIRO SHIBA
 
Interim results Q4 2009
Interim results Q4 2009Interim results Q4 2009
Interim results Q4 2009
EDB
 
Q3 2015 EMEA ISG Outsourcing Index, Report
Q3 2015 EMEA ISG Outsourcing Index, ReportQ3 2015 EMEA ISG Outsourcing Index, Report
Q3 2015 EMEA ISG Outsourcing Index, Report
Werner Feld
 
3Q 2015 EMEA ISG Outsourcing Index®
3Q 2015 EMEA ISG Outsourcing Index®3Q 2015 EMEA ISG Outsourcing Index®
3Q 2015 EMEA ISG Outsourcing Index®
Information Services Group (ISG)
 
Q1 2015 ISG Outsourcing Index EMEA
Q1 2015 ISG Outsourcing Index EMEA Q1 2015 ISG Outsourcing Index EMEA
Q1 2015 ISG Outsourcing Index EMEA
Werner Feld
 
3Q16 EMEA ISG Index
3Q16 EMEA ISG Index3Q16 EMEA ISG Index
2011 2nd Half & Full Year, Asia Pacific TPI Index
2011 2nd Half & Full Year, Asia Pacific TPI Index2011 2nd Half & Full Year, Asia Pacific TPI Index
2011 2nd Half & Full Year, Asia Pacific TPI Index
Information Services Group (ISG)
 
Sintex ru2 qfy2011-121010
Sintex ru2 qfy2011-121010Sintex ru2 qfy2011-121010
Sintex ru2 qfy2011-121010Angel Broking
 
2 Q 2015 EMEA ISG Outsourcing Index
2 Q 2015 EMEA ISG Outsourcing Index2 Q 2015 EMEA ISG Outsourcing Index
2 Q 2015 EMEA ISG Outsourcing Index
Werner Feld
 
General Shareholders' Meeting 2013
General Shareholders' Meeting 2013General Shareholders' Meeting 2013
General Shareholders' Meeting 2013Ferrovial
 
Quarterly report (Q3) 2008
Quarterly report (Q3) 2008Quarterly report (Q3) 2008
Quarterly report (Q3) 2008
Tele2
 

Similar to Third Quarter 2012, EMEA TPI Index (20)

EMEA TPI Index - 4Q12 and FY12
EMEA TPI Index - 4Q12 and FY12EMEA TPI Index - 4Q12 and FY12
EMEA TPI Index - 4Q12 and FY12
 
1st Quarter 2012, EMEA TPI Index
1st Quarter 2012, EMEA TPI Index1st Quarter 2012, EMEA TPI Index
1st Quarter 2012, EMEA TPI Index
 
EMEA ISG Outsourcing Index Q3/2014
EMEA ISG Outsourcing Index Q3/2014EMEA ISG Outsourcing Index Q3/2014
EMEA ISG Outsourcing Index Q3/2014
 
2Q14 EMEA ISG Outsourcing Index
2Q14 EMEA ISG Outsourcing Index2Q14 EMEA ISG Outsourcing Index
2Q14 EMEA ISG Outsourcing Index
 
1Q13 ISG Outsourcing Index, EMEA
1Q13 ISG Outsourcing Index, EMEA1Q13 ISG Outsourcing Index, EMEA
1Q13 ISG Outsourcing Index, EMEA
 
Fourth Quarter and Full Year 2013 ISG EMEA Outsourcing Index
Fourth Quarter and Full Year 2013 ISG EMEA Outsourcing IndexFourth Quarter and Full Year 2013 ISG EMEA Outsourcing Index
Fourth Quarter and Full Year 2013 ISG EMEA Outsourcing Index
 
2nd Quarter 2012, EMEA TPI Index
2nd Quarter 2012, EMEA TPI Index2nd Quarter 2012, EMEA TPI Index
2nd Quarter 2012, EMEA TPI Index
 
Natalia Meylunas - Head of Regional Programme, Small Business Support Team at...
Natalia Meylunas - Head of Regional Programme, Small Business Support Team at...Natalia Meylunas - Head of Regional Programme, Small Business Support Team at...
Natalia Meylunas - Head of Regional Programme, Small Business Support Team at...
 
1Q 2016 EMEA ISG Outsourcing Index®
1Q 2016 EMEA ISG Outsourcing Index®1Q 2016 EMEA ISG Outsourcing Index®
1Q 2016 EMEA ISG Outsourcing Index®
 
Naspers Finance Analyst 20100723
Naspers Finance Analyst 20100723Naspers Finance Analyst 20100723
Naspers Finance Analyst 20100723
 
Interim results Q4 2009
Interim results Q4 2009Interim results Q4 2009
Interim results Q4 2009
 
Q3 2015 EMEA ISG Outsourcing Index, Report
Q3 2015 EMEA ISG Outsourcing Index, ReportQ3 2015 EMEA ISG Outsourcing Index, Report
Q3 2015 EMEA ISG Outsourcing Index, Report
 
3Q 2015 EMEA ISG Outsourcing Index®
3Q 2015 EMEA ISG Outsourcing Index®3Q 2015 EMEA ISG Outsourcing Index®
3Q 2015 EMEA ISG Outsourcing Index®
 
Q1 2015 ISG Outsourcing Index EMEA
Q1 2015 ISG Outsourcing Index EMEA Q1 2015 ISG Outsourcing Index EMEA
Q1 2015 ISG Outsourcing Index EMEA
 
3Q16 EMEA ISG Index
3Q16 EMEA ISG Index3Q16 EMEA ISG Index
3Q16 EMEA ISG Index
 
2011 2nd Half & Full Year, Asia Pacific TPI Index
2011 2nd Half & Full Year, Asia Pacific TPI Index2011 2nd Half & Full Year, Asia Pacific TPI Index
2011 2nd Half & Full Year, Asia Pacific TPI Index
 
Sintex ru2 qfy2011-121010
Sintex ru2 qfy2011-121010Sintex ru2 qfy2011-121010
Sintex ru2 qfy2011-121010
 
2 Q 2015 EMEA ISG Outsourcing Index
2 Q 2015 EMEA ISG Outsourcing Index2 Q 2015 EMEA ISG Outsourcing Index
2 Q 2015 EMEA ISG Outsourcing Index
 
General Shareholders' Meeting 2013
General Shareholders' Meeting 2013General Shareholders' Meeting 2013
General Shareholders' Meeting 2013
 
Quarterly report (Q3) 2008
Quarterly report (Q3) 2008Quarterly report (Q3) 2008
Quarterly report (Q3) 2008
 

More from Information Services Group (ISG)

3Q22 Global ISG Index™
3Q22 Global ISG Index™3Q22 Global ISG Index™
3Q22 Global ISG Index™
Information Services Group (ISG)
 
2Q22 Global ISG Index™
2Q22 Global ISG Index™2Q22 Global ISG Index™
2Q22 Global ISG Index™
Information Services Group (ISG)
 
1Q22 Global ISG Index™
1Q22 Global ISG Index™1Q22 Global ISG Index™
1Q22 Global ISG Index™
Information Services Group (ISG)
 
4Q21 Global ISG Index™
4Q21 Global ISG Index™4Q21 Global ISG Index™
4Q21 Global ISG Index™
Information Services Group (ISG)
 
3Q21 Global ISG Index™
3Q21 Global ISG Index™3Q21 Global ISG Index™
3Q21 Global ISG Index™
Information Services Group (ISG)
 
2Q 2021 ISG Index™
2Q 2021 ISG Index™2Q 2021 ISG Index™
2Q 2021 ISG Index™
Information Services Group (ISG)
 
1Q 2021 Global ISG Index™ Infographic
1Q 2021 Global ISG Index™ Infographic1Q 2021 Global ISG Index™ Infographic
1Q 2021 Global ISG Index™ Infographic
Information Services Group (ISG)
 
1Q 2021 Global ISG Index™
1Q 2021 Global ISG Index™1Q 2021 Global ISG Index™
1Q 2021 Global ISG Index™
Information Services Group (ISG)
 
4Q 2020 Global ISG Index™ Infographic
4Q 2020 Global ISG Index™ Infographic4Q 2020 Global ISG Index™ Infographic
4Q 2020 Global ISG Index™ Infographic
Information Services Group (ISG)
 
4Q 2020 Global ISG Index™
4Q 2020 Global ISG Index™4Q 2020 Global ISG Index™
4Q 2020 Global ISG Index™
Information Services Group (ISG)
 
3Q 2020 Global ISG Index™ Infographic
3Q 2020 Global ISG Index™ Infographic3Q 2020 Global ISG Index™ Infographic
3Q 2020 Global ISG Index™ Infographic
Information Services Group (ISG)
 
2Q 2020 Global ISG Index™ Infographic
2Q 2020 Global ISG Index™ Infographic2Q 2020 Global ISG Index™ Infographic
2Q 2020 Global ISG Index™ Infographic
Information Services Group (ISG)
 
2Q 2020 Global ISG Index™
2Q 2020 Global ISG Index™2Q 2020 Global ISG Index™
2Q 2020 Global ISG Index™
Information Services Group (ISG)
 
1Q20 Global ISG Index™ Infographic
1Q20 Global ISG Index™ Infographic1Q20 Global ISG Index™ Infographic
1Q20 Global ISG Index™ Infographic
Information Services Group (ISG)
 
1Q20 Global ISG Index™
1Q20 Global ISG Index™1Q20 Global ISG Index™
1Q20 Global ISG Index™
Information Services Group (ISG)
 
Full Year 2019 EMEA ISG Index™
Full Year 2019 EMEA ISG Index™Full Year 2019 EMEA ISG Index™
Full Year 2019 EMEA ISG Index™
Information Services Group (ISG)
 
4Q 2019 Global ISG Index™ Infographic
4Q 2019 Global ISG Index™ Infographic4Q 2019 Global ISG Index™ Infographic
4Q 2019 Global ISG Index™ Infographic
Information Services Group (ISG)
 
4Q 2019 Global ISG Index™
4Q 2019 Global ISG Index™4Q 2019 Global ISG Index™
4Q 2019 Global ISG Index™
Information Services Group (ISG)
 
2Q19 Global ISG Index™
2Q19 Global ISG Index™2Q19 Global ISG Index™
2Q19 Global ISG Index™
Information Services Group (ISG)
 
2Q19 Global ISG Index™ Infographic
2Q19 Global ISG Index™ Infographic2Q19 Global ISG Index™ Infographic
2Q19 Global ISG Index™ Infographic
Information Services Group (ISG)
 

More from Information Services Group (ISG) (20)

3Q22 Global ISG Index™
3Q22 Global ISG Index™3Q22 Global ISG Index™
3Q22 Global ISG Index™
 
2Q22 Global ISG Index™
2Q22 Global ISG Index™2Q22 Global ISG Index™
2Q22 Global ISG Index™
 
1Q22 Global ISG Index™
1Q22 Global ISG Index™1Q22 Global ISG Index™
1Q22 Global ISG Index™
 
4Q21 Global ISG Index™
4Q21 Global ISG Index™4Q21 Global ISG Index™
4Q21 Global ISG Index™
 
3Q21 Global ISG Index™
3Q21 Global ISG Index™3Q21 Global ISG Index™
3Q21 Global ISG Index™
 
2Q 2021 ISG Index™
2Q 2021 ISG Index™2Q 2021 ISG Index™
2Q 2021 ISG Index™
 
1Q 2021 Global ISG Index™ Infographic
1Q 2021 Global ISG Index™ Infographic1Q 2021 Global ISG Index™ Infographic
1Q 2021 Global ISG Index™ Infographic
 
1Q 2021 Global ISG Index™
1Q 2021 Global ISG Index™1Q 2021 Global ISG Index™
1Q 2021 Global ISG Index™
 
4Q 2020 Global ISG Index™ Infographic
4Q 2020 Global ISG Index™ Infographic4Q 2020 Global ISG Index™ Infographic
4Q 2020 Global ISG Index™ Infographic
 
4Q 2020 Global ISG Index™
4Q 2020 Global ISG Index™4Q 2020 Global ISG Index™
4Q 2020 Global ISG Index™
 
3Q 2020 Global ISG Index™ Infographic
3Q 2020 Global ISG Index™ Infographic3Q 2020 Global ISG Index™ Infographic
3Q 2020 Global ISG Index™ Infographic
 
2Q 2020 Global ISG Index™ Infographic
2Q 2020 Global ISG Index™ Infographic2Q 2020 Global ISG Index™ Infographic
2Q 2020 Global ISG Index™ Infographic
 
2Q 2020 Global ISG Index™
2Q 2020 Global ISG Index™2Q 2020 Global ISG Index™
2Q 2020 Global ISG Index™
 
1Q20 Global ISG Index™ Infographic
1Q20 Global ISG Index™ Infographic1Q20 Global ISG Index™ Infographic
1Q20 Global ISG Index™ Infographic
 
1Q20 Global ISG Index™
1Q20 Global ISG Index™1Q20 Global ISG Index™
1Q20 Global ISG Index™
 
Full Year 2019 EMEA ISG Index™
Full Year 2019 EMEA ISG Index™Full Year 2019 EMEA ISG Index™
Full Year 2019 EMEA ISG Index™
 
4Q 2019 Global ISG Index™ Infographic
4Q 2019 Global ISG Index™ Infographic4Q 2019 Global ISG Index™ Infographic
4Q 2019 Global ISG Index™ Infographic
 
4Q 2019 Global ISG Index™
4Q 2019 Global ISG Index™4Q 2019 Global ISG Index™
4Q 2019 Global ISG Index™
 
2Q19 Global ISG Index™
2Q19 Global ISG Index™2Q19 Global ISG Index™
2Q19 Global ISG Index™
 
2Q19 Global ISG Index™ Infographic
2Q19 Global ISG Index™ Infographic2Q19 Global ISG Index™ Infographic
2Q19 Global ISG Index™ Infographic
 

Recently uploaded

一比一原版加拿大渥太华大学毕业证(uottawa毕业证书)如何办理
一比一原版加拿大渥太华大学毕业证(uottawa毕业证书)如何办理一比一原版加拿大渥太华大学毕业证(uottawa毕业证书)如何办理
一比一原版加拿大渥太华大学毕业证(uottawa毕业证书)如何办理
taqyed
 
The effects of customers service quality and online reviews on customer loyal...
The effects of customers service quality and online reviews on customer loyal...The effects of customers service quality and online reviews on customer loyal...
The effects of customers service quality and online reviews on customer loyal...
balatucanapplelovely
 
ENTREPRENEURSHIP TRAINING.ppt for graduating class (1).ppt
ENTREPRENEURSHIP TRAINING.ppt for graduating class (1).pptENTREPRENEURSHIP TRAINING.ppt for graduating class (1).ppt
ENTREPRENEURSHIP TRAINING.ppt for graduating class (1).ppt
zechu97
 
What is the TDS Return Filing Due Date for FY 2024-25.pdf
What is the TDS Return Filing Due Date for FY 2024-25.pdfWhat is the TDS Return Filing Due Date for FY 2024-25.pdf
What is the TDS Return Filing Due Date for FY 2024-25.pdf
seoforlegalpillers
 
RMD24 | Debunking the non-endemic revenue myth Marvin Vacquier Droop | First ...
RMD24 | Debunking the non-endemic revenue myth Marvin Vacquier Droop | First ...RMD24 | Debunking the non-endemic revenue myth Marvin Vacquier Droop | First ...
RMD24 | Debunking the non-endemic revenue myth Marvin Vacquier Droop | First ...
BBPMedia1
 
Introduction to Amazon company 111111111111
Introduction to Amazon company 111111111111Introduction to Amazon company 111111111111
Introduction to Amazon company 111111111111
zoyaansari11365
 
Buy Verified PayPal Account | Buy Google 5 Star Reviews
Buy Verified PayPal Account | Buy Google 5 Star ReviewsBuy Verified PayPal Account | Buy Google 5 Star Reviews
Buy Verified PayPal Account | Buy Google 5 Star Reviews
usawebmarket
 
LA HUG - Video Testimonials with Chynna Morgan - June 2024
LA HUG - Video Testimonials with Chynna Morgan - June 2024LA HUG - Video Testimonials with Chynna Morgan - June 2024
LA HUG - Video Testimonials with Chynna Morgan - June 2024
Lital Barkan
 
April 2024 Nostalgia Products Newsletter
April 2024 Nostalgia Products NewsletterApril 2024 Nostalgia Products Newsletter
April 2024 Nostalgia Products Newsletter
NathanBaughman3
 
Attending a job Interview for B1 and B2 Englsih learners
Attending a job Interview for B1 and B2 Englsih learnersAttending a job Interview for B1 and B2 Englsih learners
Attending a job Interview for B1 and B2 Englsih learners
Erika906060
 
Improving profitability for small business
Improving profitability for small businessImproving profitability for small business
Improving profitability for small business
Ben Wann
 
Unveiling the Secrets How Does Generative AI Work.pdf
Unveiling the Secrets How Does Generative AI Work.pdfUnveiling the Secrets How Does Generative AI Work.pdf
Unveiling the Secrets How Does Generative AI Work.pdf
Sam H
 
Search Disrupted Google’s Leaked Documents Rock the SEO World.pdf
Search Disrupted Google’s Leaked Documents Rock the SEO World.pdfSearch Disrupted Google’s Leaked Documents Rock the SEO World.pdf
Search Disrupted Google’s Leaked Documents Rock the SEO World.pdf
Arihant Webtech Pvt. Ltd
 
Tata Group Dials Taiwan for Its Chipmaking Ambition in Gujarat’s Dholera
Tata Group Dials Taiwan for Its Chipmaking Ambition in Gujarat’s DholeraTata Group Dials Taiwan for Its Chipmaking Ambition in Gujarat’s Dholera
Tata Group Dials Taiwan for Its Chipmaking Ambition in Gujarat’s Dholera
Avirahi City Dholera
 
Premium MEAN Stack Development Solutions for Modern Businesses
Premium MEAN Stack Development Solutions for Modern BusinessesPremium MEAN Stack Development Solutions for Modern Businesses
Premium MEAN Stack Development Solutions for Modern Businesses
SynapseIndia
 
amptalk_RecruitingDeck_english_2024.06.05
amptalk_RecruitingDeck_english_2024.06.05amptalk_RecruitingDeck_english_2024.06.05
amptalk_RecruitingDeck_english_2024.06.05
marketing317746
 
The Parable of the Pipeline a book every new businessman or business student ...
The Parable of the Pipeline a book every new businessman or business student ...The Parable of the Pipeline a book every new businessman or business student ...
The Parable of the Pipeline a book every new businessman or business student ...
awaisafdar
 
Cree_Rey_BrandIdentityKit.PDF_PersonalBd
Cree_Rey_BrandIdentityKit.PDF_PersonalBdCree_Rey_BrandIdentityKit.PDF_PersonalBd
Cree_Rey_BrandIdentityKit.PDF_PersonalBd
creerey
 
3.0 Project 2_ Developing My Brand Identity Kit.pptx
3.0 Project 2_ Developing My Brand Identity Kit.pptx3.0 Project 2_ Developing My Brand Identity Kit.pptx
3.0 Project 2_ Developing My Brand Identity Kit.pptx
tanyjahb
 
ModelingMarketingStrategiesMKS.CollumbiaUniversitypdf
ModelingMarketingStrategiesMKS.CollumbiaUniversitypdfModelingMarketingStrategiesMKS.CollumbiaUniversitypdf
ModelingMarketingStrategiesMKS.CollumbiaUniversitypdf
fisherameliaisabella
 

Recently uploaded (20)

一比一原版加拿大渥太华大学毕业证(uottawa毕业证书)如何办理
一比一原版加拿大渥太华大学毕业证(uottawa毕业证书)如何办理一比一原版加拿大渥太华大学毕业证(uottawa毕业证书)如何办理
一比一原版加拿大渥太华大学毕业证(uottawa毕业证书)如何办理
 
The effects of customers service quality and online reviews on customer loyal...
The effects of customers service quality and online reviews on customer loyal...The effects of customers service quality and online reviews on customer loyal...
The effects of customers service quality and online reviews on customer loyal...
 
ENTREPRENEURSHIP TRAINING.ppt for graduating class (1).ppt
ENTREPRENEURSHIP TRAINING.ppt for graduating class (1).pptENTREPRENEURSHIP TRAINING.ppt for graduating class (1).ppt
ENTREPRENEURSHIP TRAINING.ppt for graduating class (1).ppt
 
What is the TDS Return Filing Due Date for FY 2024-25.pdf
What is the TDS Return Filing Due Date for FY 2024-25.pdfWhat is the TDS Return Filing Due Date for FY 2024-25.pdf
What is the TDS Return Filing Due Date for FY 2024-25.pdf
 
RMD24 | Debunking the non-endemic revenue myth Marvin Vacquier Droop | First ...
RMD24 | Debunking the non-endemic revenue myth Marvin Vacquier Droop | First ...RMD24 | Debunking the non-endemic revenue myth Marvin Vacquier Droop | First ...
RMD24 | Debunking the non-endemic revenue myth Marvin Vacquier Droop | First ...
 
Introduction to Amazon company 111111111111
Introduction to Amazon company 111111111111Introduction to Amazon company 111111111111
Introduction to Amazon company 111111111111
 
Buy Verified PayPal Account | Buy Google 5 Star Reviews
Buy Verified PayPal Account | Buy Google 5 Star ReviewsBuy Verified PayPal Account | Buy Google 5 Star Reviews
Buy Verified PayPal Account | Buy Google 5 Star Reviews
 
LA HUG - Video Testimonials with Chynna Morgan - June 2024
LA HUG - Video Testimonials with Chynna Morgan - June 2024LA HUG - Video Testimonials with Chynna Morgan - June 2024
LA HUG - Video Testimonials with Chynna Morgan - June 2024
 
April 2024 Nostalgia Products Newsletter
April 2024 Nostalgia Products NewsletterApril 2024 Nostalgia Products Newsletter
April 2024 Nostalgia Products Newsletter
 
Attending a job Interview for B1 and B2 Englsih learners
Attending a job Interview for B1 and B2 Englsih learnersAttending a job Interview for B1 and B2 Englsih learners
Attending a job Interview for B1 and B2 Englsih learners
 
Improving profitability for small business
Improving profitability for small businessImproving profitability for small business
Improving profitability for small business
 
Unveiling the Secrets How Does Generative AI Work.pdf
Unveiling the Secrets How Does Generative AI Work.pdfUnveiling the Secrets How Does Generative AI Work.pdf
Unveiling the Secrets How Does Generative AI Work.pdf
 
Search Disrupted Google’s Leaked Documents Rock the SEO World.pdf
Search Disrupted Google’s Leaked Documents Rock the SEO World.pdfSearch Disrupted Google’s Leaked Documents Rock the SEO World.pdf
Search Disrupted Google’s Leaked Documents Rock the SEO World.pdf
 
Tata Group Dials Taiwan for Its Chipmaking Ambition in Gujarat’s Dholera
Tata Group Dials Taiwan for Its Chipmaking Ambition in Gujarat’s DholeraTata Group Dials Taiwan for Its Chipmaking Ambition in Gujarat’s Dholera
Tata Group Dials Taiwan for Its Chipmaking Ambition in Gujarat’s Dholera
 
Premium MEAN Stack Development Solutions for Modern Businesses
Premium MEAN Stack Development Solutions for Modern BusinessesPremium MEAN Stack Development Solutions for Modern Businesses
Premium MEAN Stack Development Solutions for Modern Businesses
 
amptalk_RecruitingDeck_english_2024.06.05
amptalk_RecruitingDeck_english_2024.06.05amptalk_RecruitingDeck_english_2024.06.05
amptalk_RecruitingDeck_english_2024.06.05
 
The Parable of the Pipeline a book every new businessman or business student ...
The Parable of the Pipeline a book every new businessman or business student ...The Parable of the Pipeline a book every new businessman or business student ...
The Parable of the Pipeline a book every new businessman or business student ...
 
Cree_Rey_BrandIdentityKit.PDF_PersonalBd
Cree_Rey_BrandIdentityKit.PDF_PersonalBdCree_Rey_BrandIdentityKit.PDF_PersonalBd
Cree_Rey_BrandIdentityKit.PDF_PersonalBd
 
3.0 Project 2_ Developing My Brand Identity Kit.pptx
3.0 Project 2_ Developing My Brand Identity Kit.pptx3.0 Project 2_ Developing My Brand Identity Kit.pptx
3.0 Project 2_ Developing My Brand Identity Kit.pptx
 
ModelingMarketingStrategiesMKS.CollumbiaUniversitypdf
ModelingMarketingStrategiesMKS.CollumbiaUniversitypdfModelingMarketingStrategiesMKS.CollumbiaUniversitypdf
ModelingMarketingStrategiesMKS.CollumbiaUniversitypdf
 

Third Quarter 2012, EMEA TPI Index

  • 1. The TPI EMEA Index EMEA Outsourcing Market Data and Insights Third Quarter 2012 Hosted by: John King Barclays Capital 19 October 2012
  • 2. 2 Welcome to the 40th Quarterly Outsourcing Index Call Covering the state of the outsourcing industry for global, commercial contracts. Duncan Aitchison Partner Bernd Schaefer Partner © 2012 Information Services Group, Inc. All Rights Reserved isg-one.com *Contracts with ACV > €4M
  • 3. 3 Milestones 40th quarterly presentation signals a decade of TPI Index Conference Calls Spring Winter Summer Fall Spring Today 2003 2004 2005 2008 2011 Inaugural Recognised Identified the Led in calling Identified the Global and India-heritage growing influence out the growing shift of EMEA providers as an of restructurings, industry-wide sourcing growth Index Calls emerging entity and their impact on sourcing towards emerging that would affect service providers downturn markets how SPs compete The Index audience routinely includes 250 analysts, clients and service providers. © 2012 Information Services Group, Inc. The ISG Contracts Knowledgebase® All Rights Reserved exceeds 24,000 contract records. isg-one.com *Contracts with ACV > €4M
  • 4. 4 Refocusing on ACV as the Primary Measure of the Market Going forward, an ACV-based analysis of the market will avoid masking the effects of declining contract durations on TCV. TCV Change Over Time ACV Change Over Time Year-to-date at 3Q Year-to-date at 3Q Growth since 2003 = 9% Growth since 2003 = 40% € 57 € 12 € 52 €8 2003 04 05 06 07 08 09 10 11 2012 2003 04 05 06 07 08 09 10 11 2012 © 2012 Information Services Group, Inc. Typical Quarterly ACV = €4B All Rights Reserved Typical Annual ACV = €16B isg-one.com *Contracts with ACV > €4M
  • 5. 5 At A Glance 3Q12 ACV 3Q Y/Y 3Q Q/Q YTD ACV YTD Y/Y Scorecard (€B)* Change Change (€B)* Change Global Market € 3.8 -6% -10% € 11.8 3% New Scope € 2.6 16% -19% € 7.9 2% Restructurings € 1.2 -33% 17% € 4.0 6% Mega-Relationships € 1.2 1% -26% € 3.6 51% ITO € 2.5 -13% 8% € 7.3 -3% BPO € 1.3 12% -32% € 4.5 17% © 2012 EMEA € 2.0 -12% 14% € 5.5 -8% Information Services Group, Inc. Americas € 1.3 -11% -8% € 4.3 2% All Rights Reserved Asia Pacific € 0.5 55% -51% € 1.9 72% isg-one.com *See Appendix for TCV Scorecard *Contracts with ACV > €4M
  • 6. 6 Global Market Contract Award Trends ACV was down 6% Y/Y and 10% Q/Q; YTD, ACV of $14.8B is up 3.5%. Global Market YTD ACV (€B)* $15 1H ACV 3Q ACV $13 $10 € 3.2 € 4.1 € 3.8 € 2.7 € 3.0 € 3.2 $8 € 2.7 € 2.0 € 2.3 € 3.2 $5 $3 $0 2003 04 05 06 07 08 09 10 11 2012 Global Market YTD Counts* 800 1H Counts 3Q Counts 700 600 243 500 196 189 187 400 179 112 129 147 300 115 80 200 © 2012 100 Information Services Group, Inc. - All Rights Reserved 2003 04 05 06 07 08 09 10 11 2012 isg-one.com *Contracts with ACV > €4M
  • 7. 7 Global Market Contract Trends for the Largest Deals 26 mega-relationships have been awarded YTD, surpassing total for all of 2011; greater percentage of larger deal activity occurring in emerging markets. YTD Contracts Counts with ACV > €80M 1H Counts 3Q Counts 30 3 6 8 20 9 10 5 6 4 4 10 5 0 2003 04 05 06 07 08 09 10 11 2012 Emerging Markets Contract Counts with ACV > €40M Emerging Markets 16 e defined as outside 8 8 North 7 American, Western 4 Europe and ANZ © 2012 markets. Information Services Group, Inc. All Rights Reserved 2008 2009 2010 2011 2012e isg-one.com *Contracts with ACV > €4M
  • 8. 8 EMEA Contract Award Trends EMEA ACV was down 13% Y/Y but up 18% Q/Q; both restructuring and new scope activity is down year to date. EMEA YTD ACV (€B)* 1H ACV 3Q ACV $8 $6 € 1.6 € 1.4 € 2.3 $4 € 2.0 € 1.1 € 1.3 € 1.2 € 1.5 € 1.0 € 1.2 $2 $0 2003 04 05 06 07 08 09 10 11 2012 EMEA YTD Counts* EMEA New Scope vs. Restructuring YTD ACV (€B)* 1H Counts 3Q Counts YTD New Scope YTD Restructured 400 € 3.9 300 109 € 3.2 € 3.6 € 3.6 93 80 200 87 85 60 100 € 0.3 € 1.9 € 2.2 € 1.9 © 2012 Information - Services Group, Inc. All Rights Reserved 07 08 09 10 11 2012 2003 04 05 06 07 08 09 10 11 2012 isg-one.com *Contracts with ACV > €4M
  • 9. 9 EMEA Country Details in Contract Award Trends ACV awards in the UK rose substantially YTD, while DACH fell almost 40% on a tough compare with 2011 and Nordics dropped by 17% YTD Sub-regions for EMEA - ACV (€B)* Low Average 3Q11 YTD 3Q12 YTD € 3.0 € 2.8 € 2.5 € 2.40 € 2.3 € 2.0 € 1.8 € 1.5 € 1.3 € 1.0 € 1.05 € 0.83 € 0.8 € 0.61 € 0.5 € 0.3 € 0.22 € 0.09 € 0.16 € 0.17 €- © 2012 Information UK & Ireland DACH Scandinavia Benelux France Southern Africa & E. Europe & Services Group, Inc. All Rights Reserved Europe Middle East Russia isg-one.com *Contracts with ACV > €4M
  • 10. 10 EMEA ITO Contract Award Trends Third quarter ITO ACV was one of the strongest on record, up 40% Q/Q . Year to date ACV is down around 20%, while contract numbers fell 24% EMEA ITO YTD ACV (€B)* 1H ACV 3Q ACV €5 Top EMEA ITO € 1.1 €4 € 1.1 € 1.9 Providers € 0.9 €3 € 0.9 € 1.1 € 1.4 by YTD ACV* €2 € 1.0 € 1.3 € 0.5 Accenture €1 Atos €0 BT 2003 04 05 06 07 08 09 10 11 2012 Capgemini CSC Fujitsu EMEA ITO YTD Counts* HCL 1H Counts 3Q Counts HP 250 IBM Infosys 200 69 Mahindra Satyam 70 150 59 61 56 Orange 100 37 TCS 21 31 T-Systems 29 32 50 Wipro © 2012 Information - Services Group, Inc. All Rights Reserved 2003 04 05 06 07 08 09 10 11 2012 Note: Service providers in alphabetical order; no rankings implied. isg-one.com *Contracts with ACV > €4M
  • 11. 11 EMEA BPO Contract Award Trends Year to Date ACV in 2012 has been the highest ever in EMEA, though the pace of contract awards has slowed. EMEA BPO YTD ACV (€B)* 1H ACV 3Q ACV € 2.5 Top EMEA BPO € 2.0 € 0.61 Providers € 1.5 € 0.47 € 0.41 by YTD ACV* € 1.0 € 0.44 € 0.23 € 0.26 € 0.20 € 0.18 Accenture € 0.5 € 0.32 € 0.35 Capgemini € 0.0 CGI 2003 04 05 06 07 08 09 10 11 2012 HCL HP EMEA BPO YTD Counts* Infosys Interserve Plc 1H Counts 3Q Counts ISS Global A/S 125 Johnson Controls Jones Lang LaSalle 100 40 Mahindra Satyam 24 75 33 Mitie 50 28 23 24 Serco 12 14 23 Sodexho 25 11 © 2012 Xchanging Information - Services Group, Inc. All Rights Reserved 2003 04 05 06 07 08 09 10 11 2012 Note: Service providers in alphabetical order; no rankings implied. isg-one.com *Contracts with ACV > €4M
  • 12. 12 EMEA Industry Details in Contract Award Trends The Financial Services sector accounted for the lion’s share of contract awards in 2012, up almost 60% Y/Y. YTD Industry Details for EMEA - ACV (€B)* Low Average 3Q11 YTD 3Q12 YTD € 2.5 € 2.0 € 1.95 € 1.5 € 1.22 € 1.0 € 0.86 € 0.5 € 0.56 € 0.41 € 0.20 € 0.21 € 0.12 €- © 2012 Information Services Group, Inc. All Rights Reserved isg-one.com *Contracts with ACV > €4M
  • 13. 13 Americas Contract Award Trends Americas ACV was down 11% Y/Y and 8% Q/Q; YTD, ACV is flat; the U.S. is becoming a predominantly restructuring-based market. Americas YTD ACV (€B)* 1H ACV 3Q ACV €8 €6 € 1.4 €4 € 0.9 € 1.4 € 0.9 € 1.5 € 1.9 € 1.5 € 1.3 € 0.8 € 1.0 €2 €0 2003 04 05 06 07 08 09 10 11 2012 Americas YTD Counts* Americas New Scope vs. Restructuring YTD ACV (€B)* 1H Counts 3Q Counts YTD New Scope YTD Restructured 350 300 106 € 3.4 € 3.9 250 86 € 3.0 79 77 200 67 € 2.4 150 63 100 € 1.9 € 1.9 50 € 1.1 € 1.2 © 2012 Information - Services Group, Inc. All Rights Reserved 07 08 09 10 11 2012 2003 04 05 06 07 08 09 10 11 2012 isg-one.com *Contracts with ACV > €4M
  • 14. 14 Asia Pacific Contract Award Trends Asia Pacific ACV was up Y/Y and Q/Q; YTD, ACV is up significantly; over 90% of YTD awards are new scope. Asia Pacific YTD ACV (€B)* 1H ACV 3Q ACV € 2.5 € 2.0 € 1.5 € 0.54 € 0.44 € 1.0 € 0.29 € 0.15 € 0.35 € 0.35 € 0.46 € 0.5 € 0.36 € 0.12 € 0.22 € 0.0 2003 04 05 06 07 08 09 10 11 2012 Asia Pacific YTD Counts* Asia Pacific New Scope vs. Restructuring YTD ACV (€B)* 1H Counts 3Q Counts YTD New Scope YTD Restructured 100 80 28 30 € 1.83 60 24 18 € 0.80 24 25 € 0.33 40 20 € 0.01 € 0.33 € 0.11 © 2012 Information - Services Group, Inc. All Rights Reserved 07 08 09 10 11 2012 2003 04 05 06 07 08 09 10 11 2012 isg-one.com *Contracts with ACV > €4M
  • 15. 15 Assessing the Level of Cloud Adoption 1 Percentage of ISG Advised Contracts with Cloud in Scope 27% 2 Number of Industrywide Contracts with Cloud in Scope* 20% ↑100% 300e 9% 220 110 2010 2011 2012 YTD 2010 2011 2012e 3 ISG Quarterly Provider Survey: Cloud Computing Provider Pipeline ► Half have cloud scope in 25% of their pipeline opportunities ► Cloud-based opportunities are up over previous periods ► All providers expect cloud services to grow faster than traditional ITO, predominantly in the U.S. market © 2012 Information Services Group, Inc. All Rights Reserved isg-one.com *ISG Contracts Knowledgebase® *Contracts with ACV > €4M
  • 16. 16 Recognising the Realities of Cloud Deployment Cloud Strategy Cloud Deployment Models Public Cloud Private Cloud Shared Infrastructure Dedicated Infrastructure Opportunity Perceived Risk Caution! • Economies Security & data Does not fully of Scale privacy concerns realise cloud’s • Standard promise • Modern Converged / Utility / Dynamic IaaS SaaS BPaaS Computing © 2012 Information Services Group, Inc. All Rights Reserved Cloud Service Models isg-one.com *Contracts with ACV > €4M
  • 17. 17 Opportunities and Challenges in the Provider Community Traditional Multinational Providers Expansion of existing ITO business India-heritage Pure-play SaaS and IaaS Providers Integrating acquisitions Providers Application Unbound by legacy 1 transformation and constraints modernisation 2 5 Security and privacy Solution Reliance on infrastructure concerns Assessment partners 4 Mid-market Traditional Software 3 Hosting Providers Companies Innovative shared hosting Existing relationship with platforms IT and procurement Supporting large, complex © 2012 Cannibalisation of licence clients Information Services Group, Inc. revenue streams All Rights Reserved isg-one.com *Contracts with ACV > €4M
  • 18. 18 Cloud Trends Cloud’s disruptive effects on sourcing will accelerate, especially for the sourcing market’s traditional IT providers. Less Disruptive Trends IaaS will lag in favour of dedicated, standardised and virtualised infrastructure services Cloud growth will be choppy at the enterprise level with SaaS leading the way in HR, CRM and collaboration Traditional IT providers face significant pressure from well- known software vendors, nimble mid-market players and emerging pure-play infrastructure and SaaS providers Buyer type shifting from the IT department to the functional business units, especially SaaS-based HR and CRM Highly © 2012 Disruptive Information Services Group, Inc. Trends All Rights Reserved isg-one.com *Contracts with ACV > €4M
  • 19. 19 3Q12 TPI Index Summary and Outlook  EMEA ACV rose 14% Q/Q but year-to-date is down 8%  Broader Market 3Q ACV down due to tough 3Q11 compare market  YTD ACV strengthened slightly on larger contracts, BPO summary and Asia Pacific results  Contract counts fell Q/Q and year-to-date from 2011 but remain within broader historical norms  While TCV performance may lag, from an ACV perspective, market the end result will likely be in line with recent year’s outlook performance of approximately €16 billion © 2012 Information Services Group, Inc. All Rights Reserved isg-one.com *Contracts with ACV > €4M
  • 20. 20 Learn More Please contact us with your questions and comments. ► John Keppel ► Duncan Aitchison Partner & President Research & Partner & President Managed Services and Chief North Europe, ISG Marketing Officer +44 7879 471 758 +44 7879 432 212 duncan.aitchison@isg-one.com john.keppel@isg-one.com --- Media Contacts --- ► Denise Colgan ► Louise Fernley Marketing Director, EMEA, ISG Cohn & Wolfe for ISG +44 1737 371523 +44 207 331 5365 denise.colgan@isg-one.com louise.fernley@cohnwolfe.com © 2012 Information Services Group, Inc. All Rights Reserved isg-one.com blog.isg-one.com *Contracts with ACV > €4M
  • 22. 22 3Q12 TCV Score Card The TPI Index has moved to ACV as the primary measure of the Broader Market. In transition, we will continue to provide a high-level TCV view of the market via a Scorecard analysis. 3Q12 TCV 3Q Y/Y 3Q Q/Q YTD TCV YTD Y/Y Scorecard (€B)* Change Change (€B)* Change Global Market € 19.6 -12% -2% € 57.1 -3% Mega Deals € 4.5 -22% -11% € 10.8 0% New Scope € 13.0 12% -13% € 38.4 -3% Restructurings € 6.6 -38% 31% € 18.7 -2% ITO € 12.7 -21% 7% € 36.2 -7% BPO € 6.9 10% -15% € 20.9 6% EMEA € 10.0 -21% 18% € 27.1 -15% Americas € 7.1 -8% -6% € 22.2 4% Asia Pacific € 2.5 37% -37% € 7.8 45% © 2012 Information Services Group, Inc. All Rights Reserved isg-one.com *Contracts with ACV > €4M