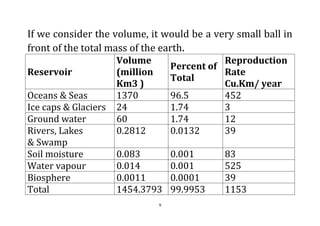
Water is the most precious gift of mother nature. Hydrology is the scientific study of the origin, occurrence, properties, distribution, and effects of water on the Earth’s surface, in the soil and in the underlying rocks, and also in the atmosphere. This module explain's the distribution of water in the global hydrosphere.
Biogeochemical cycle, any of the natural pathways by which essential elements of living matter are circulated. The term biogeochemical is a contraction that refers to the consideration of the biological, geological, and chemical aspects of each cycle.
The lithosphere is the solid shell of the planet Earth. That means the crust, plus the part of the upper mantle that behaves elastically on long timescales.
Marine ecology deals with the study of the environment and life in marine waters. It involves the study of marine organisms and their habitat. The details of marine ecosystems are given in this module.
Looks at the question of:
HOW MANY BIOMES?
There is no clear answer and the powerpoint goes through the possible answers.
It concludes to five basic biomes that include ‘sub-biomes’.
You need to download PowerPoint in order to view animations.
There is a WORKSHEET that accompanies this POWERPOINT at:
http://www.slideshare.net/yaryalitsa/biomes-worksheet
The rates of movement of water and the quantities involved the cyclic processes are the major aspects involved in the hydrological sciences. There is an endless circulation of water among all the spheres of the earth. It is popularly known as the hydrologic cycle. It is necessary to learn about the hydrologic cycle, when we intend analyse the water resources of the region and the world.
Chapter 1.pptx:INTRODUCTION TO HYDROLOGYmulugeta48
For knowing the sources of water in an area.
For knowing quality and quantity of water in an area.
For distribution of river water for full filling of different
area`s forming needs.
Tremendous importance is given to the hydrology all over
the world in the development and management of water
resources for irrigation, water supply, flood control, waterlogging
and salinity control, Hydro power and navigation.
The maximum probable flood that may occur at a given site
and its frequency; this is required for the safe design of
drains and culverts, dams and reservoirs, channels and other
flood control structures.
is fundamental to the functioning of the Earth as it recycles water, and has a role in modifying and regulating the Earth's climate.
E-content is a Comprehensive package of teaching material put into hypermedia format. Hypermedia is multimedia with internet deplorability. E-content can not be created by a teaching faculty alone . It needs the role of teacher, Video editor, production assistants, web developers (HTML 5 or Adobe captivate, etc). Analyze the learner needs and goals of the instructional material development, development of a delivery system and content, pilot study of the material developed, implementation, evaluating, refining the materials etc. In designing and development of E-content we have to adopt one of the instructional design models based on our requirements.
Pedagogy is the most commonly understood approach to teaching. It refers to the theory and practice of learning. Pedagogy is often described as the act of teaching. Pedagogy has little variations between traditional teaching and online teaching. Online teaching pedagogy is a method of effective teaching practice specifically developed for teaching via the internet. It has a set of prescribed methods, strategies, and practices for teaching academic subjects in an online (or blended) environment, where students are in a physical location separate from the faculty member.
Technology has changed the possibilities within teaching and learning. Classes, which prior to the digital era were restricted to lectures, talks, and physical objects, no longer have to be designed in that manner. Training in a synchronous virtual classroom can only be successful with the active participation and engagement of the learners. Explore the Virtual Classroom’s features and see how they can support and enhance your tutoring style.
• The monitoring and evaluation of the institutional processes require a carefully structured system of internal and external review. The NAAC expects the Institutions to undertake continuous Academic and Administrative Audits (AAA). This presentation is intended to serve as advisory to all accredited HEIs who volunteer to undertake AAA. The pros and cons of this process are also highlighted. Academic and Administrative Audit is the process of evaluating the efficiency and effectiveness of the administrative procedure. It includes assessment of policies, strategies & functions of the various administrative departments, control of the overall administrative system, etc. This checklist gives an overview what the audit committee members may look into while visiting an institution for this purpose. It invariably follows the Quality Indicators Framework prescribed by Accreditation Council in India.
• The monitoring and evaluation of the institutional processes require a carefully structured system of internal and external review. The NAAC expects the Institutions to undertake continuous Academic and Administrative Audits (AAA). This presentation is intended to serve as advisory to all accredited HEIs who volunteer to undertake AAA.
Chemical analysis data of water samples can not be used directly for understanding. They are to be used for various calculations in order to determine the quality parameters that have a lot of significances. A. Balasubramanian and D. Nagaraju, of the Department of Studies in Earth Science, Centre for Advanced Studies, University of Mysore, Mysore-570006, Karnataka, India have recently brought out a software and its application manual as a good book for reference and execution. The Name of the software is WATCHIT meaning Water Chemistry Interpretation Techniques. This software computes more than 100 parameters pertaining to water quality interpretations. The software follows its own method of approach to determine the required results. Systems International Units are used. Limited input parameters are required. This is suitable for all scientific research, government water quality data interpretations and for understanding the quality of water before using it.
Water conservation refers to reducing the usage of water and recycling of waste water for different purposes like domestic usage, industries, agriculture etc. This technical article highlights most of the popular methods of water conservation. A special note on rainwater harvesting is also provided.
This module gives an overview of general applications of current hydrogeological aspects. It is for the basic understanding of students and research scholars.
Climate Extreme (extreme weather or climate event) refers to the occurrence of a value of a weather or climate variable above (or below) a threshold value near the upper (or lower) ends of the range of observed values of the variable. Extreme weather and climate events, interacting with exposed and vulnerable human and natural systems, can lead to disasters.
WATER RESOURCES PLANNING AND MANAGEMENT POSSIBILITIES IN CHAMARAJANAGAR TALUK...Prof. A.Balasubramanian
Any unplanned development and utilization of water resources with result in water scarcity. In many parts of the developing world. Such a situation exists. In order to do proper planning and
management of water resources, it is necessary to conduct detailed analyses of the factors, which influence the water availability and its uses. In the present study, a comprehensive analysis have been undertaken for proper utilization of water resources in Chamarajanagar Taluk, which has been identified as one of the drought hit districts of Karnataka, in India. The factors analysed in this work are, surface and groundwater availability, land use, cropping pattern, recharge potential of soils and the rainfall pattern in typical areas of Taluk. It is observed that the problem of water scarcity is mainly due to the lack of irrigation planning and management. Hence, a
modified cropping pattern is suggested by taking into consideration of all available water resources and other conditions.
In broad terms, cultural geography examines the cultural values, practices, discursive and material expressions and artefacts of people, the cultural diversity and plurality of society.
It also emphasizes on how cultures are distributed over space, how places and identities are produced, how people make sense of places and build senses of place, and how people produce and communicate knowledge and meaning.
Minerals are formed by changes in chemical energy in systems which contain one fluid or vapor phase. In nature, minerals are formed by crystallisation or precipitation from concentrated solutions. These solutions are called as ore-bearing fluids. Ore-bearing fluids are characterised by high concentration of certain metallic or other elements.
Fluids are the most effective agents for the transport of material in the mantle and the Earth's crust.
Soils are complex mixers forming the skin of the earth's surface. Soil is a dynamic layer in which many complex chemical, physical and biological activities are going on constantly. Soils become adjusted to conditions of climate, landform and vegetation, and will change internally when those controlling conditions change. Soils are products of weathering. Soils play a dominant role in earth's geomorphic processes in a cyclic manner. The characteristics of soils are very essential for several reasons. This module highlights these characteristics.
GIS TECHNIQUES IN WATER RESOURCES PLANNING AND MANAGEMENT IN CHAMARAJANAGAR ...Prof. A.Balasubramanian
The over-exploitation and contamination of groundwater continue to threaten the long-term sustainability of our precious water resources, in spite of the best efforts made by various agencies.
This has many serious implications to the economic development of a country like India. Lack of
judicious planning and integration of environmental consideration to ground water development
projects are primarily responsible for such a state of affair in the ground water sector. Geographical Information Systems could be of immense help in planning sustainable ground water management strategies, especially in hard rock areas with limited ground water potential. Data collected from
Satellite Imagery and through field investigations have been integrated, on a GIS platform, for demarcation and prioritization of areas suitable for ground water development and ground water augmentation. An attempt has also been made to assess the vulnerability of the area to ground water
contamination. This paper demonstrates the utility of GIS in planning judicious management of ground water resources in a typical hard rock area of Chamarajanagar Taluk, Karnataka, state India.
Nanobiomaterials are very effective components for several biomedical and pharmaceutical studies. Among the metallic, organic, ceramic and polymeric nanomaterials, metallic nanomaterials have shown certain prominent biomedical applications. Enormous works have been done to synthesize, analyse and administer the metallic nanoparticles for various kinds of medical and therapeutic applications, during the last forty years. In these analyses, the prominent biomedical applications of ten metallic nanobiomaterials have been reviewed from various sources and works. It has been found that almost nine of them are used in a very wide spectrum of medical and theranostic applications.
A variety of Nano-biomaterials are synthesised, characterised and tested to find out their potentialities by global scientific communities, during the last three decades. Among those, nanostructured ceramics, cements and coatings are being considered for major use in orthopaedic, dental and other medical applications. The development of novel biocompatible ceramic materials with improved biomedical functions is at the forefront of health-related applications, all over the world. Understanding of the potential biomedical applications of ceramic nanomaterials will provide a major insight into the future developments. This study reviews and enlists the prominent potential biomedical applications of ceramic nanomaterials, like Calcium Phosphate (CaP), Tri-Calcium Phosphate (TCP), Hydroxy-Apatite(HAP), TCP+HAP, Si substituted HAP, Calcium Sulphate and Carbonate, Bioactive Glasses, Bioactive Glass Ceramics, Titania-Based Ceramics, Zirconia Ceramics, Alumina Ceramcis and Ceramic Polymer Composites.
The present forest and tree cover of the country is 78.37 million ha in 2007 which is 23.84% of the geographical areas and it includes 2.82% tree cover. This becomes 25.25%, if the areas above tree line i.e., 4000m are excluded from the total geographical area. The forest cover is classified into 3 canopy density classes.
1. Very Dense Forest (VDF) with canopy density more than 70%
2. Moderately Dense Forest (MDF) with Canopy density between 40-70% and
3. Open Forest (OF) with Canopy density between 10-40%
The ability to recreate computational results with minimal effort and actionable metrics provides a solid foundation for scientific research and software development. When people can replicate an analysis at the touch of a button using open-source software, open data, and methods to assess and compare proposals, it significantly eases verification of results, engagement with a diverse range of contributors, and progress. However, we have yet to fully achieve this; there are still many sociotechnical frictions.
Inspired by David Donoho's vision, this talk aims to revisit the three crucial pillars of frictionless reproducibility (data sharing, code sharing, and competitive challenges) with the perspective of deep software variability.
Our observation is that multiple layers — hardware, operating systems, third-party libraries, software versions, input data, compile-time options, and parameters — are subject to variability that exacerbates frictions but is also essential for achieving robust, generalizable results and fostering innovation. I will first review the literature, providing evidence of how the complex variability interactions across these layers affect qualitative and quantitative software properties, thereby complicating the reproduction and replication of scientific studies in various fields.
I will then present some software engineering and AI techniques that can support the strategic exploration of variability spaces. These include the use of abstractions and models (e.g., feature models), sampling strategies (e.g., uniform, random), cost-effective measurements (e.g., incremental build of software configurations), and dimensionality reduction methods (e.g., transfer learning, feature selection, software debloating).
I will finally argue that deep variability is both the problem and solution of frictionless reproducibility, calling the software science community to develop new methods and tools to manage variability and foster reproducibility in software systems.
Exposé invité Journées Nationales du GDR GPL 2024
Deep Behavioral Phenotyping in Systems Neuroscience for Functional Atlasing a...Ana Luísa Pinho
Functional Magnetic Resonance Imaging (fMRI) provides means to characterize brain activations in response to behavior. However, cognitive neuroscience has been limited to group-level effects referring to the performance of specific tasks. To obtain the functional profile of elementary cognitive mechanisms, the combination of brain responses to many tasks is required. Yet, to date, both structural atlases and parcellation-based activations do not fully account for cognitive function and still present several limitations. Further, they do not adapt overall to individual characteristics. In this talk, I will give an account of deep-behavioral phenotyping strategies, namely data-driven methods in large task-fMRI datasets, to optimize functional brain-data collection and improve inference of effects-of-interest related to mental processes. Key to this approach is the employment of fast multi-functional paradigms rich on features that can be well parametrized and, consequently, facilitate the creation of psycho-physiological constructs to be modelled with imaging data. Particular emphasis will be given to music stimuli when studying high-order cognitive mechanisms, due to their ecological nature and quality to enable complex behavior compounded by discrete entities. I will also discuss how deep-behavioral phenotyping and individualized models applied to neuroimaging data can better account for the subject-specific organization of domain-general cognitive systems in the human brain. Finally, the accumulation of functional brain signatures brings the possibility to clarify relationships among tasks and create a univocal link between brain systems and mental functions through: (1) the development of ontologies proposing an organization of cognitive processes; and (2) brain-network taxonomies describing functional specialization. To this end, tools to improve commensurability in cognitive science are necessary, such as public repositories, ontology-based platforms and automated meta-analysis tools. I will thus discuss some brain-atlasing resources currently under development, and their applicability in cognitive as well as clinical neuroscience.
BREEDING METHODS FOR DISEASE RESISTANCE.pptxRASHMI M G
Plant breeding for disease resistance is a strategy to reduce crop losses caused by disease. Plants have an innate immune system that allows them to recognize pathogens and provide resistance. However, breeding for long-lasting resistance often involves combining multiple resistance genes
Phenomics assisted breeding in crop improvementIshaGoswami9
As the population is increasing and will reach about 9 billion upto 2050. Also due to climate change, it is difficult to meet the food requirement of such a large population. Facing the challenges presented by resource shortages, climate
change, and increasing global population, crop yield and quality need to be improved in a sustainable way over the coming decades. Genetic improvement by breeding is the best way to increase crop productivity. With the rapid progression of functional
genomics, an increasing number of crop genomes have been sequenced and dozens of genes influencing key agronomic traits have been identified. However, current genome sequence information has not been adequately exploited for understanding
the complex characteristics of multiple gene, owing to a lack of crop phenotypic data. Efficient, automatic, and accurate technologies and platforms that can capture phenotypic data that can
be linked to genomics information for crop improvement at all growth stages have become as important as genotyping. Thus,
high-throughput phenotyping has become the major bottleneck restricting crop breeding. Plant phenomics has been defined as the high-throughput, accurate acquisition and analysis of multi-dimensional phenotypes
during crop growing stages at the organism level, including the cell, tissue, organ, individual plant, plot, and field levels. With the rapid development of novel sensors, imaging technology,
and analysis methods, numerous infrastructure platforms have been developed for phenotyping.
The use of Nauplii and metanauplii artemia in aquaculture (brine shrimp).pptxMAGOTI ERNEST
Although Artemia has been known to man for centuries, its use as a food for the culture of larval organisms apparently began only in the 1930s, when several investigators found that it made an excellent food for newly hatched fish larvae (Litvinenko et al., 2023). As aquaculture developed in the 1960s and ‘70s, the use of Artemia also became more widespread, due both to its convenience and to its nutritional value for larval organisms (Arenas-Pardo et al., 2024). The fact that Artemia dormant cysts can be stored for long periods in cans, and then used as an off-the-shelf food requiring only 24 h of incubation makes them the most convenient, least labor-intensive, live food available for aquaculture (Sorgeloos & Roubach, 2021). The nutritional value of Artemia, especially for marine organisms, is not constant, but varies both geographically and temporally. During the last decade, however, both the causes of Artemia nutritional variability and methods to improve poorquality Artemia have been identified (Loufi et al., 2024).
Brine shrimp (Artemia spp.) are used in marine aquaculture worldwide. Annually, more than 2,000 metric tons of dry cysts are used for cultivation of fish, crustacean, and shellfish larva. Brine shrimp are important to aquaculture because newly hatched brine shrimp nauplii (larvae) provide a food source for many fish fry (Mozanzadeh et al., 2021). Culture and harvesting of brine shrimp eggs represents another aspect of the aquaculture industry. Nauplii and metanauplii of Artemia, commonly known as brine shrimp, play a crucial role in aquaculture due to their nutritional value and suitability as live feed for many aquatic species, particularly in larval stages (Sorgeloos & Roubach, 2021).
Observation of Io’s Resurfacing via Plume Deposition Using Ground-based Adapt...Sérgio Sacani
Since volcanic activity was first discovered on Io from Voyager images in 1979, changes
on Io’s surface have been monitored from both spacecraft and ground-based telescopes.
Here, we present the highest spatial resolution images of Io ever obtained from a groundbased telescope. These images, acquired by the SHARK-VIS instrument on the Large
Binocular Telescope, show evidence of a major resurfacing event on Io’s trailing hemisphere. When compared to the most recent spacecraft images, the SHARK-VIS images
show that a plume deposit from a powerful eruption at Pillan Patera has covered part
of the long-lived Pele plume deposit. Although this type of resurfacing event may be common on Io, few have been detected due to the rarity of spacecraft visits and the previously low spatial resolution available from Earth-based telescopes. The SHARK-VIS instrument ushers in a new era of high resolution imaging of Io’s surface using adaptive
optics at visible wavelengths.
Nucleophilic Addition of carbonyl compounds.pptxSSR02
Nucleophilic addition is the most important reaction of carbonyls. Not just aldehydes and ketones, but also carboxylic acid derivatives in general.
Carbonyls undergo addition reactions with a large range of nucleophiles.
Comparing the relative basicity of the nucleophile and the product is extremely helpful in determining how reversible the addition reaction is. Reactions with Grignards and hydrides are irreversible. Reactions with weak bases like halides and carboxylates generally don’t happen.
Electronic effects (inductive effects, electron donation) have a large impact on reactivity.
Large groups adjacent to the carbonyl will slow the rate of reaction.
Neutral nucleophiles can also add to carbonyls, although their additions are generally slower and more reversible. Acid catalysis is sometimes employed to increase the rate of addition.
This presentation explores a brief idea about the structural and functional attributes of nucleotides, the structure and function of genetic materials along with the impact of UV rays and pH upon them.
ANAMOLOUS SECONDARY GROWTH IN DICOT ROOTS.pptxRASHMI M G
Abnormal or anomalous secondary growth in plants. It defines secondary growth as an increase in plant girth due to vascular cambium or cork cambium. Anomalous secondary growth does not follow the normal pattern of a single vascular cambium producing xylem internally and phloem externally.
hematic appreciation test is a psychological assessment tool used to measure an individual's appreciation and understanding of specific themes or topics. This test helps to evaluate an individual's ability to connect different ideas and concepts within a given theme, as well as their overall comprehension and interpretation skills. The results of the test can provide valuable insights into an individual's cognitive abilities, creativity, and critical thinking skills
What is greenhouse gasses and how many gasses are there to affect the Earth.moosaasad1975
What are greenhouse gasses how they affect the earth and its environment what is the future of the environment and earth how the weather and the climate effects.
1. 1
THE WORLD'S WATER- HYDROSPHERE
By
PROF. A . Balasubramanian
Centre for Advanced Studies in Earth Science
UNIVERSITY OF MYSORE
MYSORE-6
2. 2
The Hydrosphere
The term ‘hydrosphere’ refers to the sphere of
water on earth.
It is derived from the Greek word, “hydor” means
water and “sphera “ means sphere.
It refers to the water on or surrounding the surface
of the globe.
It is the segment that includes all forms of water
distributed over atmosphere, lithosphere, and
biosphere.
3. 3
When we think of the planet earth, both the land
and oceans come to our mind.
Land makes only a small part of the world’s surface
but water makes up to 70% of the earth’s surface.
Water is not only present is seas and oceans, but
also as ice caps glaciers, rivers, lakes, reservoirs,
soil water, ground water and atmospheric water
vapour.
4. 4
Similar to the variation of pressure and
temperature with reference to altitude in
atmosphere, there is a remarkable variation in the
physic-chemical properties with reference to the
depth of water masses.
The average annual rainfall over land amounts to
119 000 km3. Out of this, some 74 000 km3 of
water gets evaporated back into the atmosphere.
The remaining 45 000 km3 of water flows into
lakes, reservoirs and streams or infiltrate into the
ground to replenish the subsurface formations.
5. 5
This represents what is traditionally known as the
"water resources of the world".
Not all of these 45 000 km3 are accessible for
human use.
This is due to the reason that part of the water
flows into rivers and during seasonal floods. An
estimated 9 000 - 14 000 km3 of water alone may
be economically available for human use and
consumption. The actual annual withdrawals of
water for human use amounts to about 3 600 km3.
6. 6
Distribution of water on Earth
The earth has about 1.386 billion cubic kilometers
of water.
In this, about 97% lies in the form of seas and
oceans, containing salt water.
More than 2% exists as ice caps and glaciers, and
about 1% is spread in the form of rivers, lakes,
ground water and water vapour.
Almost 97% of the water existing in the
hydrosphere is distributed as seas and oceans.
These are all saline water masses.
7. 7
They are not suitable for direct consumption like
drinking, cooking and for industries and
irrigational purposes.
Only 3% of the water available on earth is fresh
water.
If we look at the further distribution of freshwater
alone, almost 66.7% is locked up in the form of ice
caps and glaciers.
About 30.1% is existing below the surface as
groundwater.
8. 8
The surface water, which is directly available on
the land surface is only 0.3% the rest 0.9% are
existing as water vapour and soil water.
The surface water available as 0.3% is shared by
lakes, swamps and running water as rivers. In this,
a very small proportion exists as biological water.
If all the earth’s water are put together, is the form
of a sphere, then the diameter of that water ball
would be about 1385 km.
9. 9
If we consider the volume, it would be a very small ball in
front of the total mass of the earth.
Reservoir
Volume
(million
Km3 )
Percent of
Total
Reproduction
Rate
Cu.Km/ year
Oceans & Seas 1370 96.5 452
Ice caps & Glaciers 24 1.74 3
Ground water 60 1.74 12
Rivers, Lakes
& Swamp
0.2812 0.0132 39
Soil moisture 0.083 0.001 83
Water vapour 0.014 0.001 525
Biosphere 0.0011 0.0001 39
Total 1454.3793 99.9953 1153
10. 10
Inventory of World’s Water
If we look at the inventory of world’s water
distribution, the
a) Oceans, and seas contain about 1370
M.Cu.Km.
b) Ice caps and glaciers contain about 24 M.Cu.
km.
c) Groundwater constitutes almost 60.0
M.Cu.Km.
d) Rivers, streams lakes and swamps contain
about 0.2812 M.Cu.km.
11. 11
e) Soil moisture constitutes about 0.083M Cu
Km.
f) Water vapour contains about 0.014 M Cu Km
and
g) the biosphere contain about 0.0011 M Cu Km.
of water.
All of these water masses are called as water
reservoirs of the earth. On an average water is
renewed in rivers every 16 days. Water in the
atmosphere is completely replaced once in every 8
days.
12. 12
The replacement is show in lake lakes, glaciers and
in groundwater systems. The reproduction rate
also varies from one reservoir to the other.
It is highest for the water present in the
atmosphere and lowest in the ice caps and glaciers.
Residence time of water in major reservoirs
The residence time of a water reservoir within the
hydrologic cycle is the average time a water
molecule will spend within that reservoir.
It is a measure of the average age of the water in
that reservoir. Residence time can be estimated in
two ways.
13. 13
The more common method relies on the principle
of conservation of mass and assumes that the
amount of water in a given reservoir is roughly
constant.
In this method, the residence times are estimated
by dividing the volume of the reservoir by the rate
by which water either enters or exits the reservoir.
Dating the age of water using isotopic techniques
is the second popular method.
The following table shows the approximate
residence time of water in major reservoirs.
14. 14
Major Reservoirs Approximate Residence Time
Oceans and seas >100000 years
Glaciers 40 years
Seasonal Snow Cover 0.4
Soil moisture 0.2
Shallow Groundwater 200
Deep Groundwater 10000
Lakes 100 years
Rivers 0.4 years
The residence time of water in the atmosphere is
about 9 days before condensing and falling to the
Earth as precipitation.
Deep groundwater may stay over 10,000 years
beneath Earth's surface.
15. 15
The Ice from the Antarctica has been estimated to
of the age of 800,000 years before present.
Country-wise water resources
According to the Food and Agriculture
Organisation(FAO), the total water resources in
the world are estimated in the order of 43 750
km3/year.
This is distributed throughout the world according
to the patchwork of climates and physiographic
structures.
16. 16
At the continental level, America has the largest
share of the world’s total freshwater resources
with 45 percent, followed by Asia with 28 percent,
Europe with 15.5 percent and Africa with 9
percent.
In terms of resources per inhabitant in each
continent,
America has 24 000 m3/year,
Europe 9 300 m3/year,
Africa 5 000 m3/year and
Asia 3 400.1 m3/year.
17. 17
At a country level, there is an extreme variability in
these resources.
The ten poorest countries in terms of water
resources per inhabitant are Bahrain, Jordan,
Kuwait, Libyan Arab Jamahirya, Maldives, Malta,
Qatar, Saudi Arabia, United Arab Emirates and
Yemen.
In the large countries, water resources are also
distributed unevenly in relation to the population.
In addition to spatial variability, there is a high
variability in time within the year or among
different years.
18. 18
Thirty-three countries depend on other countries
for over 50 percent of their renewable water
resources requirement.
They are Argentina, Azerbaijan, Bahrain,
Bangladesh, Benin, Bolivia, Botswana, Cambodia,
Chad, Congo, Djibouti, Egypt, Eritrea, Gambia, Iraq,
Israel, Kuwait, Latvia, Mauritania, Mozambique,
Namibia, Netherlands, Niger, Pakistan, Paraguay,
Portugal, Republic of Moldova, Romania, Senegal,
Somalia, Sudan, Syrian Arab Republic,
Turkmenistan, Ukraine, Uruguay, Uzbekistan, Viet
Nam and Yugoslavia.
19. 19
Cyclic movement of water
The world’s water is not in static condition. It
moves from one reservoir to another reservoir and
also from one state to that of the other.
Water is in constant motion and circulated
between all these reservoirs.
The earth’s water moves from the oceans to the
air, air to the land and land to the oceans, again
and again.
20. 20
The sun’s radiant energy evaporates oceanic
waters into the atmosphere, as water vapour.
This moves towards the land and falls back as rain,
snow and sleet.
These slowly flow overland, fill up the lakes,
swamps and streams.
A part of these water masses percolate inside the
ground and join the groundwater.
The other surface water masses may flow towards
the sea and are subjected to evaporation and
transpiration processes.
21. 21
This endless circulation of water masses among
these reservoirs is known as the hydrologic cycle.
The hydrosphere interacts with the atmosphere
and lithosphere mainly through the water cycle
Natural reservoirs and conduits
Much amount of water on earth, gets circulated
within the lower part of the earth’s atmosphere. In
this region, water vapour is transported is all
directions.
The net effect is the movement from sea to air and
from air to land.
22. 22
The wind and pressure belts play a significant role
in this movement.
The shape, type, size and location of the reservoir
play a dominant role.
This also varies above the surface and below the
surface.
Water flowing in streams ultimately reach the
lakes or seas faster than the water which is flowing
below the surface.
The water entering into a lake after a rainfall may
be locked up from the movement, for several days
and months.
23. 23
Similarly, the water percolating below the rocks
through deep fractures in the earth’s crust may
also get locked up for many years.
Some fossil waters entrapped under geological
beds of rocks may be of several thousand years in
age.
It is also an important fact that the age of the water
residing in the oceans may be of several million
years.
24. 24
The Hydrologic Cycle
The hydrologic cycle involves a set of processes
that are everlasting processes.
The components of the hydrologic cycle, are:
1. Precipitation
2. Infiltration
3. Surface runoff
4. Transpiration
5. Groundwater baseflow
6. Interception
7. Evaporation from free water surfaces
8. Condensation
25. 25
9. Evopotraspiration
The hydrologic cycle forms the central concept in
all the scientific studies of water.
Human pressures at global to basin scales are
substantially modifying the global hydrologic
cycle.
26. 26
It has severe adverse impacts on its
interconnected aquatic ecosystems – both
freshwater and marine – and therefore on the
well-being of people who depend on the services
that they provide.
Components of the Hydrologic Cycle
The dynamic movements are coupled with changes
in the states of matter from liquid to vapour,
vapour to solid and liquid sequences.
The movements are also not uniform.
27. 27
There are varying rates and there are many short
circuits in the cycle also.
Sometimes, the residence time of water in a
reservoir gets increased due to stagnation of water
in that reservoir.
The routes of movement also varies. Some masses
follow the aerial routes, and some of them follow
the subterranean (subsurface) routes.
Much amount of water that are flowing over the
land, reach the seas and oceans, above the surface.
Groundwater also moves under the ground and
follows the subsurface path.
28. 28
Some amount of surface water may leave directly
in to the atmosphere through direct evaporation
from surface water bodies and also through
transpiration by vegetation.
The rainwater falling on the leaves of vegetation
also may get evaporated back in to the atmosphere
within a short span of time.
This is called as interception.
The water of the snow fields may get evaporated
directly into the atmosphere.
It is called as sublimation.
29. 29
The rates of movement of water and the quantities
of water involved in the cyclic process are the
major aspects involved in the hydrological
sciences.
The water vapour that are accumulated as
condensed clouds of the atmosphere, get
precipitated in the form of rain and snow and fall
on the earth’s surface, in liquid or solid forms.
The rainwater flows as surface water over the land
or infiltrates into the ground.
30. 30
No beginning and No end
Since the world’s major amount of water gets
stored in the seas and oceans, it is quite natural to
assume that the hydrologic cycle starts from
oceans and from evaporation.
Similarly, the precipitated rainwater may also be
presumed to be the starting point of hydrologic
cycle, as it comes from the atmosphere directly as
the primary source.
31. 31
Though we feel that the hydrologic the cycle
begins from evaporation (or) precipitation, it has
no beginning and no end.
It is a never ending cycle. It has endless circulation.
Factors controlling Hydrologic Cycle
Several factors control the circulation of water on
the earth.
32. 32
The following are the major factors, controlling the
hydrologic cycle:
1. Nature and application of energy that
promotes circulation.
2. Inherent properties of the water, air and
other masses
3. Structure of the natural reservoirs and their
conduits (channels) promoting movement
4. The earth’s gravitational attraction, which is
responsible to activate the flow.
33. 33
The hydrologic cycle has a direct link with the
monsoon cycle of a region.
Any drastic climatic variation or climatic change
that are occurring on the globe will have a direct
consequence on the circulation pattern of water on
the earth.
Source of Energy
The principal source of energy which mainly
drives the circulation process in the hydrologic
cycle is the sun’s radiant energy. It has the ability
to transform water from one state to the other.
34. 34
All the mechanical and chemical works are also
controlled by the radiation.
Solar energy can raise the temperature of water,
air, soil and promote various processes at different
altitudes and latitudes.
Adolph. F. Meyer, in the Elements of hydrology,
explains the role solar energy for water circulation.
The sun's energy vaporizes the water from the
surface of the earth.
The vapour thus formed is lighter than the dry
gases of the atmosphere, and hence it tends to rise.
35. 35
Aided by the convection currents, the water
vapour moves from place to place and upward
through the air.
On rising, it encounters a rarified atmosphere and
expands.
The energy required for the work of expansion is
drawn from the air itself, resulting in a cooling and
ultimate condensation of some of the vapour
which falls to the earth again as rain.
The precipitated water then starts on its way back
to the ocean.
36. 36
Some of it is lost through evaporation and some is
used by growing plants.
The most complete conservation of water can be
secured only by its fullest utilization, for so long as
the sun shines.
Distribution of Water in various reservoirs
Water in the World’s Oceans
As seen already, 97% of the world’s water lies in
oceans.
37. 37
Oceans have two inputs.
One is the directly precipitated water as rainfall,
which accounts for about 90% and the other one is
the runoff from the lands, which accounts for
about 10%.
Oceans have only one output as direct evaporation.
The residence time of water in the oceans is about
3000 years.
38. 38
The water which reside near the surface of the
ocean have shorter residence time than the water
of the deep ocean.
The deep water of oceans may have the residence
time of hundreds of thousands of years.
- Only the water available at the surface of the
ocean is involved in evaporation.
- Ocean water contains about 35gm/L of
dissolved salts, making it unfit for drinking and
other purposes.
- Distillation is the only way of making freshwater
from sea water.
39. 39
- Every day the sun evaporates millions of metric
tons of water from the oceans.
The distribution of water in the world’s oceans are
as follows:
Ocean Area in M.Sq.Km Volume M.C.Km
The Pacific 181.3 714.4
The Atlantic 94.3 337.2
The Indian 74.1 284.6
The Antarctic 20.3 --
The Arctic 12.25 13.7
Total 382.25 1349.9
40. 40
Oceanography is the branch of science that is
dealing with the physical, chemical, geological, and
biological features of the seas and oceans.
Oceanography deals with salt waters, whereas
limnology (Gr. limn, lake) usually deals with fresh
waters.
Water vapour in the Atmosphere
Moisture exists, in the atmosphere
1) As an invisible form called as water vapour
2) As liquid in the form of water molecules
3) As solid in the form of snow or ice.
41. 41
The amount of water vapour present in the
atmospheric air is called as humanity.
The amount of water present in the atmosphere is
volume-wise is equivalent to the volume of water
flowing through the rivers all over the world.
If we look at the rate of exchange between the
water in the atmosphere and on the earth,
everyday, it shows that approximately 2.5mm falls
as rain and about 2.5mm of water gets evaporated
from the surface.
42. 42
The average residence time of water in the
atmosphere is about 10 days.
It is also found that there is a complete exchange of
atmospheric moisture 40 times a year.
Water in Rivers and Streams
The rivers all over the globe seem to be primary
reservoirs of water.
The volume of water in the earth’s streams is very
small, accounting to only 0.001% of the total
world’s water.
43. 43
The flowing water along the streams at an average
rate is found to be of 3m3/second. (3 Cu. M per
second).
Although, the volume of water in rivers at a given
time is small, the total volume flowing through
them over a period of time is enormous.
The input mainly comes from precipitation and
groundwater base flow.
44. 44
Approximately half of the total river water inflow
to the world ocean falls into the Atlantic ocean,
from the Amazon, the Congo, the Orinoko and the
Parana Rivers.
Least amount of rainwater flows into the Arctic
Ocean.
Water as Ice and Snow
The fresh water available on the earth in the form
of ice constitutes about 80% and is 2% from the
world’s total water resource.
45. 45
Most of these are located in the great glaciers that
cover the North America and the Greenland, the
Antarctica, Asia and Europe.
Ice within glaciers moves slowly towards the
margins and its gets melted.
Snowfall over an area is more uniform than
rainfall.
Snow accumulation is largely a function of
elevation, slope, exposure, and vegetative cover.
46. 46
The total snow cover of the earth is 72 million
sq.km, sea ice is 26 million sq.km., ground ice is 32
million sq.km., glaciers and ice-sheets cover about
16 million sq.km., and icebergs is about 63 million
sq.km.
The atmospheric ice alone covers an area of 510
million sq.km.
The residence time glaciers may be for 1000’s of
(or) even millions of years.
The melting of ice from glaciers will have a major
role to play in rising the water level of oceans.
47. 47
If the existing glaciers melt completely, the oceans
would increase to about 2% and the sea level
would rise about 100m.The following table shows the
distribution of water as glaciers and ice across the globe.
Location Volume (103
km3)
% of total volume
in
hydrosphere
% of
freshwater
Glaciers and
permanent
snow cover
24,064 1.74 68.7
Antarctica 21,600 1.56 61.7
Greenland 2,340 0.17 6.68
Arctic Islands 83.5 0.006 0.24
Mountainous regions 40.6 0.003 0.12
Ground
ice(permafrost)
300 0.022 0.86
48. 48
Water in Lakes
Lakes constitute about 0.017% of the world’s
water resources.
More than half of this is held in fresh water lakes,
and the rest is in saline lakes. Almost 75% of the
total volume of freshwater lakes are found in
North America, USSR and East Africa.
Lakes occupy about 1.8 % of the earth’s surface.
Almost 304 million standing water bodies are
existing in the world.
49. 49
Small lakes are more in number. About 60% of the
world’s lakes are in Canada.
Finland is known as the land of 100 thousand
lakes.
The Caspian Sea is one of the largest saline lakes in
the world.
It has a water residence time of 200 years. For
freshwater lakes, the residence time is as low as 90
years.
Lakes provide an important source of water for
irrigation and domestic water supply.
50. 50
Local climate is also controlled by lakes.
Water as Soil Moisture
The soil matrix and the geologic materials (i.e.,
rock, and sediments) have some amount of empty
space in them.
This empty space is called as the pore space.
The percentage of pore space by volume in a rock
or sediment is called as the porosity.
Within all naturally-occurring geologic units, the
pore space always contains some amount of
moisture.
51. 51
If it is seen in soils, it is called as soil moisture.
The soil moisture is the term applied to the water
held in the soil by means of molecular attraction.
Water forms a thin film around the soil particles
and fill up the small pore spaces of the soil
particles.
Soil moisture accounts for about 0.005% of the
world’s water masses.
This is the major source for all vegetation to
survive.
The average residence time of water in the soils is
about 1 month.
52. 52
The amount of moisture present in soils differ with
reference to the physic-chemical properties of
soils, the climatological factors of the area and
geomorphic conditions.
It is also varying over crop lands and agricultural
regions.
Groundwater as a Source
Groundwater is one of the important reservoirs of
water on earth. It is the water stored in the pore
spaces of subsurface geological formations.
53. 53
The subsurface/vertical distribution of
groundwater is divided into two zones as, zones of
aeration and saturation.
The zone of aeration consists of interstitial
openings that are occupied partially by water and
partially by air.
In the zone of saturation, all the interstitial spaces
are filled with water, under hydrostatic pressure.
It is also a fact that on most parts of the land
masses of the earth, a single zone of aeration
overlies a single zone of saturation and extends
upward to the ground surface.
54. 54
The depth of the aquifer also goes into several
hundred meters below the surface.
The occurrence, distribution and movement of
groundwater depends on the hydrological
properties of the geological formations.
The hydraulic properties of soils and rocks depend
on the sizes and shapes of the void spaces.
These may vary over very short distances.
The water bearing geological formations are called
as aquifers.
55. 55
Groundwater gets replenished through natural
recharge from rainfall.
This system supplies water for a major portion of
population all over the world. This resource gets
depleted due to over exploitation. Springs are
seepages coming out of the where groundwater
touches the surface.
Groundwater has its own residence time.
The residence time of groundwater depends on
several factors including seasonal inputs from
rainfall and output as base flow.
56. 56
The base flow consists of water that infiltrates into
the ground during and after a rain storm.
It also relates to the sustaining stream flow during
dry periods and between storm flows.
The source of base flow is the groundwater that
flows through unsaturated and saturated soils and
cracks or layers in bedrock or other impermeable
layers adjacent to the stream.
57. 57
Water in Living Organisms
Water and life go hand-in-hand.
The total amount of water stored in the living
organisms is extremely small, when compared
with the other reservoirs.
Plants play a dominant role in utilizing the water
and release it back to the atmosphere. Life is tied
up with water, air and food, while food is tied to
water.
58. 58
Though water is a regional resource, its shortage is
becoming a global issue due to increasing
population, economic growth and climate change.
The residence time of water is also very short.
It ranges from a few hours in warm blooded
animals to a season for most plants.
59. 59
Water Balance Equation
The water balance equation provides a
quantitative means of evaluating the hydrologic
cycle and the world’s water masses.
The equation considers the inflow, outflow and
changes in storage as
Inflow = Outflow changes in storage.
This equation can be expanded as
P E T Ro = S.
Where,P = Precipitation;E = Evaporation
T = Transpiration;Ro = Runoff
60. 60
S – Changes in Storage
This equation balances the water availability for a
specific time period.
Human pressure on water resources
According to the assessment made by the United
Nations on world’s water resources, the available
water resources, globally, are found to be
continuously declining as a result of excessive
withdrawal of both surface- and groundwater.
61. 61
It has also contributed for the decreased water
run-off due to reduced precipitation and increased
evaporation.
This comes due to global warming.
Already, in many parts of the world, such as West
Asia, the Indo-Gangetic Plain in India, the North
China Plain and the High Plains in North America,
human water use exceeds the annual average
water replenishment.
Use of freshwater for agriculture, industry and
energy has increased markedly over the last 50
years.
62. 62
More seriously over 2.8 billion people in 48
countries will face water stress by 2025, based on
United Nations medium population projections.
There are more than 45 000 large dams in 140
countries.
About two-thirds of these dams are in the
developing world, with half present in China.
These dams, with an estimated potential storage
volume of 8 400 km3, impound about 14 per cent
of global run-off as estimated by Vörösmarty and
others in 1997.
63. 63
The new dam construction is limited largely to the
developing regions, particularly Asia.
Shortage of water
It has been found that there are five major drivers
demanding a huge expansion of water resources in
the 20th century.
They are population growth, industrial
development, expansion of irrigated agriculture,
massive urbanisation and rising standards of
living.
64. 64
Almost 20% of the world’s population or more
than 1 billion people lack access to safe drinking
water.
Water is a carrier of disease vectors contaminated
water can cause a host of water-borne diseases.
About 80% of all illnesses and more than one third
of all deaths in developing countries are related to
water.
65. 65
Almost 1.1 billion people have no clean water.
Their distribution is as follows:
1) 406 million people in East Asia and the
Pacific
2) 229 million people in South Asia
3) 314 million people in sub-Saharan Africa
4) 38 million people in the Middle East
5) 49 million people in Latin America and the
Caribbean
66. 66
Today, some of the world’s biggest cities, including
Beijing, Buenos Aires, Dhaka, Lima and Mexico
City, depend heavily on groundwater for their
water supply.
The current overuse is not sustainable, because it
takes many years to fill aquifers. It is also a fact
that most of the world’s megacities are located
along the coastlines.
In these regions, the aquifer depletion leads to
saltwater intrusion and the contamination of
freshwater resources.
67. 67
Quality of water
In addition to quantity of water, the quality of
water available on the earth is also a very
significant aspect to be understood.
The physic-chemical and biological properties of
water determines the quality of water for its
suitability for drinking, domestic, industrial and
irrigational purposes.
68. 68
The quality of water deteriorates due to
contamination (or) pollution and due to various
mixing process.
Water quality is affected by chemical,
microbiological and thermal pollution.
The chemical contamination comes due to excess
nutrients, acidification, salinity, heavy metals and
other trace elements, persistent organic pollutants
and changes in sediment loads.
69. 69
The microbiological contaminants, bacteria,
viruses and protozoa in water pose one of the
leading global human health hazards.
The altering natural water temperature cycles can
also impair the biological functions that can affect
the metabolic rates in aquatic organisms, leading
to long-term population declines.
Water pollution is a new problem approaching
crisis levels in many parts of the world.
70. 70
Polluted water is a major cause of death and
disease in the developing world.
A water becomes unsuitable, if contaminated with
toxic substances.
It is a fact that half of the world’s rivers and lakes
are seriously polluted.
Importance of World’s Water
If the water from land frontiers did not return back
to the seas and oceans from precipitation and
runoff, then the sea level world drop to about 1m
per year.
71. 71
The salinity would also raise and rate of
evaporation gets reduced.
In such cases all the oceans would be completely
dry within 4000 years.
It will take 30000 years to till these oceans again
through runoff.
Water is the Earth’s primary integrating medium.
It has a wide potential to reduce poverty, increase
food security, improve human health, contribute to
sustainable energy sources, and strengthen the
ecosystems’ integrity and sustainability.
72. 72
These water-related goods and- services represent
a very significant and amount of opportunities for
sustainable development.
This has also been recognized in the Millennium
Declaration and at the recent World Summit on
Sustainable Development.
Water use is uneven across countries. The 10
largest water users, in the world (in volume), are
India, China, the United States, Pakistan, Japan,
Thailand, Indonesia, Bangladesh, Mexico and the
Russian Federation.
Agriculture is by far the main user of water.
73. 73
Irrigated agriculture accounts for 70% of water
withdrawals, which can rise to more than 90% in
some regions.
Conclusion
Water is the source of life and development on our
planet.
Reliable assessment of the earth's water is very
difficult due to the dynamic nature and hydrologic
variability of water in time and space.
Water conservation technologies, for example, are
slowly becoming more prevalent and can help
reduce water use.
74. 74
The world is not “running out of water,” but it is
not always available when and where people need
it.
Climate, normal seasonal variations, droughts and
floods can all contribute to local extreme
conditions.
Water is not in short supply over the earth. It is a
duty to conserve the available water resources of
the world.
The hydrosphere is an important environmental
segment of the Earth. It is an essential segment for
all life to survive.