The smith chart
•
1 like•884 views

The document describes how the Smith Chart maps impedances on the normalized complex impedance plane to the complex Γ plane. Vertical lines on the impedance plane representing constant resistance values r map to circles on the Γ plane, with centers located along the Γi = 0 line. Horizontal lines representing constant reactance values x also map to circles, with centers located along the Γr = 1 line. By mapping many such lines, the rectilinear grid of the impedance plane is distorted into the curvilinear grid of circles that make up the Smith Chart.

More Related Content
What's hot
What's hot (20)
Viewers also liked
Similar to The smith chart
Similar to The smith chart (20)
Recently uploaded
Recently uploaded (19)
The smith chart
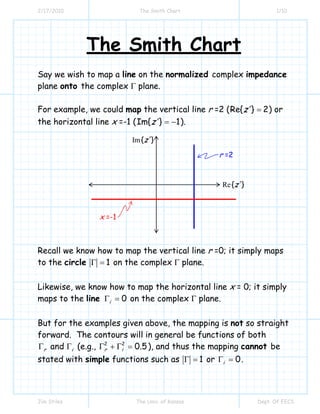
- 1. 2/17/2010 The Smith Chart 1/10 The Smith Chart Say we wish to map a line on the normalized complex impedance plane onto the complex Γ plane. For example, we could map the vertical line r =2 ( Re{z ′} = 2 ) or the horizontal line x =-1 ( Im{z ′} = −1 ). Im {z ′} r =2 Re {z ′} x =-1 Recall we know how to map the vertical line r =0; it simply maps to the circle Γ = 1 on the complex Γ plane. Likewise, we know how to map the horizontal line x = 0; it simply maps to the line Γi = 0 on the complex Γ plane. But for the examples given above, the mapping is not so straight forward. The contours will in general be functions of both Γr and Γi (e.g., Γ2 + Γi2 = 0.5 ), and thus the mapping cannot be r stated with simple functions such as Γ = 1 or Γi = 0 . Jim Stiles The Univ. of Kansas Dept. Of EECS
- 2. 2/17/2010 The Smith Chart 2/10 As a matter of fact, a vertical line on the normalized impedance plane of the form: r = cr , where cr is some constant (e.g. r = 2 or r = 0.5 ), is mapped onto the complex Γ plane as: 2 2 ⎛ ⎛ 1 ⎞ c ⎞ Γr − r ⎟ + Γi2 = ⎜ ⎜ ⎟ 1 + cr ⎠ ⎝ ⎝ 1 + cr ⎠ Note this equation is of the same form as that of a circle: 2 2 ( x − x c ) + ( y − yc ) = a 2 where: a = the radius of the circle Pc ( x = xc , y = yc ) ⇒ point located at the center of the circle Thus, the vertical line r = cr maps into a circle on the complex Γ plane! By inspection, it is apparent that the center of this circle is located at this point on the complex Γ plane: ⎛ Pc ⎜ Γr = ⎝ Jim Stiles ⎞ cr , Γi = 0 ⎟ 1 + cr ⎠ The Univ. of Kansas Dept. Of EECS
- 3. 2/17/2010 The Smith Chart 3/10 In other words, the center of this circle always lies somewhere along the Γi = 0 line. Likewise, by inspection, we find the radius of this circle is: a= 1 1 + cr We perform a few of these mappings and see where these circles lie on the complex Γ plane: Γi r = −0.3 Γ =1 r = 0. 0 r = 1. 0 r = 0. 3 Γr r = 3.0 r = − 5. 0 Jim Stiles The Univ. of Kansas Dept. Of EECS
- 4. 2/17/2010 The Smith Chart 4/10 We see that as the constant cr increases, the radius of the circle decreases, and its center moves to the right. Note: 1. If cr > 0 then the circle lies entirely within the circle Γ = 1. 2. If cr < 0 then the circle lies entirely outside the circle Γ = 1. 3. If cr = 0 (i.e., a reactive impedance), the circle lies on circle Γ = 1 . 4. If cr = ∞ , then the radius of the circle is zero, and its center is at the point Γr = 1, Γi = 0 (i.e., Γ = 1 e j 0 ). In other words, the entire vertical line r = ∞ on the normalized impedance plane is mapped onto just a single point on the complex Γ plane! But of course, this makes sense! If r = ∞ , the impedance is infinite (an open circuit), regardless of what the value of the reactive component x is. Now, let’s turn our attention to the mapping of horizontal lines in the normalized impedance plane, i.e., lines of the form: x = ci Jim Stiles The Univ. of Kansas Dept. Of EECS
- 5. 2/17/2010 The Smith Chart 5/10 where ci is some constant (e.g. x = −2 or x = 0.5 ). We can show that this horizontal line in the normalized impedance plane is mapped onto the complex Γ plane as: ( Γr − 1) 2 2 ⎛ 1⎞ 1 + ⎜ Γi − ⎟ = 2 ci ⎠ ci ⎝ Note this equation is also that of a circle! Thus, the horizontal line x = ci maps into a circle on the complex Γ plane! By inspection, we find that the center of this circle lies at the point: ⎛ Pc ⎜ Γr = 1, Γi = ⎝ 1⎞ ⎟ ci ⎠ in other words, the center of this circle always lies somewhere along the vertical Γr = 1 line. Likewise, by inspection, the radius of this circle is: a= Jim Stiles 1 ci The Univ. of Kansas Dept. Of EECS
- 6. 2/17/2010 The Smith Chart 6/10 We perform a few of these mappings and see where these circles lie on the complex Γ plane: Γr = 1 Γi x = 0 .5 x = 1 .0 x = 2 .0 x = 3. 0 Γ =1 Γr x = −3 . 0 x = −0 . 5 x = −1.0 x = −2.0 We see that as the magnitude of constant ci increases, the radius of the circle decreases, and its center moves toward the point ( Γr = 1, Γi = 0 ) . Note: 1. If ci > 0 (i.e., reactance is inductive) then the circle lies entirely in the upper half of the complex Γ plane (i.e., where Γi > 0 )—the upper half-plane is known as the inductive region. Jim Stiles The Univ. of Kansas Dept. Of EECS
- 7. 2/17/2010 The Smith Chart 7/10 2. If ci < 0 (i.e., reactance is capacitive) then the circle lies entirely in the lower half of the complex Γ plane (i.e., where Γi < 0 )—the lower half-plane is known as the capacitive region. 3. If ci = 0 (i.e., a purely resistive impedance), the circle has an infinite radius, such that it lies entirely on the line Γi = 0 . 4. If ci = ±∞ , then the radius of the circle is zero, and its center is at the point Γr = 1, Γi = 0 (i.e., Γ = 1 e j 0 ). In other words, the entire vertical line x = ∞ or x = −∞ on the normalized impedance plane is mapped onto just a single point on the complex Γ plane! But of course, this makes sense! If x = ∞ , the impedance is infinite (an open circuit), regardless of what the value of the resistive component r is. 5. Note also that much of the circle formed by mapping x = ci onto the complex Γ plane lies outside the circle Γ = 1. This makes sense! The portions of the circles laying outside Γ = 1 circle correspond to impedances where the real (resistive) part is negative (i.e., r < 0). Thus, we typically can completely ignore the portions of the circles that lie outside the Γ = 1 circle ! Jim Stiles The Univ. of Kansas Dept. Of EECS
- 8. 2/17/2010 The Smith Chart 8/10 Mapping many lines of the form r = cr and x = ci onto circles on the complex Γ plane results in tool called the Smith Chart. Im{ Γ } Re{ Γ } Jim Stiles The Univ. of Kansas Dept. Of EECS
- 9. 2/17/2010 The Smith Chart 9/10 Note the Smith Chart is simply the vertical lines r = cr and horizontal lines x = ci of the normalized impedance plane, mapped onto the two types of circles on the complex Γ plane. Note for the normalized impedance plane, a vertical line r = cr and a horizontal line x = ci are always perpendicular to each other when they intersect. We say these lines form a rectilinear grid. However, a similar thing is true for the Smith Chart! When a mapped circle r = cr intersects a mapped circle x = ci , the two circles are perpendicular at that intersection point. We say these circles form a curvilinear grid. In fact, the Smith Chart is formed by distorting the rectilinear grid of the normalized impedance plane into the curvilinear grid of the Smith Chart! x I.E.,: x =1 r =0 r r =1 x =0 x = −1 Jim Stiles The Univ. of Kansas Dept. Of EECS
- 10. 2/17/2010 The Smith Chart 10/10 x Distorting this rectilinear grid: r And then distorting some more—we have the curvilinear grid of the Smith Chart! x r Jim Stiles The Univ. of Kansas Dept. Of EECS