Downloaded 107 times


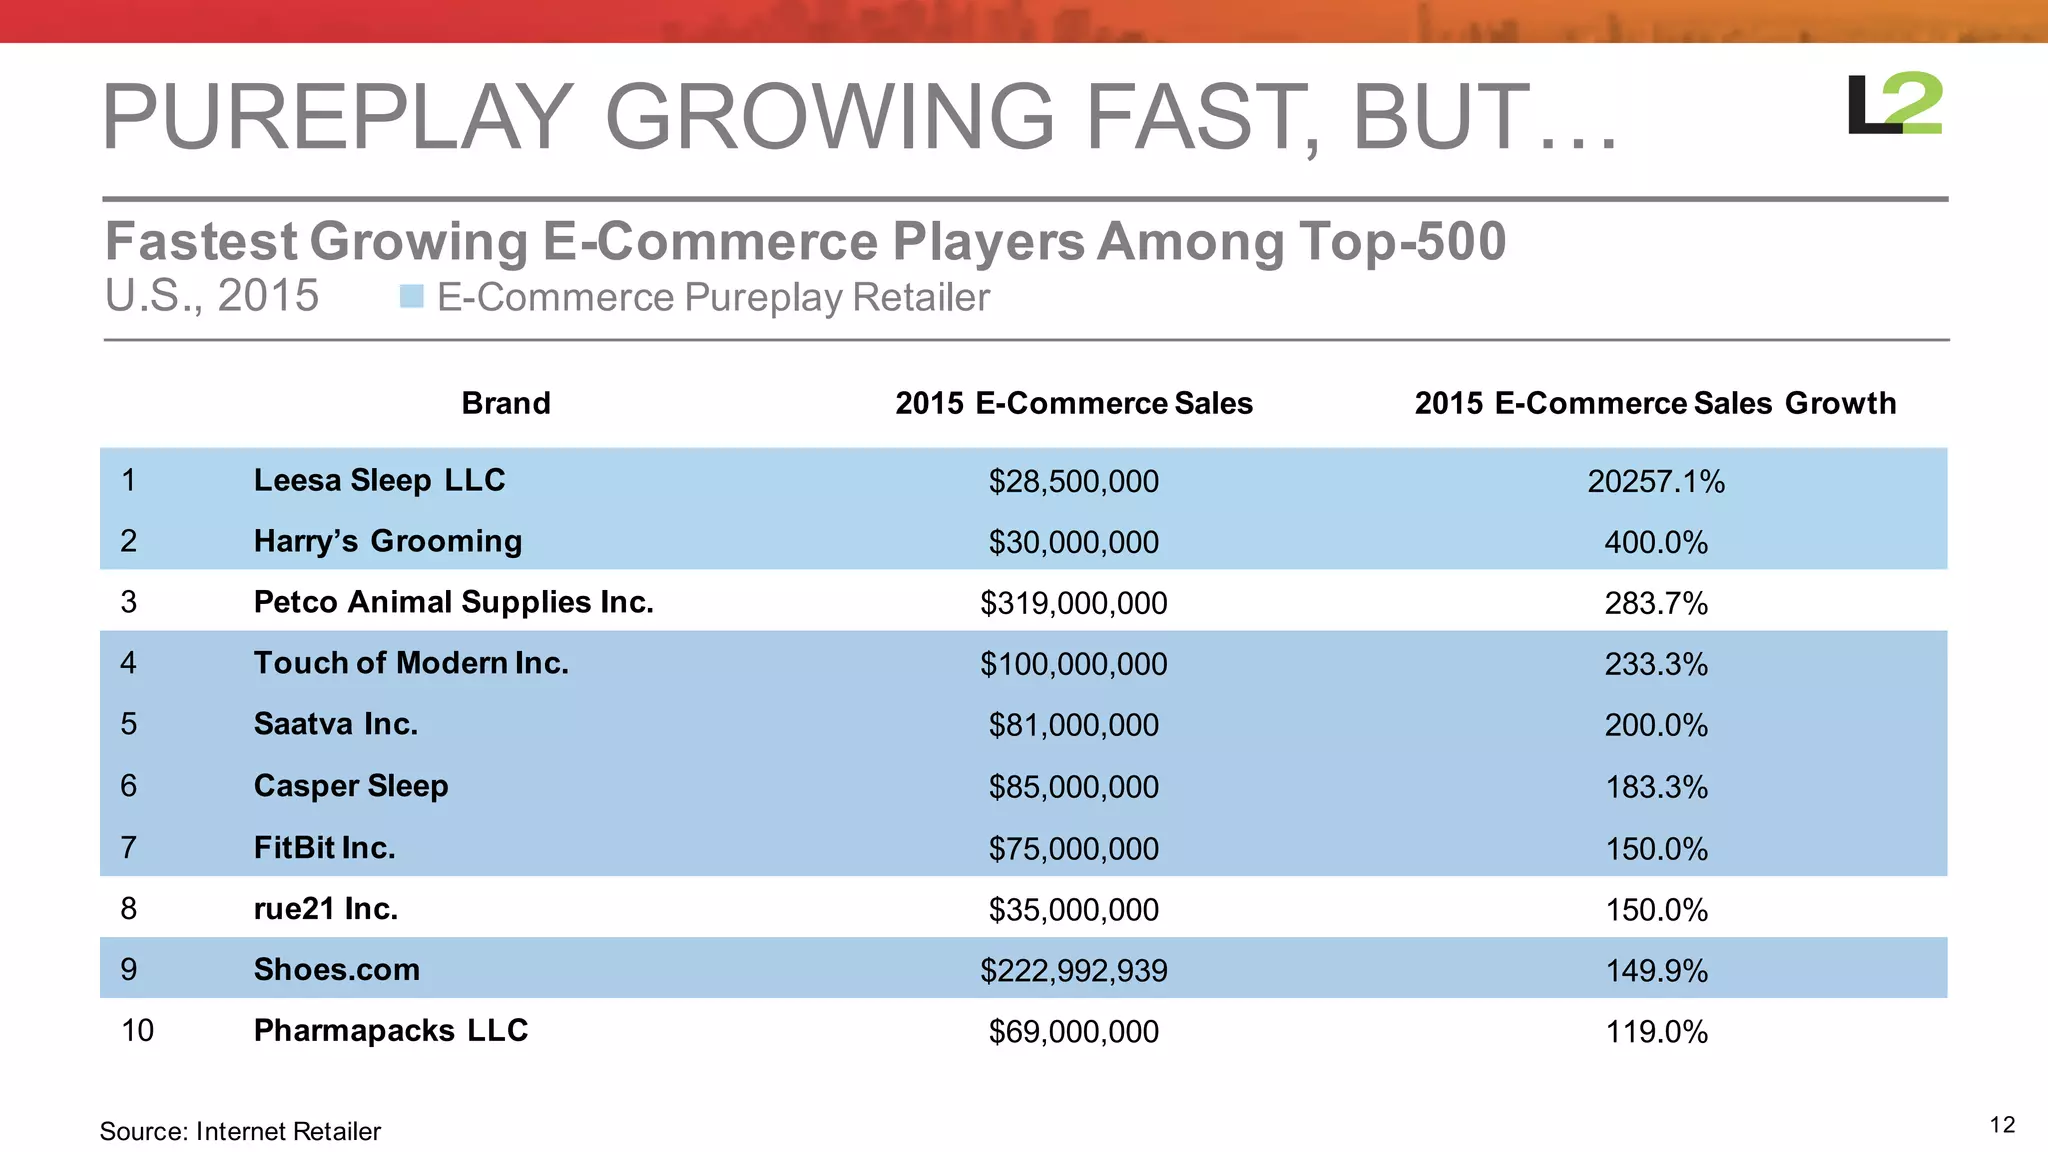


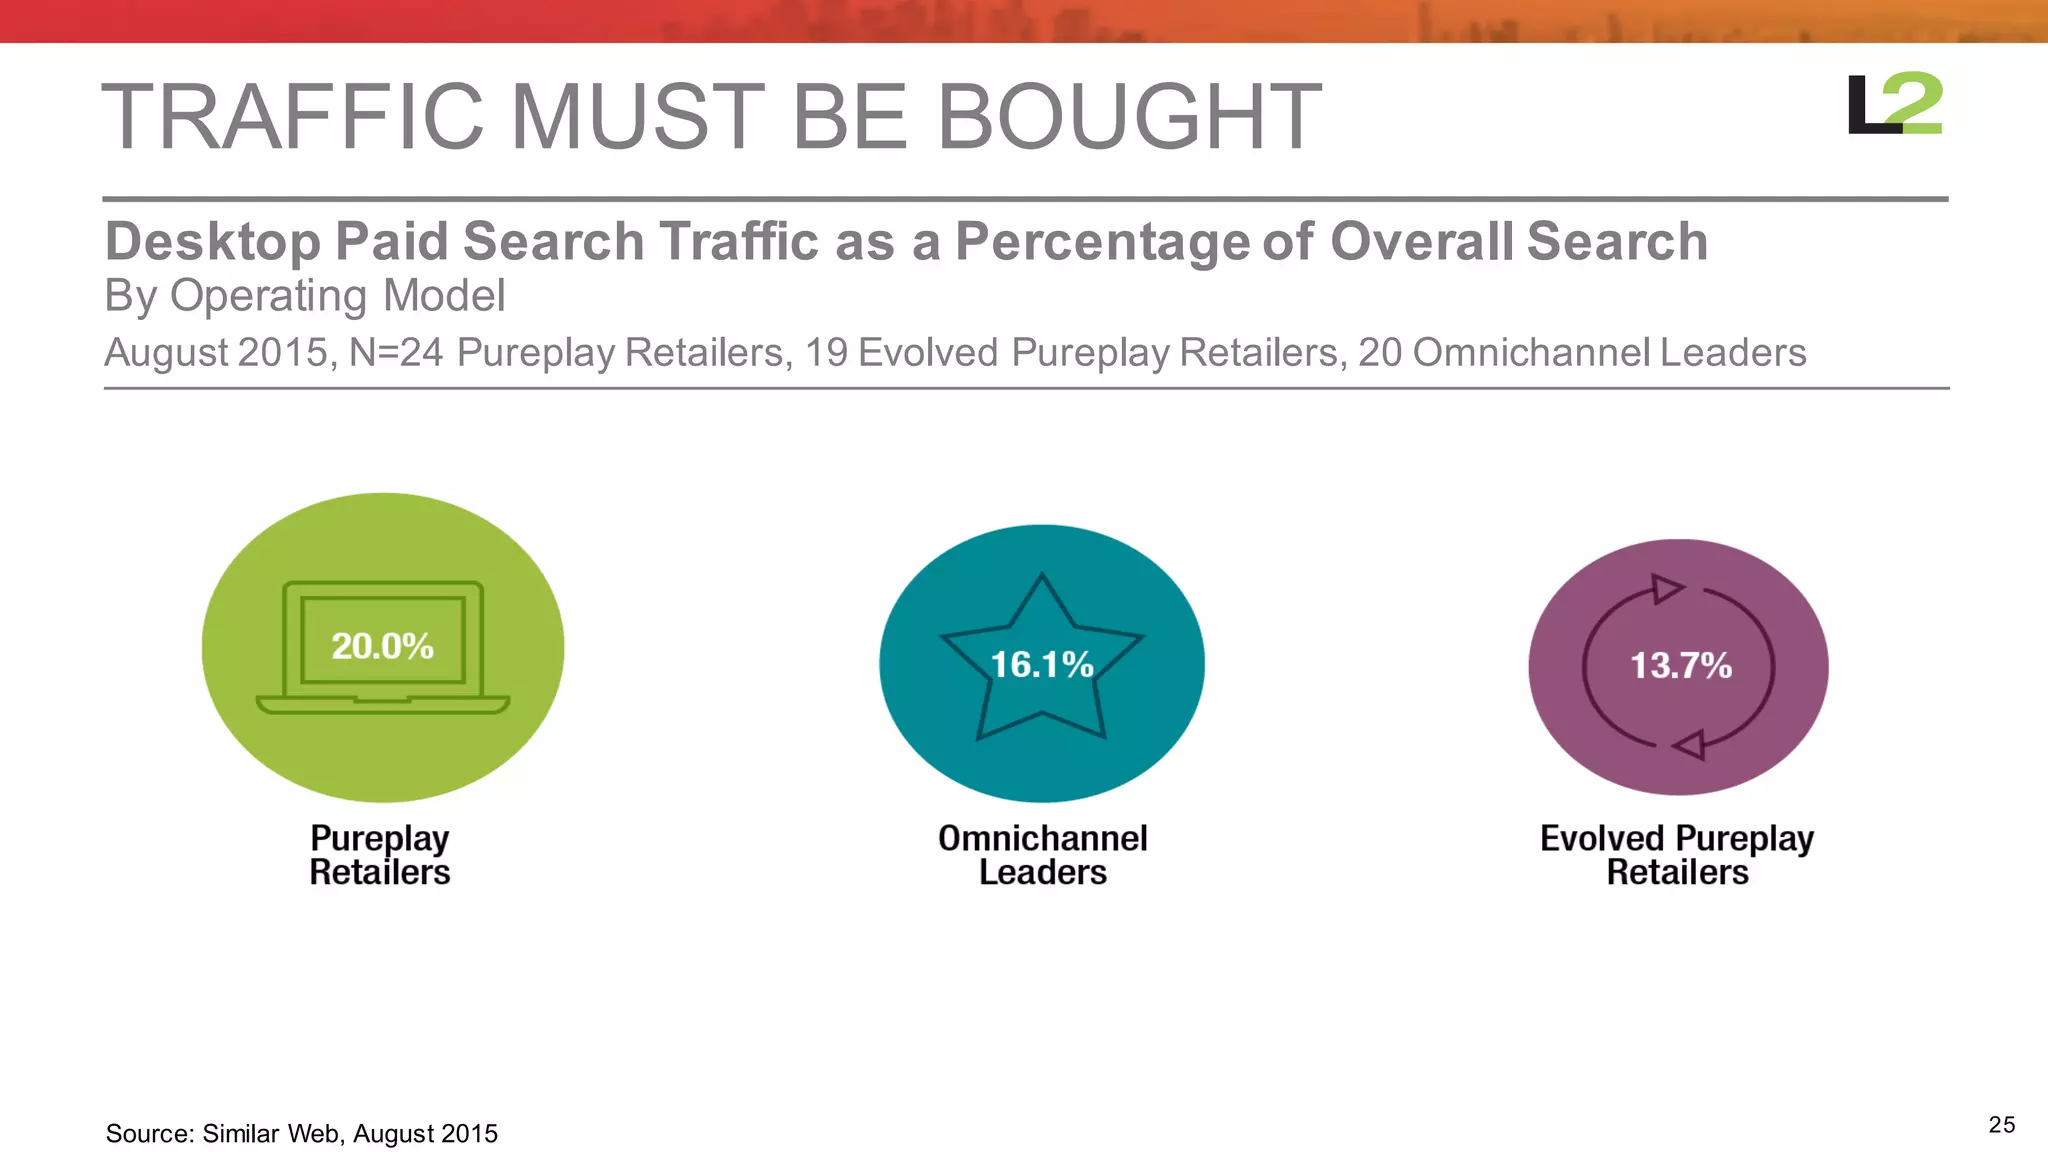

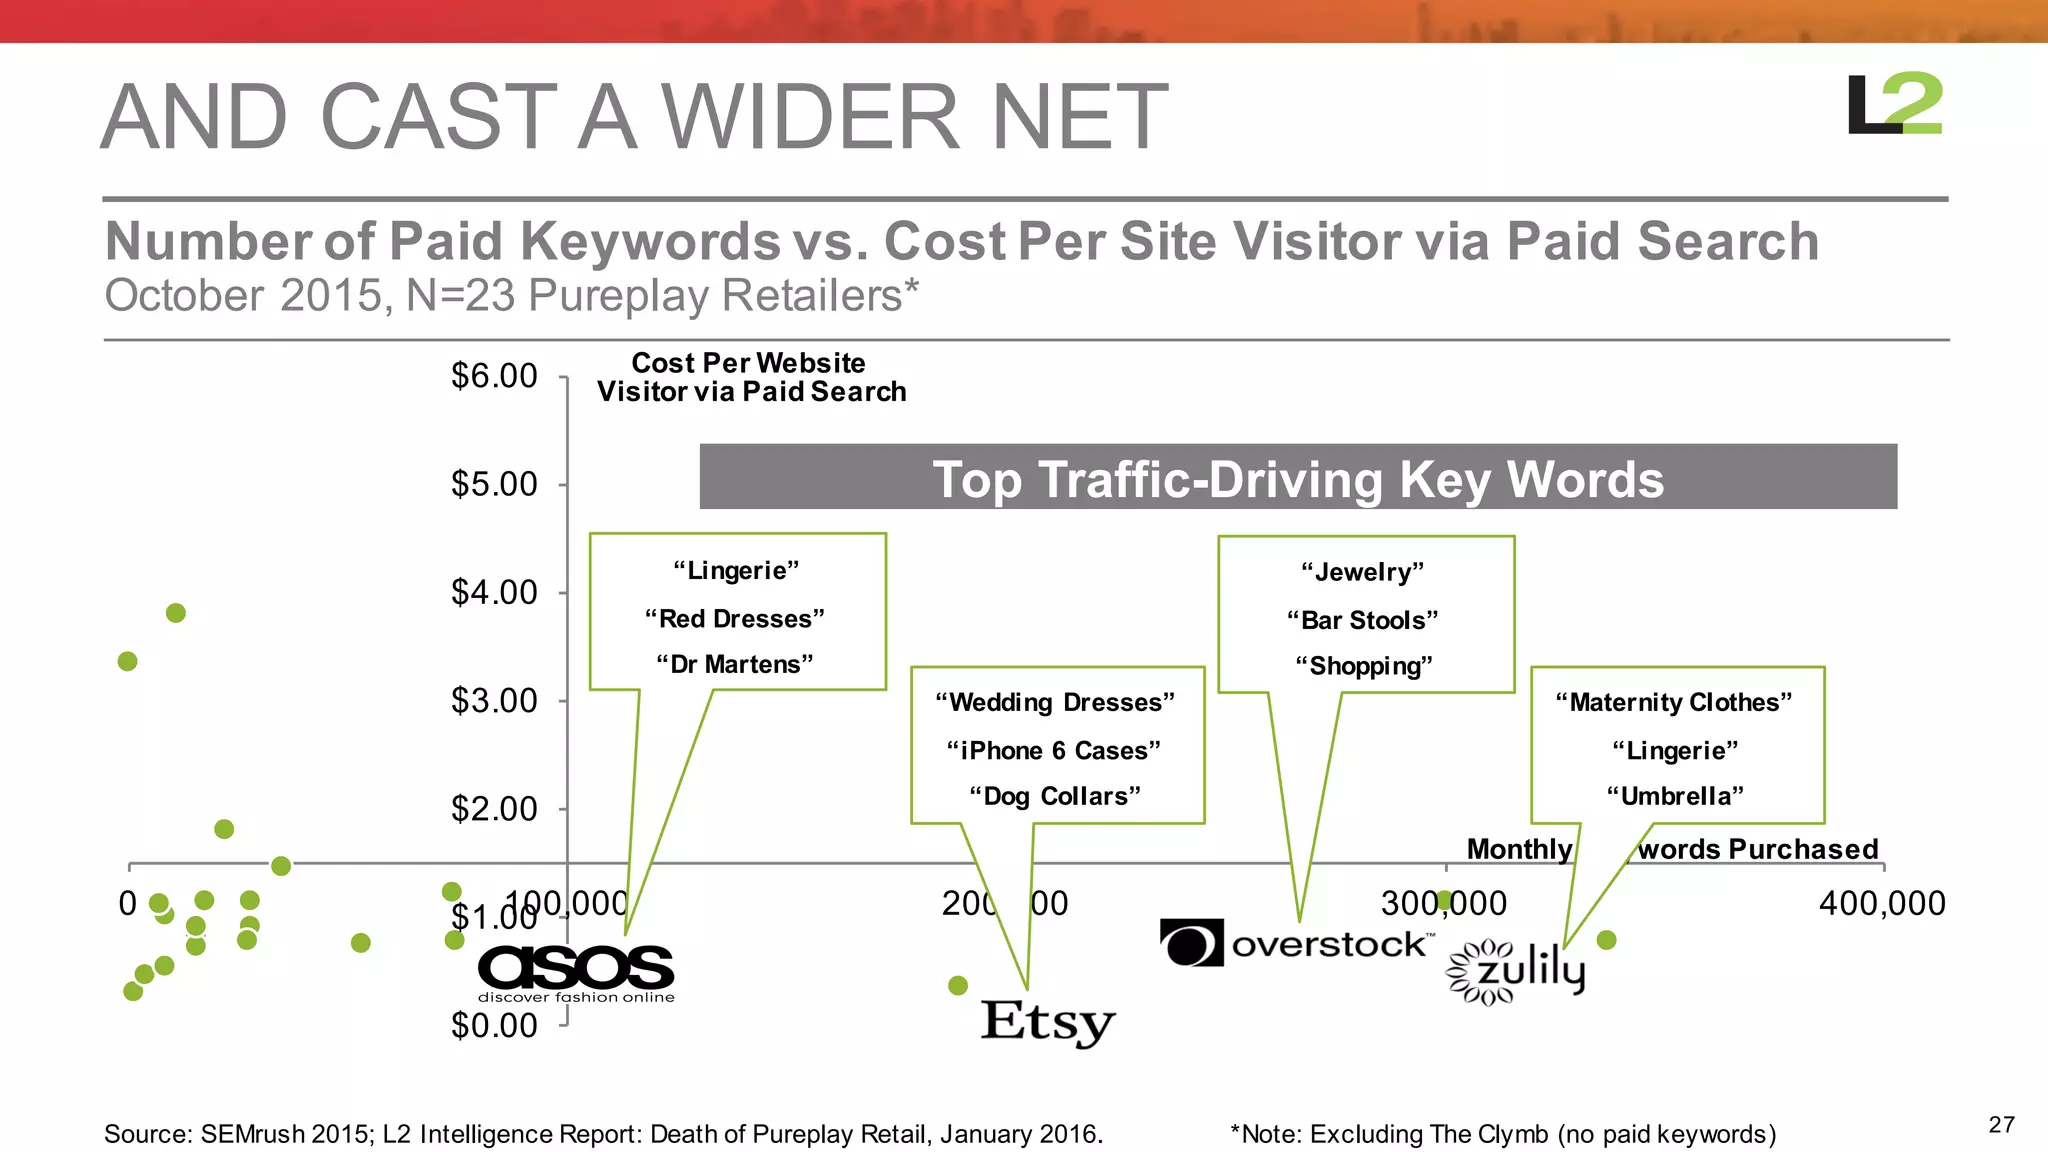
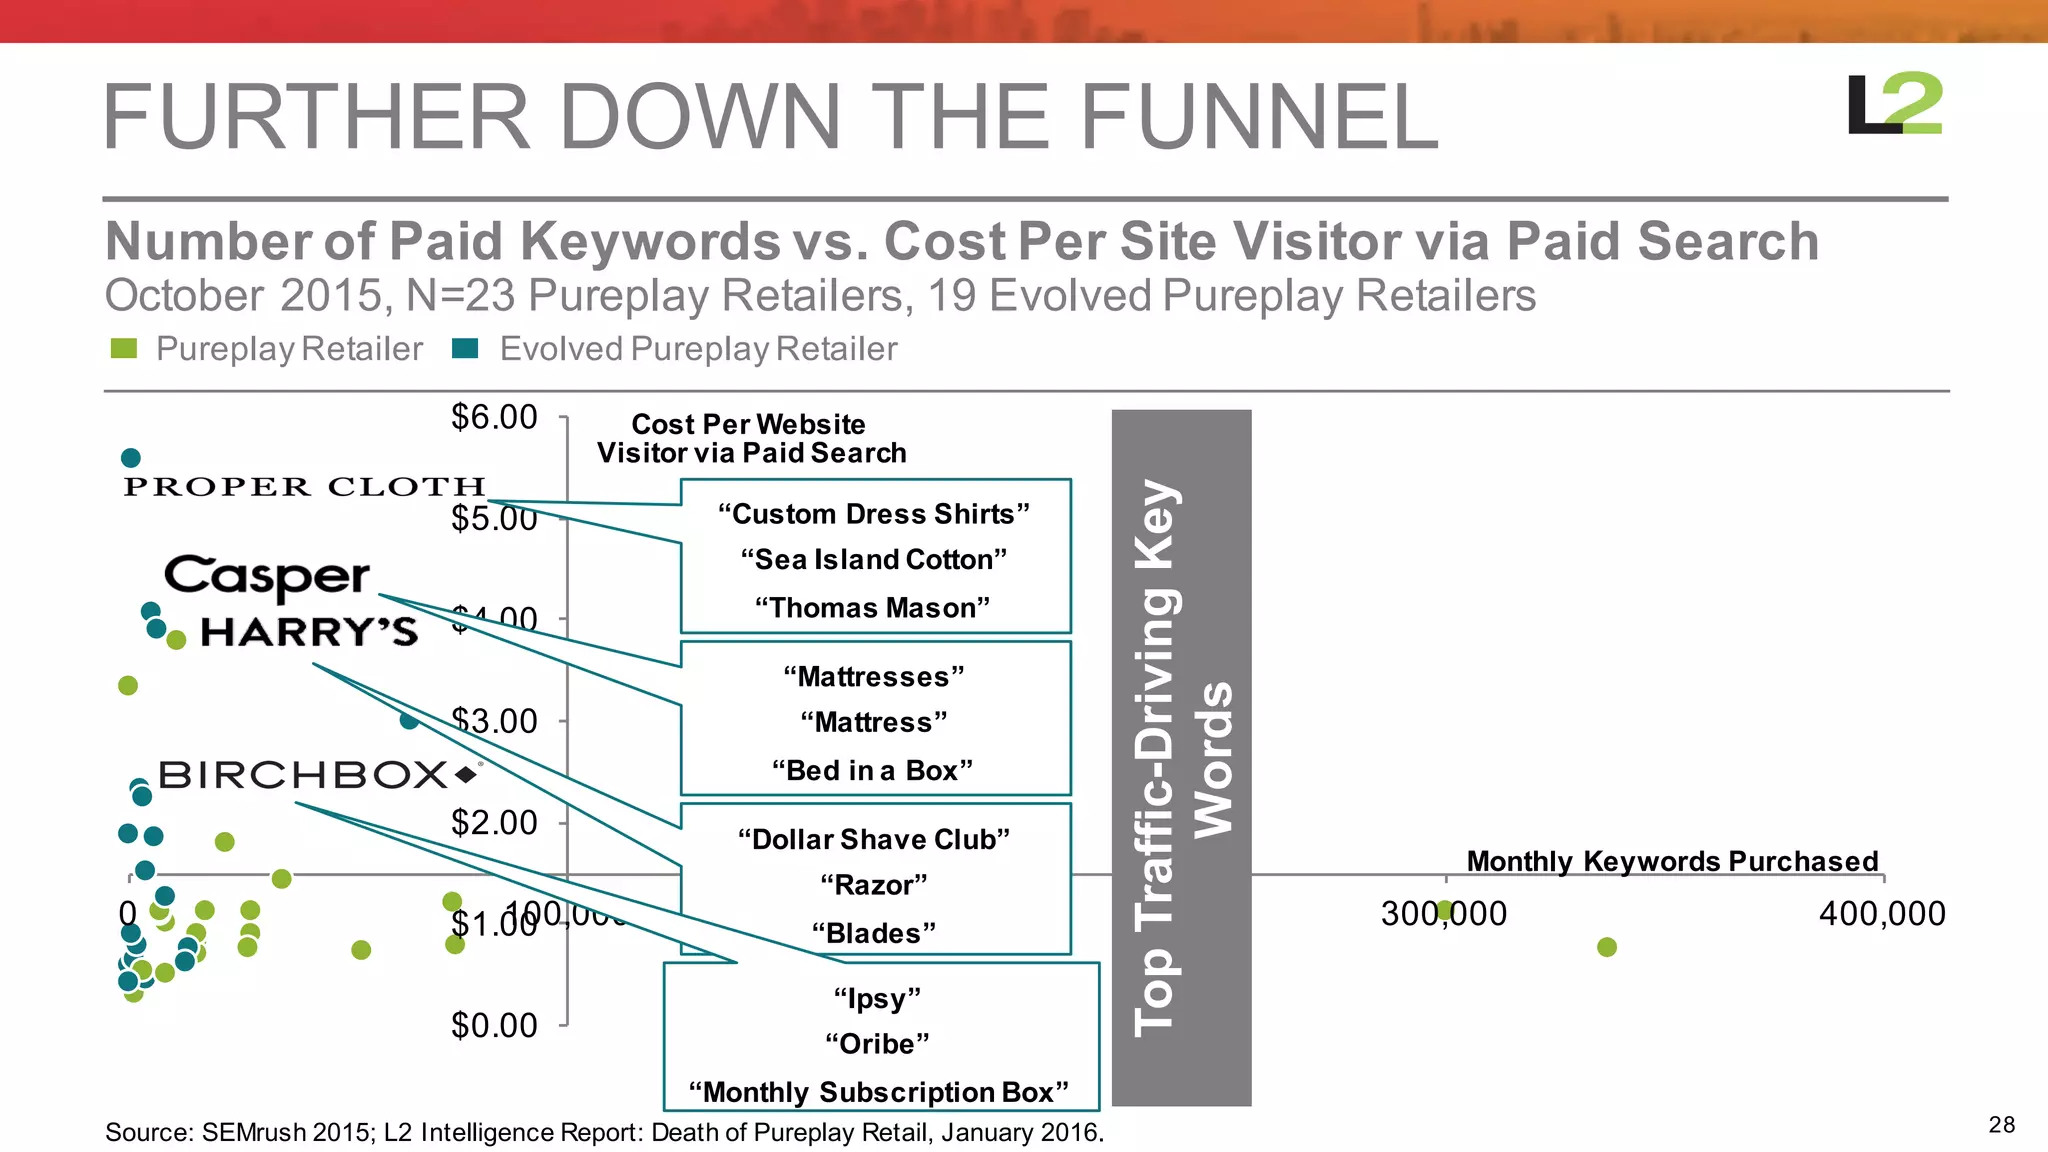


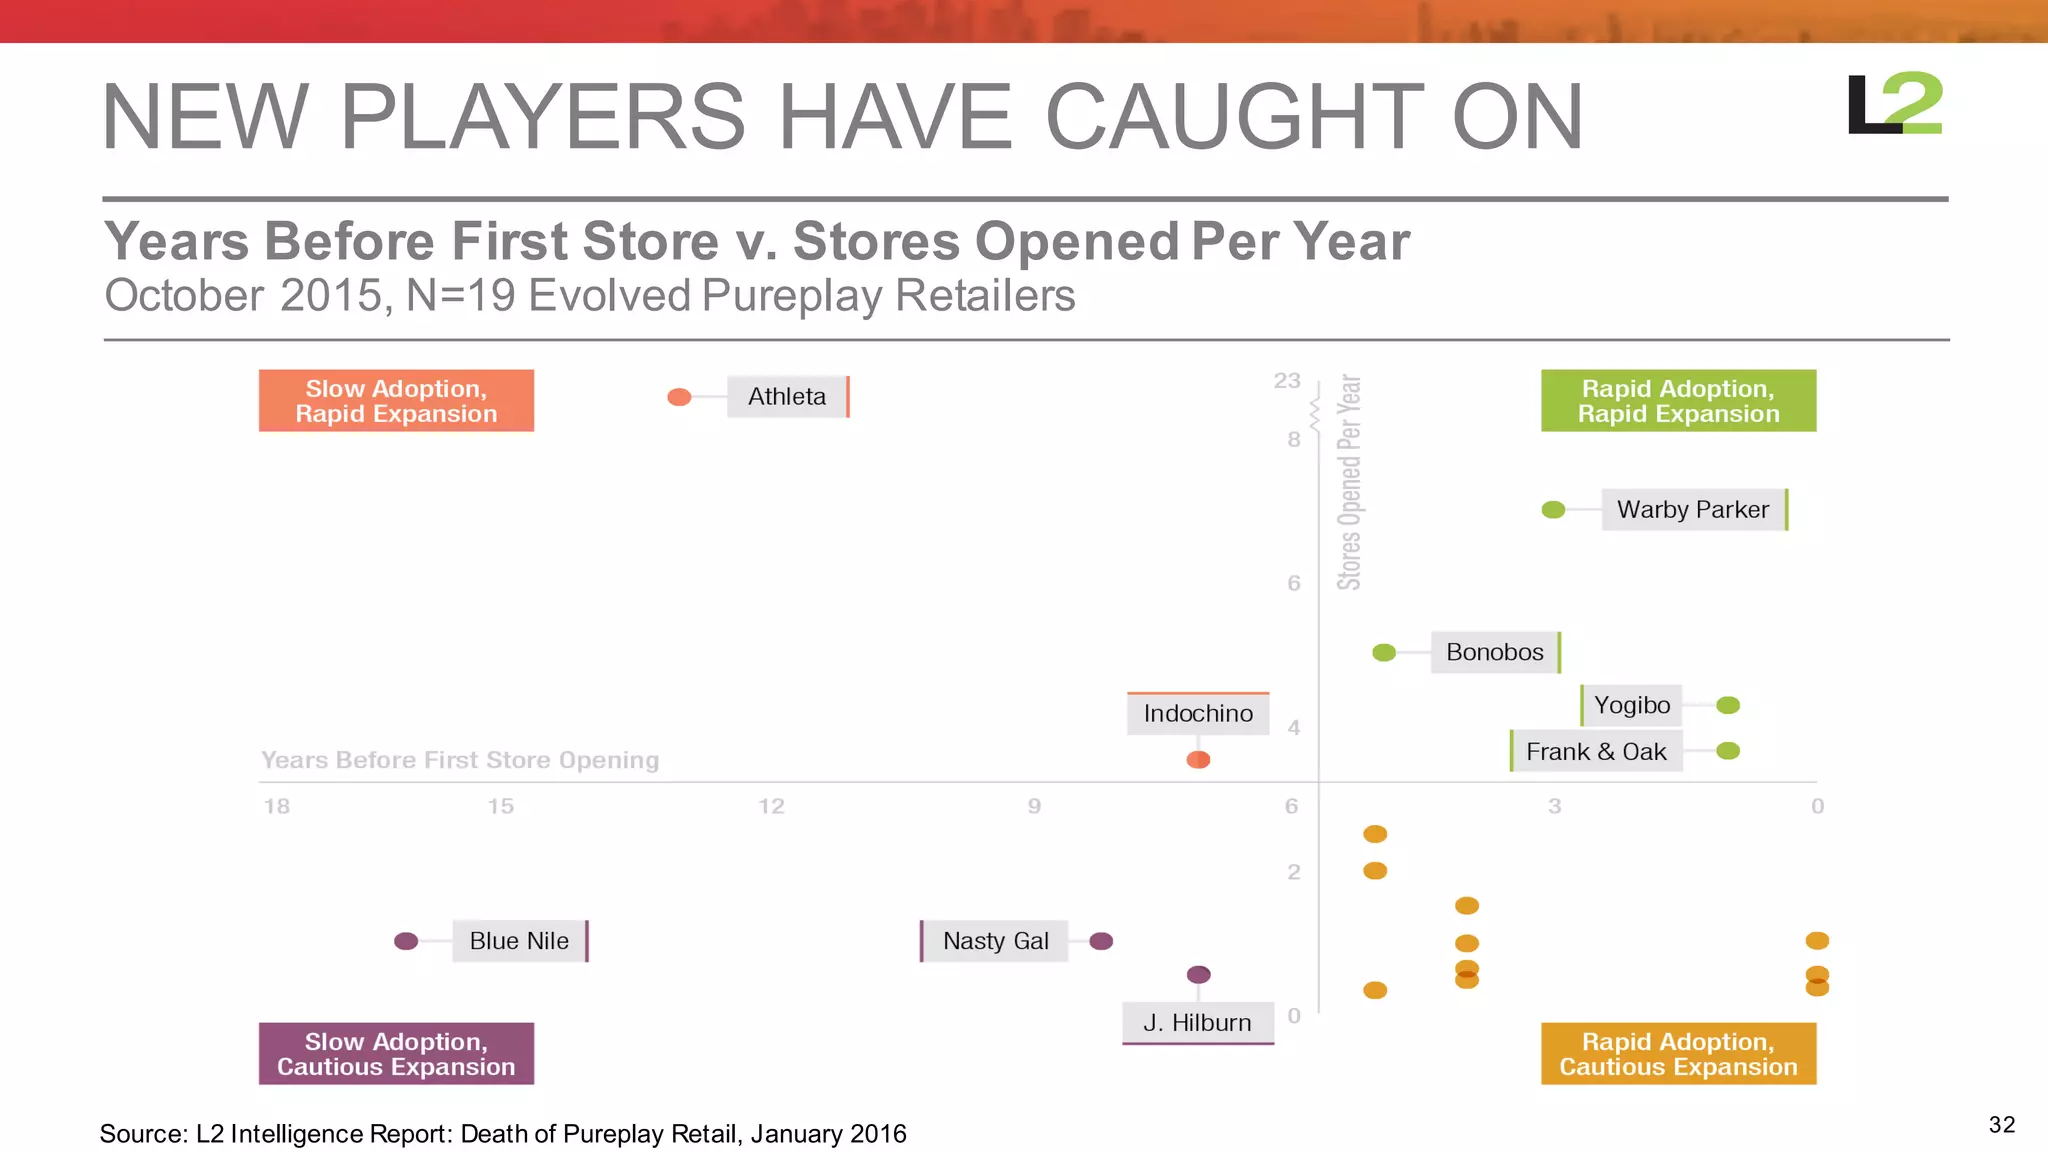

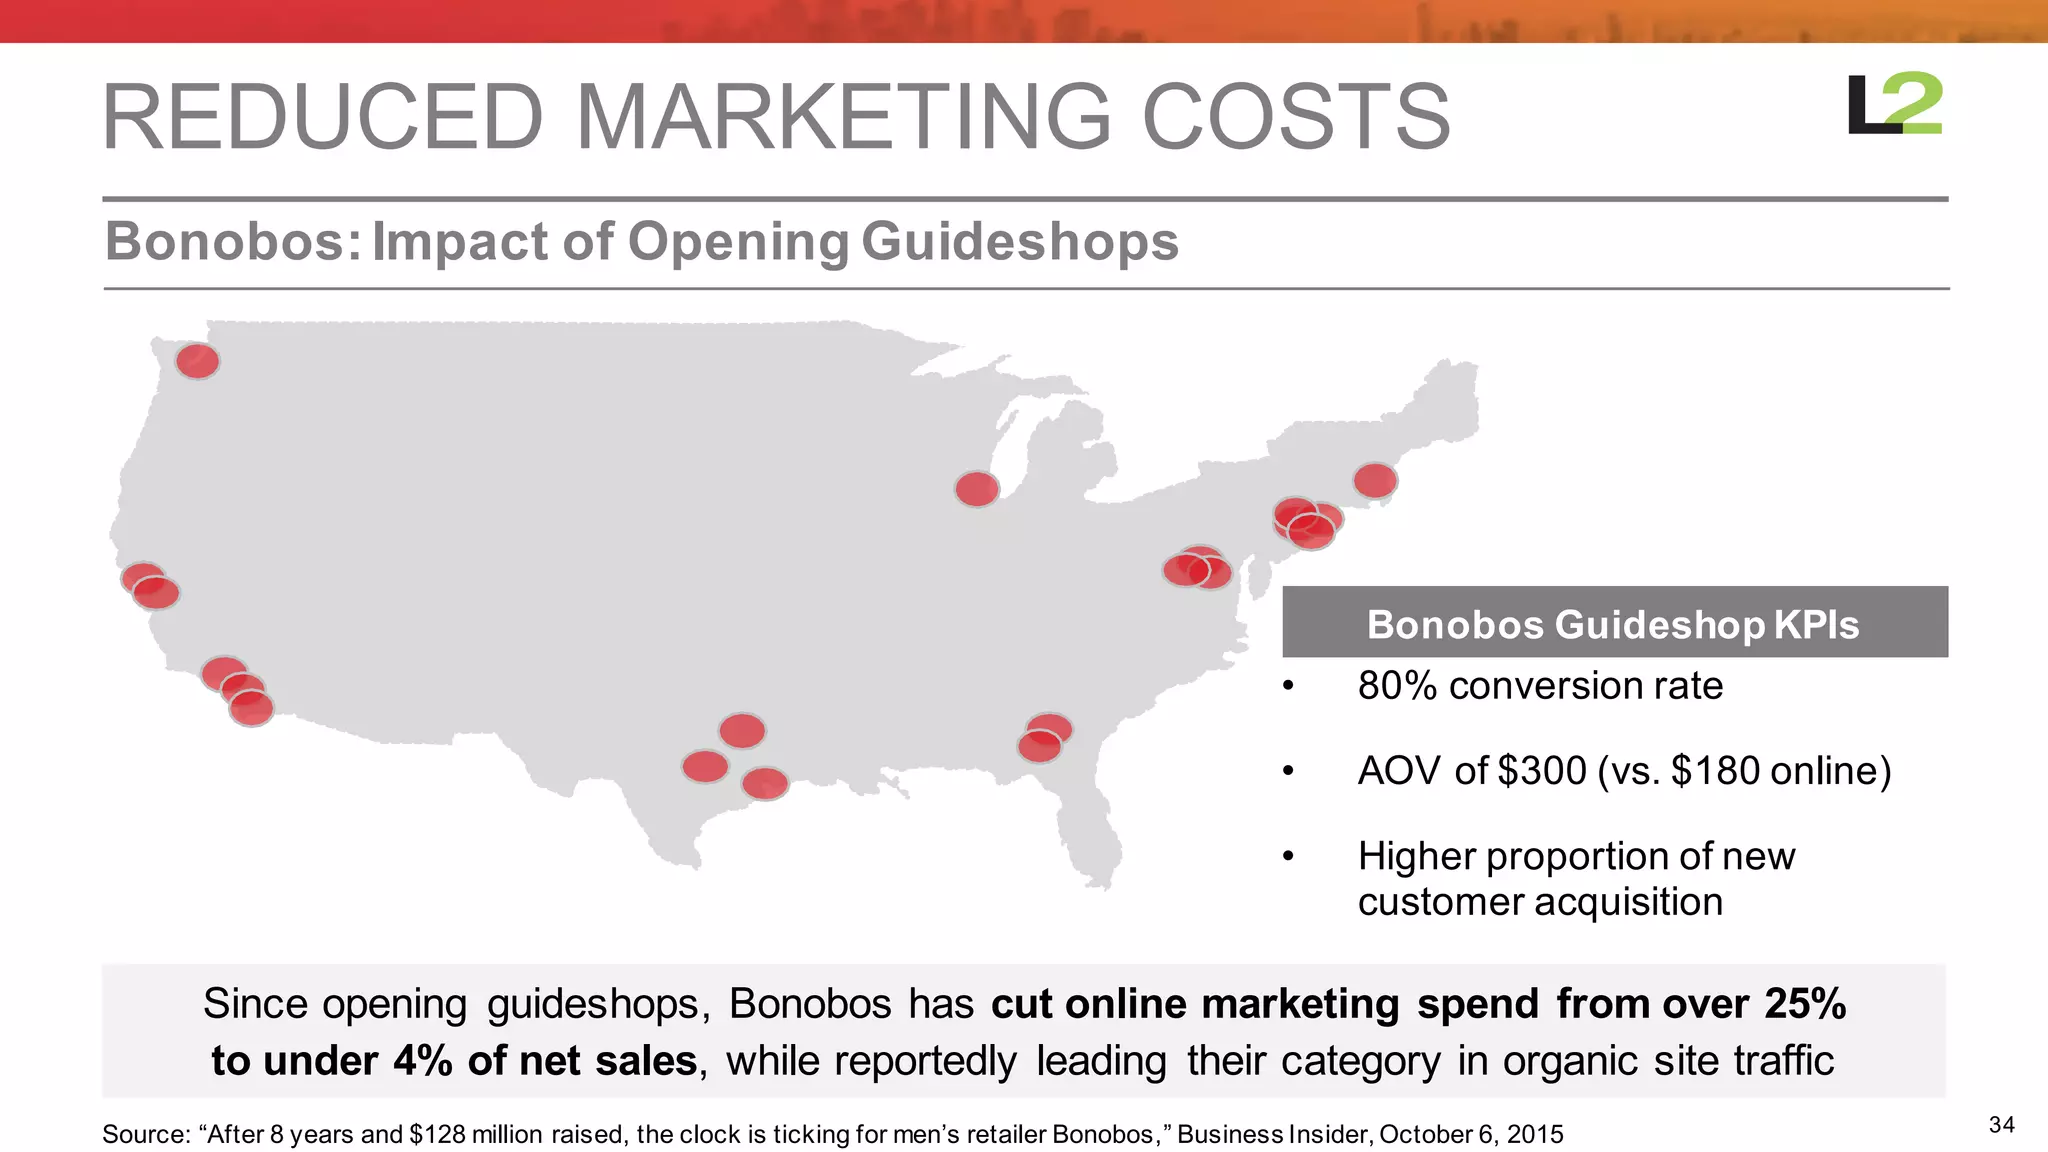
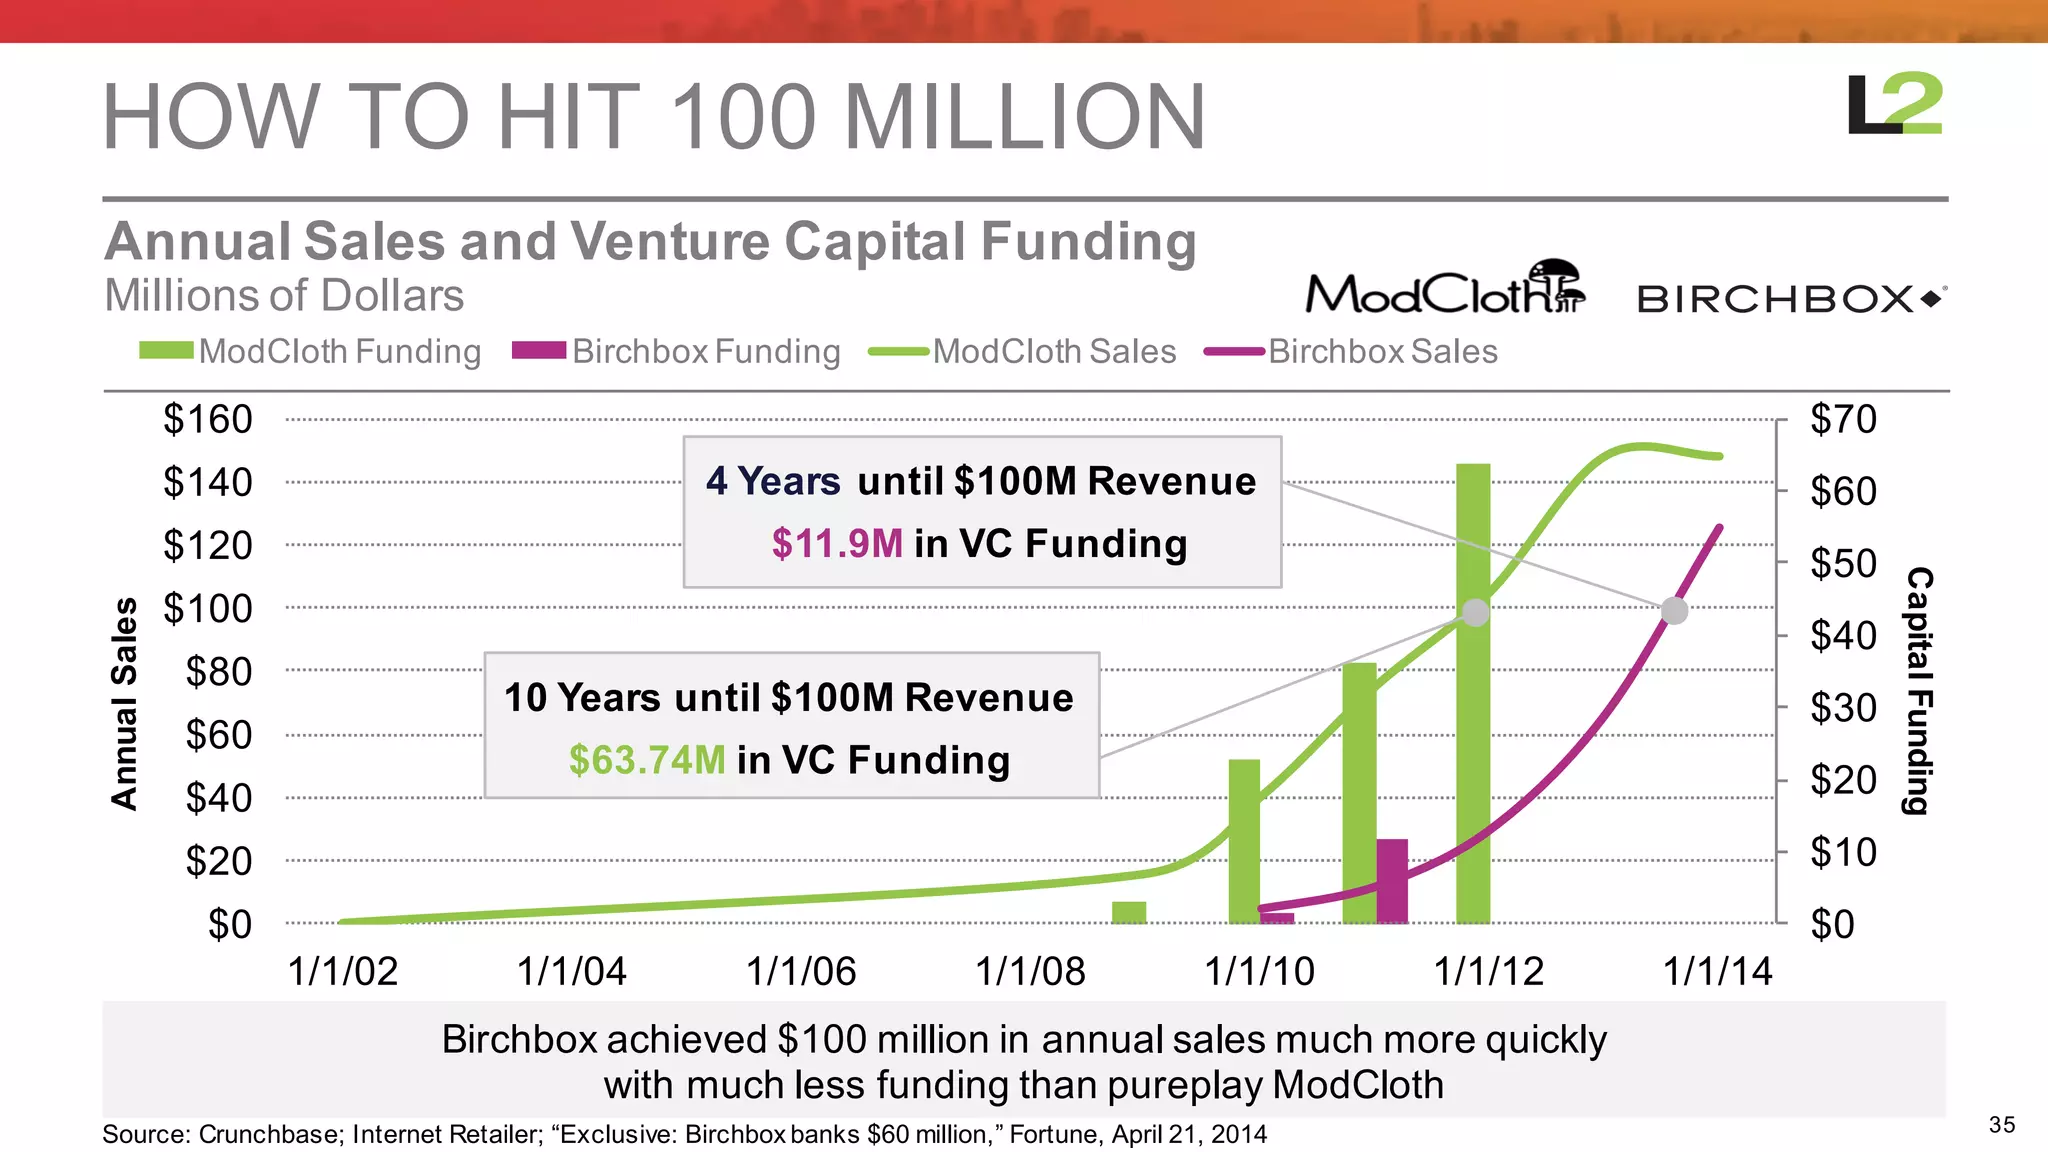


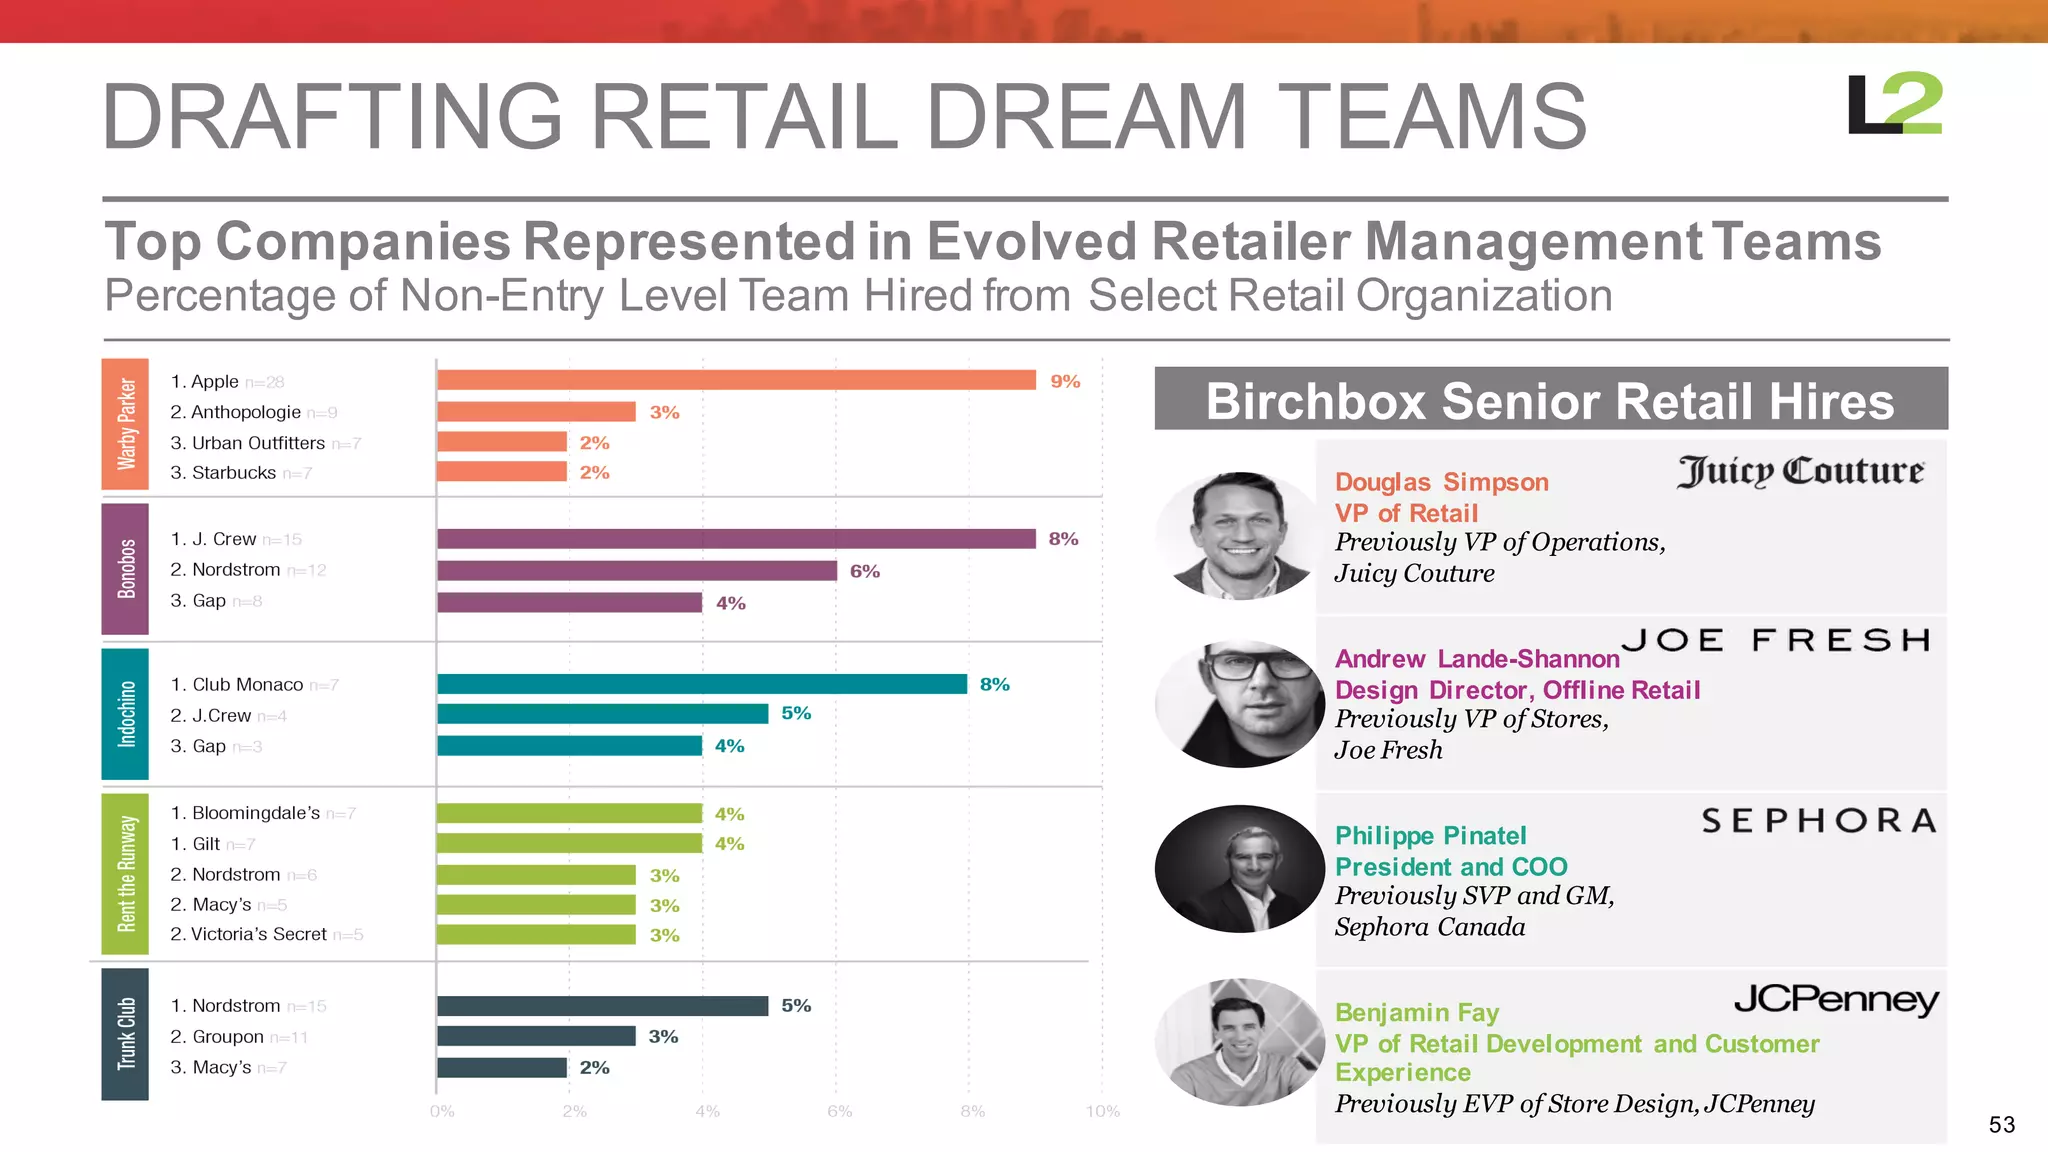


The document discusses the changing retail landscape and the challenges facing pureplay retailers. It finds that pureplay retailers must spend heavily on paid search to drive traffic since they lack brand awareness from physical stores. Pureplay retailers purchase more paid search keywords but pay higher costs per visitor than retailers with physical stores. While some pureplay retailers are growing rapidly in sales, many struggle with profitability due to high customer acquisition costs from their reliance on performance marketing. The document examines how retailers are adapting by adding physical storefronts or through acquisitions.


![[Webinar] Outmaneuver your E-commerce Competition with Data](https://cdn.slidesharecdn.com/ss_thumbnails/uncoveringdatadrivenstrategiesfore-commercemarketingusaseptember2020161-160922095222-thumbnail.jpg?width=640&height=640&fit=bounds)


