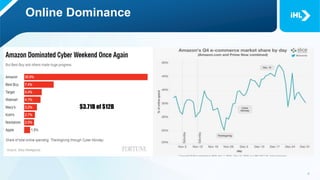
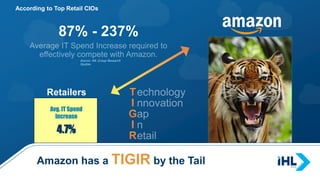
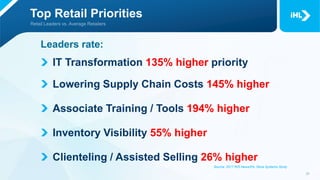
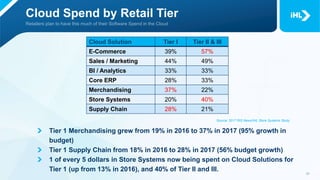
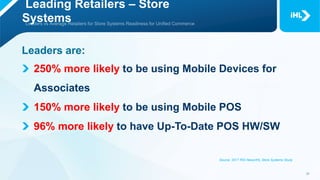
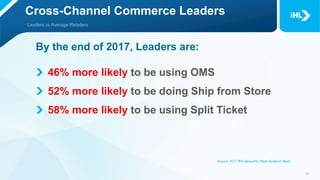
SUNRISE BREAKFAST: CIO’S CHALLENGE
REFOCUSED IT BUDGETS FOR DIGITAL
GREG BUZEK, President, IHL Group
JEFF ROSTER, VP, Strategy, IHL Group
DAVID STROBELT, SVP/CIO, Modell’s Sporting Goods
SCOTT EMMONS, Director and Founder, Innovation Lab, The Neiman Marcus Group
Sunrise Breakfast
The CIO’s Challenge –
Refocused IT Budgets for Digital
About IHL
Helping Retailers/Hospitality Make Better IT Decisions
o Managed RFP Process, Contract Reviews
Syndicated Research and Data Services
o Retail Benchmarking
o IT Forecasts - WorldView
o Sophia Data Service
Advisory Programs
o Retail Executive Advisory Program
o Strategic Operations Exchange
Custom Research
Sample Clients
Holiday Sales
Overall retail sales up 3.6%-4.9%
o Not all segments well
o Dept. Stores and Specialty Struggled
o Sporting Goods and Electronics shined.
o If you extend to restaurants and entertainment, numbers even stronger
o Christmas Week Sales Up 6.5% in Stores
Online sales up 11-17%
Online 21-24% of holiday spend 46-60% of sales growth
Amazon 38% of all online sales for Holidays,
o 49% of all online sales December 18-21
o Shipped over 2 Billion items
Sources: NRF, RetailNext, Slice, First Data, Customer Growth Partners, CNBC
Online Dominance
$3.71B of $12B
Retail’s Biggest Problem
Over 50% of US Households Have Prime Membership
66 Million Households
70% of Households > $112k Income
AWS – 10% of Revenue, 60% of Net Income +58% growth
But…. Spent estimated $17B on Shipping (~Starbucks), Lost $9B (~GameStop)
Sources: Piper Jaffray, Consumer Intelligence Research Partners, Business Insider, Statistica, IHL Group
Retail Is Being Outgunned In IT
Spending on Innovation
$15.1 B
More Than These Retailers - Combined
Source: IHL Group Research
Studies
According to Top Retail CIOs
87% - 237%
Avg. IT Spend
Increase
4.7%
Retailers
Amazon has a TIGIR by the Tail
Prime Growth
Impact on Price Comparisons
Keeping Retailers Up At Night
How do you solve a problem
like
?
To Effectively Compete
1. Make massive investments in Unified Commerce
2. Leverage Cloud Computing for jumpstart
3. Take advantage of Mobile
4. Create the WOW customer experience
You are either at the table of
Unified Commerce
or you are on the menu!!!
You Don’t Have To Beat Amazon
Retailers, Leading and Otherwise
Average sales growth in the study was 4.1%
For purposes of this study, we stratify retailers according
to their financial performance in 2016. The results are as
follows:
o Leaders – We define a Leading Retailer as one who claimed that
their 2016 revenues would represent growth of 5% or more. This
comprised 30% of the retailer pool for this study.
o Average Retailers – We define an Average Retailer as one who
claimed that their 2016 revenues represented growth of between 0%
and 5% from their 2015 revenues. This group consisted of 38% of the
retailer pool for this study.
o Below-Average Retailer – We define a Below-Average Retailer as
one who claimed that their 2016 revenues were flat or declined. This
group consisted of 32% of the retailer pool for this study.
Source: 2017 RIS News/IHL Store Systems Study
Foundational Technologies
Single View of the Order (OMS) across channels
Single View of the Customer across channels
(loyalty works everywhere)
Up-to-date POS that can access the order, inventory,
and loyalty in real time
Study Highlights
Store counts and Remodels up 4.9% & 4.2%
Enterprise & Store IT Spend up 4.5% & 4.7%
POS spend up for 2017
(25% of retailers for HW, 32% for SW)
Cloud spend up for 2017
(34% of all software)
Unified Commerce gains momentum
Source: 2017 RIS News/IHL Store Systems Study
IT Spend Growth by Retail Tier
4.6%
3.1%
4.7%
4.8%
2.3%
4.8%
Tier III Tier II Tier I
2.0%
2.5%
3.0%
3.5%
4.0%
4.5%
5.0%
Enterprise IT Spend Store IT Spend
Enterprise IT Spend
Avg. = 4.5%
Store IT Spend
Avg. = 4.7%
Source: 2017 RIS News/IHL Store Systems Study
2017 Spend Growth
8.8%
7.4%
3.8%
5.0%
1.3%
1.8%
Enterprise IT Spend Store IT Spend
0.0%
1.0%
2.0%
3.0%
4.0%
5.0%
6.0%
7.0%
8.0%
9.0%
10.0%
Leading Retailers Average Retailers Below Average Retailers
Source: 2017 RIS News/IHL Store Systems Study
23%
23%
27%
29%
30%
34%
38%
46%
46%
55%
59%
Store Comms Upgrade
IT Transformation
Empowering Store Associates
WFM Software/Hardware
Mobile for Associates
BI/Analytics for Store Associates
Lowering Supply Chain Costs
Inventory Visibility
Single Order Management Across Channels
Single View of Customer Across Channels
Upgrading CRM Loyaly Programs
0% 10% 20% 30% 40% 50% 60% 70%
Top Retail IT Priorities
Source: 2017 RIS News/IHL Store Systems Study
Top Retail Priorities
Leaders rate:
IT Transformation 135% higher priority
Lowering Supply Chain Costs 145% higher
Associate Training / Tools 194% higher
Inventory Visibility 55% higher
Clienteling / Assisted Selling 26% higher
Source: 2017 RIS News/IHL Store Systems Study
Software IT Spend in Cloud
27%
Store Systems
33%
BI/Analytics
47%
eCom
46%
Sales/Marketing
30%
Core ERP
29%
Merch
25%
Supply Chain
31% increase in % of software budget in cloud
Source: 2017 RIS News/IHL Store Systems Study
Cloud Spend by Retail Tier
Cloud Solution Tier I Tier II & III
E-Commerce 39% 57%
Sales / Marketing 44% 49%
BI / Analytics 33% 33%
Core ERP 28% 33%
Merchandising 37% 22%
Store Systems 20% 40%
Supply Chain 28% 21%
Tier 1 Merchandising grew from 19% in 2016 to 37% in 2017 (95% growth in
budget)
Tier 1 Supply Chain from 18% in 2016 to 28% in 2017 (56% budget growth)
1 of every 5 dollars in Store Systems now being spent on Cloud Solutions for
Tier 1 (up from 13% in 2016), and 40% of Tier II and III.
Source: 2017 RIS News/IHL Store Systems Study
14%
20%
27%
15%
32%
25%
22%
16%
11%
7%
12%
11%
Digital Signage
POS Software
POS Client - Base System
0% 10% 20% 30% 40% 50% 60% 70% 80% 90%
Up to Date/In Place Within 12 Months 12-24 Months 24-36 Months
Store Systems Purchase Timeframe
Source: 2017 RIS News/IHL Store Systems Study
5%
22%
24%
25%
24%
25%
25%
35%
18%
23%
18%
18%
7%
9%
2%
4%
Consumer Mobile Checkout
Mobile POS
Mobile for Associates (non-POS)
Mobile for Managers
0% 10% 20% 30% 40% 50% 60% 70% 80% 90%
Up to Date/In Place Within 12 Months 12-24 Months 24-36 Months
Store Systems Purchase Timeframe
Source: 2017 RIS News/IHL Store Systems Study
Leading Retailers – Store
Systems
Leaders are:
250% more likely to be using Mobile Devices for
Associates
150% more likely to be using Mobile POS
96% more likely to have Up-To-Date POS HW/SW
Source: 2017 RIS News/IHL Store Systems Study
22%
21%
33%
33%
46%
25%
14%
11%
24%
5%
23%
21%
13%
20%
14%
9%
4%
9%
9%
4%
Holistic Merch. Across Channels
Click & Collect
Ship from Store
Central Order Management
Return Online Purchases at Store
0% 10% 20% 30% 40% 50% 60% 70% 80% 90%
Up to Date/In Place Within 12 Months 12-24 Months 24-36 Months
Cross-Channel Commerce Timeframe
Source: 2017 RIS News/IHL Store Systems Study
24%
32%
32%
45%
25%
16%
30%
16%
18%
16%
11%
15%
2%
7%
4%
4%
Split ticket
Order Inventory at Other Stores
Order Online from POS
Check Inventory at Other Stores
0% 10% 20% 30% 40% 50% 60% 70% 80% 90%
Up to Date/In Place Within 12 Months 12-24 Months 24-36 Months
Cross-Channel Commerce Timeframe
Source: 2017 RIS News/IHL Store Systems Study
Cross-Channel Commerce Leaders
By the end of 2017, Leaders are:
46% more likely to be using OMS
52% more likely to be doing Ship from Store
58% more likely to be using Split Ticket
Source: 2017 RIS News/IHL Store Systems Study
Technologies That Move The
Needle
Sales growth increases vs those who don’t:
2.1x for retailers who Market Cross-Channel Capabilities
2.1x who can use Customer Preferences in All Channels
2.0x that do Cross-Channel Demand Planning
1.9X when using Mobile POS
1.8x who use Loyalty Profiles Available in Real Time
1.7x have Integrated Marketing Across Channels
1.7x those Mobile Devices for Associates
Source: Joint NCR/IHL Study
Vendors to Visit
Sales growth increases vs those who don’t:
Integrated Marketing Across Channels
OMS
BI
Geospatial
Cross-Channel Demand Planning
Mobile POS
Loyalty Profiles Available in Real Time
IT Transformation
Thank You

Sunrise Breakfast: CIO's Challenge

  • 1.
    SUNRISE BREAKFAST: CIO’SCHALLENGE REFOCUSED IT BUDGETS FOR DIGITAL GREG BUZEK, President, IHL Group JEFF ROSTER, VP, Strategy, IHL Group DAVID STROBELT, SVP/CIO, Modell’s Sporting Goods SCOTT EMMONS, Director and Founder, Innovation Lab, The Neiman Marcus Group
  • 2.
    Sunrise Breakfast The CIO’sChallenge – Refocused IT Budgets for Digital
  • 3.
    About IHL Helping Retailers/HospitalityMake Better IT Decisions o Managed RFP Process, Contract Reviews Syndicated Research and Data Services o Retail Benchmarking o IT Forecasts - WorldView o Sophia Data Service Advisory Programs o Retail Executive Advisory Program o Strategic Operations Exchange Custom Research
  • 4.
  • 5.
    Holiday Sales Overall retailsales up 3.6%-4.9% o Not all segments well o Dept. Stores and Specialty Struggled o Sporting Goods and Electronics shined. o If you extend to restaurants and entertainment, numbers even stronger o Christmas Week Sales Up 6.5% in Stores Online sales up 11-17% Online 21-24% of holiday spend 46-60% of sales growth Amazon 38% of all online sales for Holidays, o 49% of all online sales December 18-21 o Shipped over 2 Billion items Sources: NRF, RetailNext, Slice, First Data, Customer Growth Partners, CNBC
  • 6.
  • 7.
    Retail’s Biggest Problem Over50% of US Households Have Prime Membership 66 Million Households 70% of Households > $112k Income AWS – 10% of Revenue, 60% of Net Income +58% growth But…. Spent estimated $17B on Shipping (~Starbucks), Lost $9B (~GameStop) Sources: Piper Jaffray, Consumer Intelligence Research Partners, Business Insider, Statistica, IHL Group
  • 8.
    Retail Is BeingOutgunned In IT Spending on Innovation $15.1 B
  • 9.
    More Than TheseRetailers - Combined
  • 10.
    Source: IHL GroupResearch Studies According to Top Retail CIOs 87% - 237% Avg. IT Spend Increase 4.7% Retailers Amazon has a TIGIR by the Tail
  • 11.
  • 12.
    Impact on PriceComparisons
  • 13.
    Keeping Retailers UpAt Night How do you solve a problem like ?
  • 14.
    To Effectively Compete 1.Make massive investments in Unified Commerce 2. Leverage Cloud Computing for jumpstart 3. Take advantage of Mobile 4. Create the WOW customer experience
  • 15.
    You are eitherat the table of Unified Commerce or you are on the menu!!!
  • 16.
    You Don’t HaveTo Beat Amazon
  • 17.
    Retailers, Leading andOtherwise Average sales growth in the study was 4.1% For purposes of this study, we stratify retailers according to their financial performance in 2016. The results are as follows: o Leaders – We define a Leading Retailer as one who claimed that their 2016 revenues would represent growth of 5% or more. This comprised 30% of the retailer pool for this study. o Average Retailers – We define an Average Retailer as one who claimed that their 2016 revenues represented growth of between 0% and 5% from their 2015 revenues. This group consisted of 38% of the retailer pool for this study. o Below-Average Retailer – We define a Below-Average Retailer as one who claimed that their 2016 revenues were flat or declined. This group consisted of 32% of the retailer pool for this study. Source: 2017 RIS News/IHL Store Systems Study Source: 2017 RIS News/IHL Store Systems Study
  • 18.
    Foundational Technologies Single Viewof the Order (OMS) across channels Single View of the Customer across channels (loyalty works everywhere) Up-to-date POS that can access the order, inventory, and loyalty in real time
  • 19.
    Study Highlights Store countsand Remodels up 4.9% & 4.2% Enterprise & Store IT Spend up 4.5% & 4.7% POS spend up for 2017 (25% of retailers for HW, 32% for SW) Cloud spend up for 2017 (34% of all software) Unified Commerce gains momentum Source: 2017 RIS News/IHL Store Systems Study
  • 20.
    IT Spend Growthby Retail Tier 4.6% 3.1% 4.7% 4.8% 2.3% 4.8% Tier III Tier II Tier I 2.0% 2.5% 3.0% 3.5% 4.0% 4.5% 5.0% Enterprise IT Spend Store IT Spend Enterprise IT Spend Avg. = 4.5% Store IT Spend Avg. = 4.7% Source: 2017 RIS News/IHL Store Systems Study
  • 21.
    2017 Spend Growth 8.8% 7.4% 3.8% 5.0% 1.3% 1.8% EnterpriseIT Spend Store IT Spend 0.0% 1.0% 2.0% 3.0% 4.0% 5.0% 6.0% 7.0% 8.0% 9.0% 10.0% Leading Retailers Average Retailers Below Average Retailers Source: 2017 RIS News/IHL Store Systems Study
  • 22.
    23% 23% 27% 29% 30% 34% 38% 46% 46% 55% 59% Store Comms Upgrade ITTransformation Empowering Store Associates WFM Software/Hardware Mobile for Associates BI/Analytics for Store Associates Lowering Supply Chain Costs Inventory Visibility Single Order Management Across Channels Single View of Customer Across Channels Upgrading CRM Loyaly Programs 0% 10% 20% 30% 40% 50% 60% 70% Top Retail IT Priorities Source: 2017 RIS News/IHL Store Systems Study
  • 23.
    Top Retail Priorities Leadersrate: IT Transformation 135% higher priority Lowering Supply Chain Costs 145% higher Associate Training / Tools 194% higher Inventory Visibility 55% higher Clienteling / Assisted Selling 26% higher Source: 2017 RIS News/IHL Store Systems Study
  • 24.
    Software IT Spendin Cloud 27% Store Systems 33% BI/Analytics 47% eCom 46% Sales/Marketing 30% Core ERP 29% Merch 25% Supply Chain 31% increase in % of software budget in cloud Source: 2017 RIS News/IHL Store Systems Study
  • 25.
    Cloud Spend byRetail Tier Cloud Solution Tier I Tier II & III E-Commerce 39% 57% Sales / Marketing 44% 49% BI / Analytics 33% 33% Core ERP 28% 33% Merchandising 37% 22% Store Systems 20% 40% Supply Chain 28% 21% Tier 1 Merchandising grew from 19% in 2016 to 37% in 2017 (95% growth in budget) Tier 1 Supply Chain from 18% in 2016 to 28% in 2017 (56% budget growth) 1 of every 5 dollars in Store Systems now being spent on Cloud Solutions for Tier 1 (up from 13% in 2016), and 40% of Tier II and III. Source: 2017 RIS News/IHL Store Systems Study
  • 26.
    14% 20% 27% 15% 32% 25% 22% 16% 11% 7% 12% 11% Digital Signage POS Software POSClient - Base System 0% 10% 20% 30% 40% 50% 60% 70% 80% 90% Up to Date/In Place Within 12 Months 12-24 Months 24-36 Months Store Systems Purchase Timeframe Source: 2017 RIS News/IHL Store Systems Study
  • 27.
    5% 22% 24% 25% 24% 25% 25% 35% 18% 23% 18% 18% 7% 9% 2% 4% Consumer Mobile Checkout MobilePOS Mobile for Associates (non-POS) Mobile for Managers 0% 10% 20% 30% 40% 50% 60% 70% 80% 90% Up to Date/In Place Within 12 Months 12-24 Months 24-36 Months Store Systems Purchase Timeframe Source: 2017 RIS News/IHL Store Systems Study
  • 28.
    Leading Retailers –Store Systems Leaders are: 250% more likely to be using Mobile Devices for Associates 150% more likely to be using Mobile POS 96% more likely to have Up-To-Date POS HW/SW Source: 2017 RIS News/IHL Store Systems Study
  • 29.
    22% 21% 33% 33% 46% 25% 14% 11% 24% 5% 23% 21% 13% 20% 14% 9% 4% 9% 9% 4% Holistic Merch. AcrossChannels Click & Collect Ship from Store Central Order Management Return Online Purchases at Store 0% 10% 20% 30% 40% 50% 60% 70% 80% 90% Up to Date/In Place Within 12 Months 12-24 Months 24-36 Months Cross-Channel Commerce Timeframe Source: 2017 RIS News/IHL Store Systems Study
  • 30.
    24% 32% 32% 45% 25% 16% 30% 16% 18% 16% 11% 15% 2% 7% 4% 4% Split ticket Order Inventoryat Other Stores Order Online from POS Check Inventory at Other Stores 0% 10% 20% 30% 40% 50% 60% 70% 80% 90% Up to Date/In Place Within 12 Months 12-24 Months 24-36 Months Cross-Channel Commerce Timeframe Source: 2017 RIS News/IHL Store Systems Study
  • 31.
    Cross-Channel Commerce Leaders Bythe end of 2017, Leaders are: 46% more likely to be using OMS 52% more likely to be doing Ship from Store 58% more likely to be using Split Ticket Source: 2017 RIS News/IHL Store Systems Study
  • 32.
    Technologies That MoveThe Needle Sales growth increases vs those who don’t: 2.1x for retailers who Market Cross-Channel Capabilities 2.1x who can use Customer Preferences in All Channels 2.0x that do Cross-Channel Demand Planning 1.9X when using Mobile POS 1.8x who use Loyalty Profiles Available in Real Time 1.7x have Integrated Marketing Across Channels 1.7x those Mobile Devices for Associates Source: Joint NCR/IHL Study
  • 33.
    Vendors to Visit Salesgrowth increases vs those who don’t: Integrated Marketing Across Channels OMS BI Geospatial Cross-Channel Demand Planning Mobile POS Loyalty Profiles Available in Real Time IT Transformation
  • 34.