Download to read offline


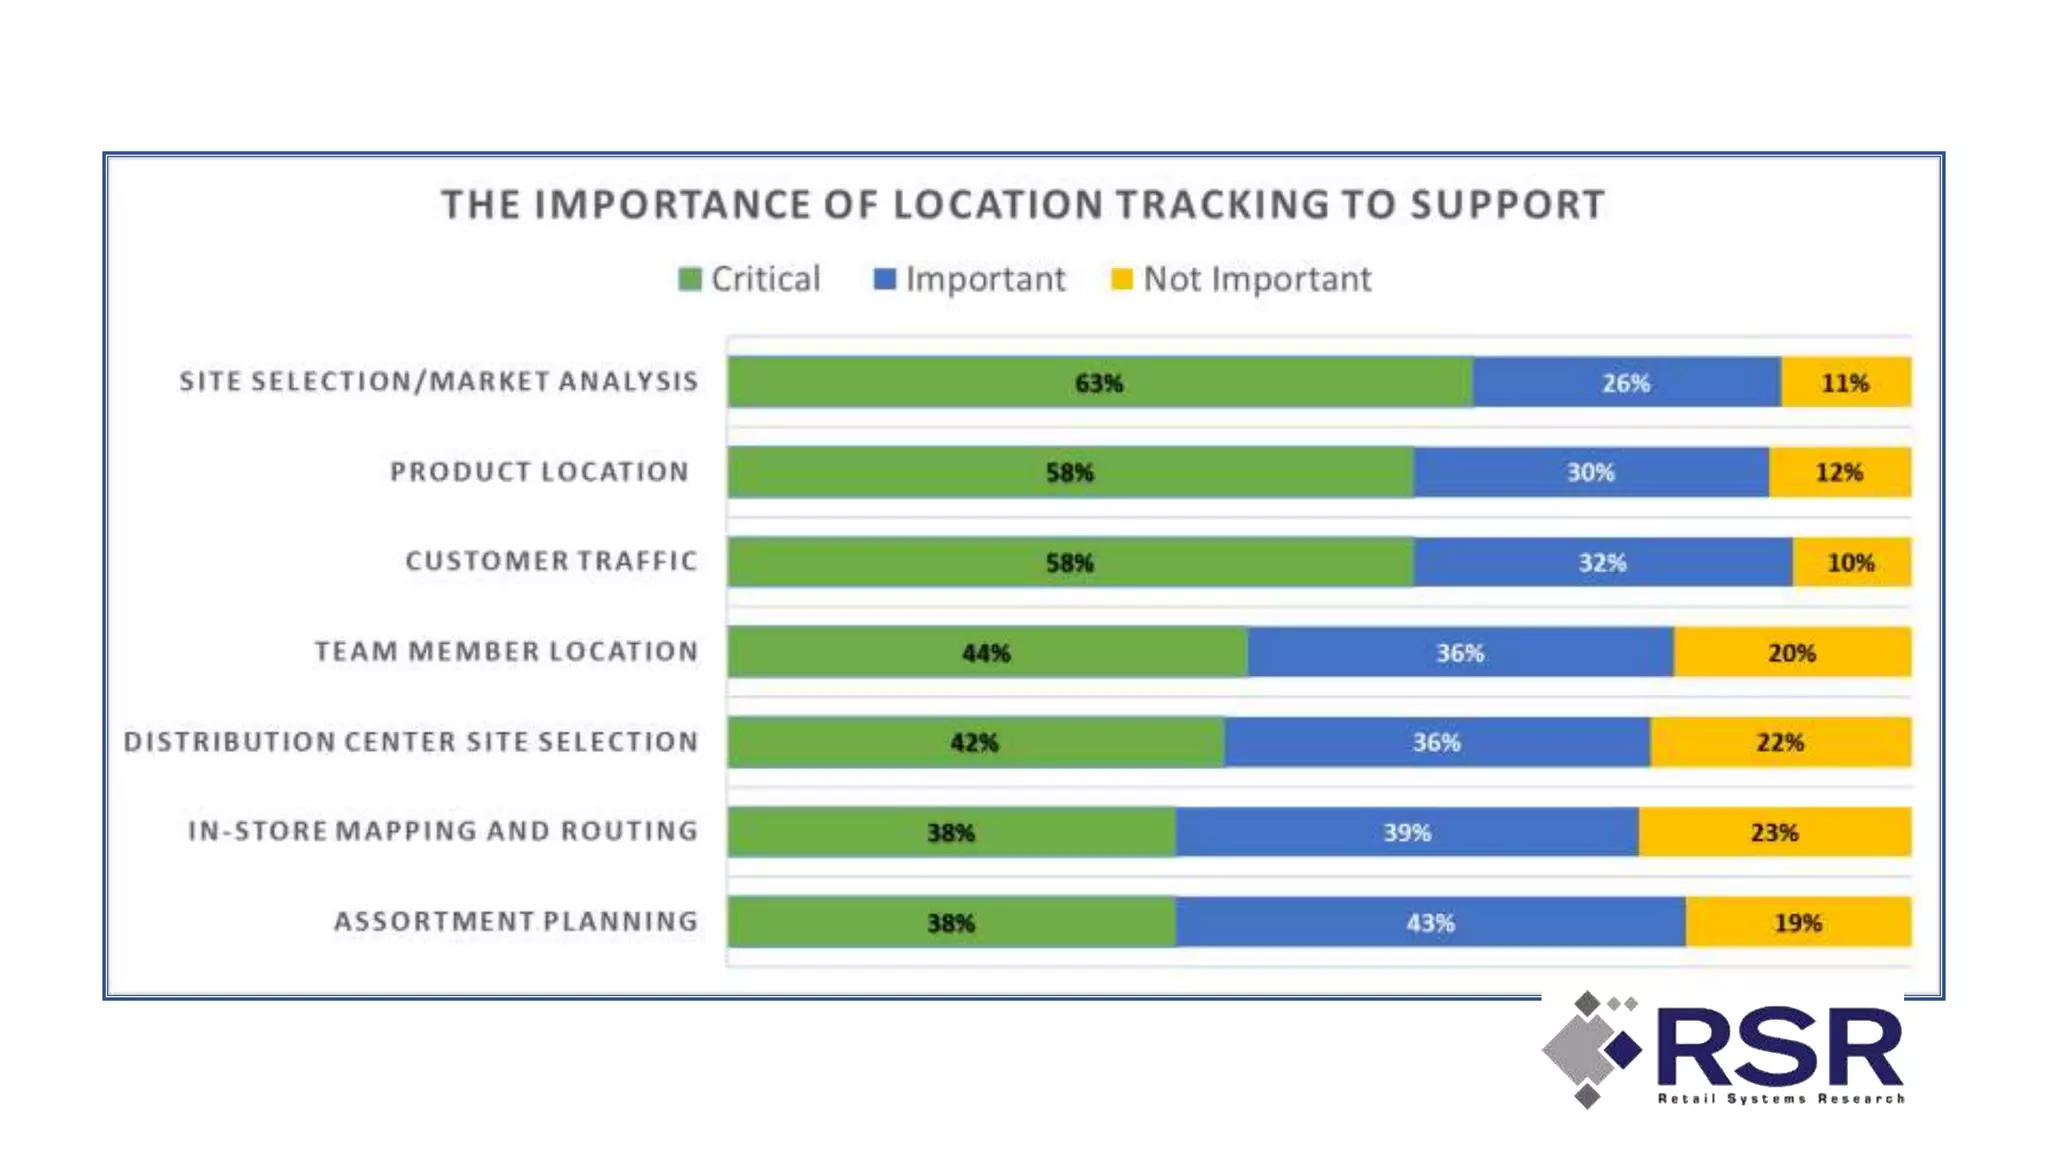


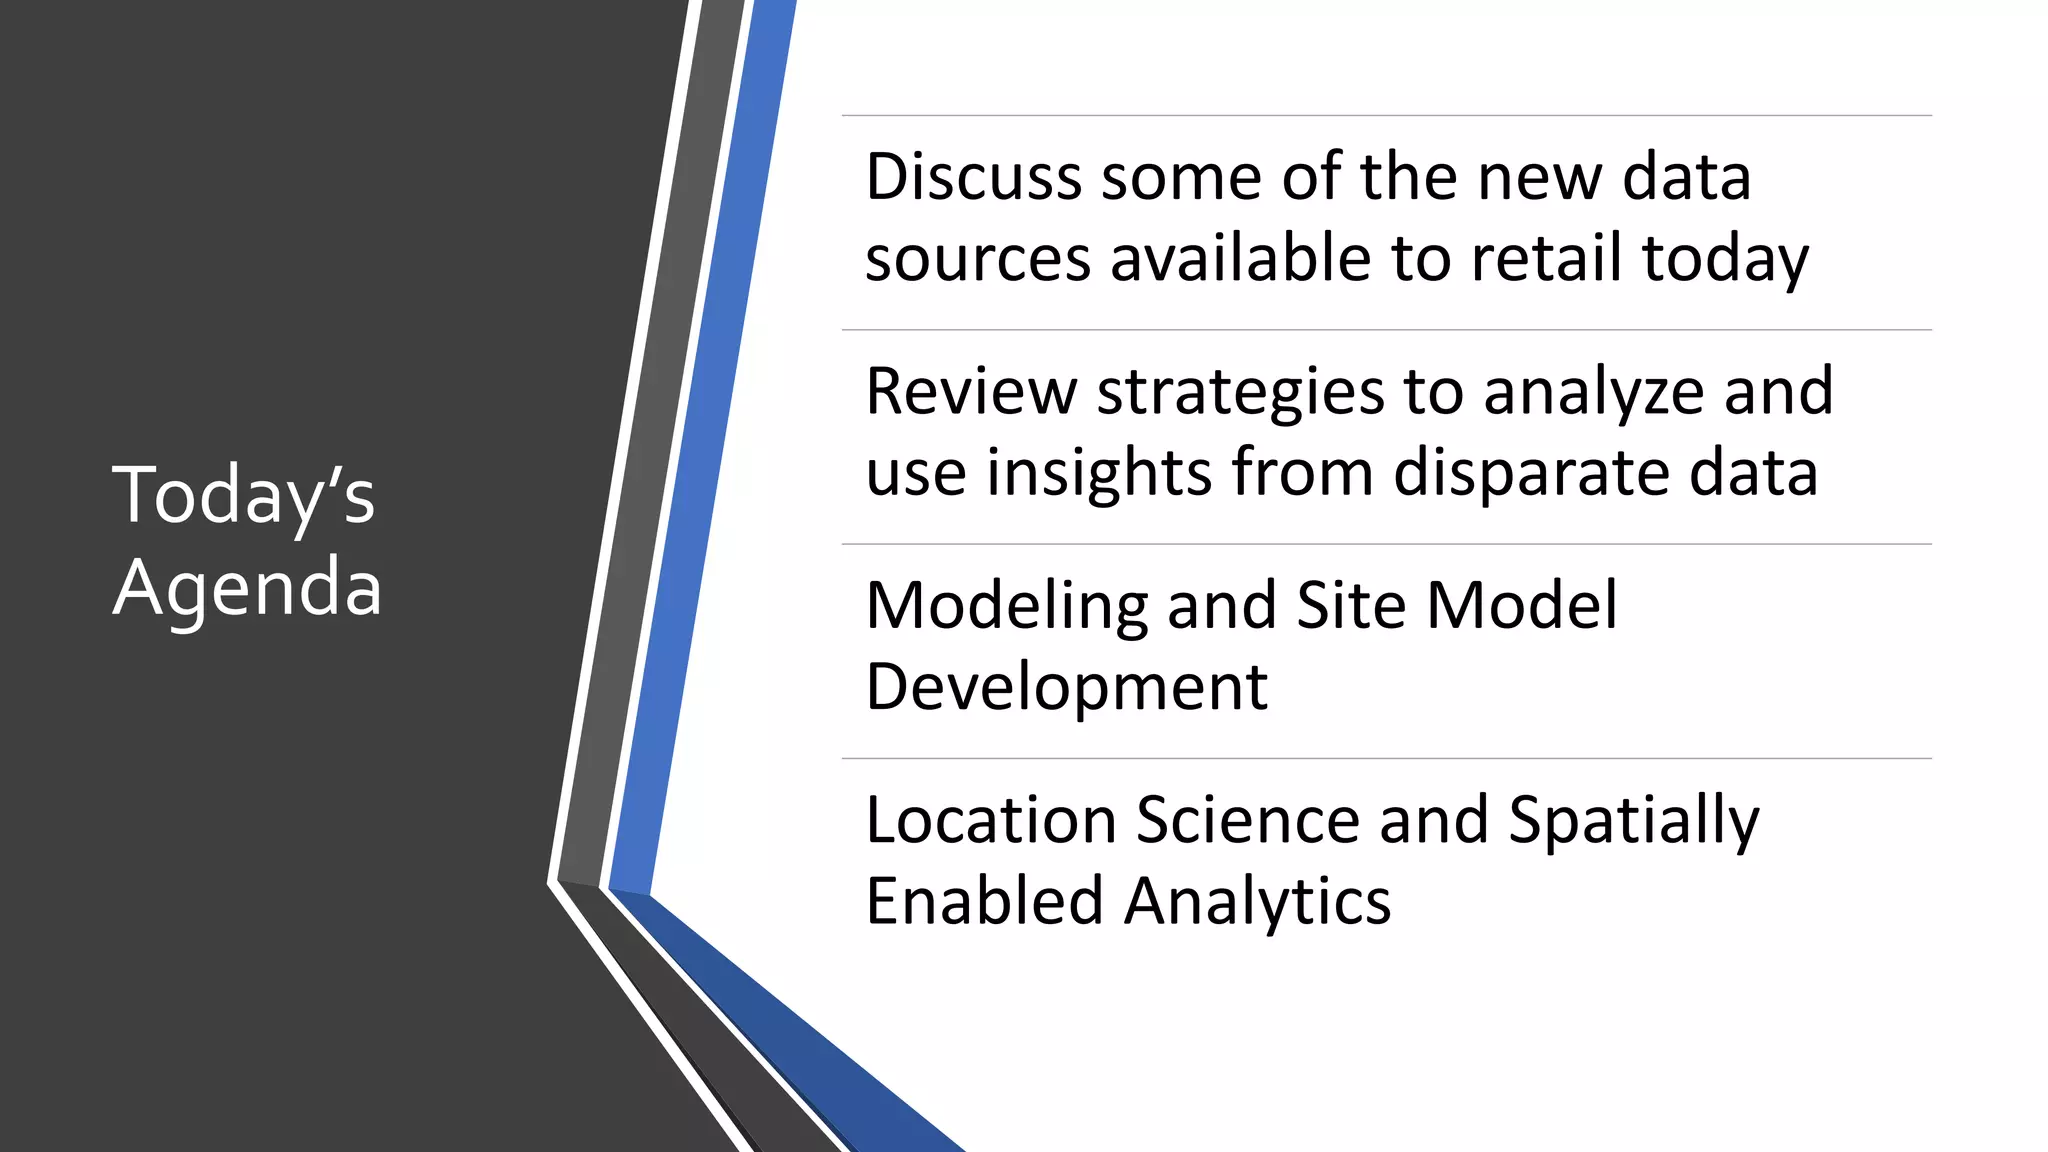


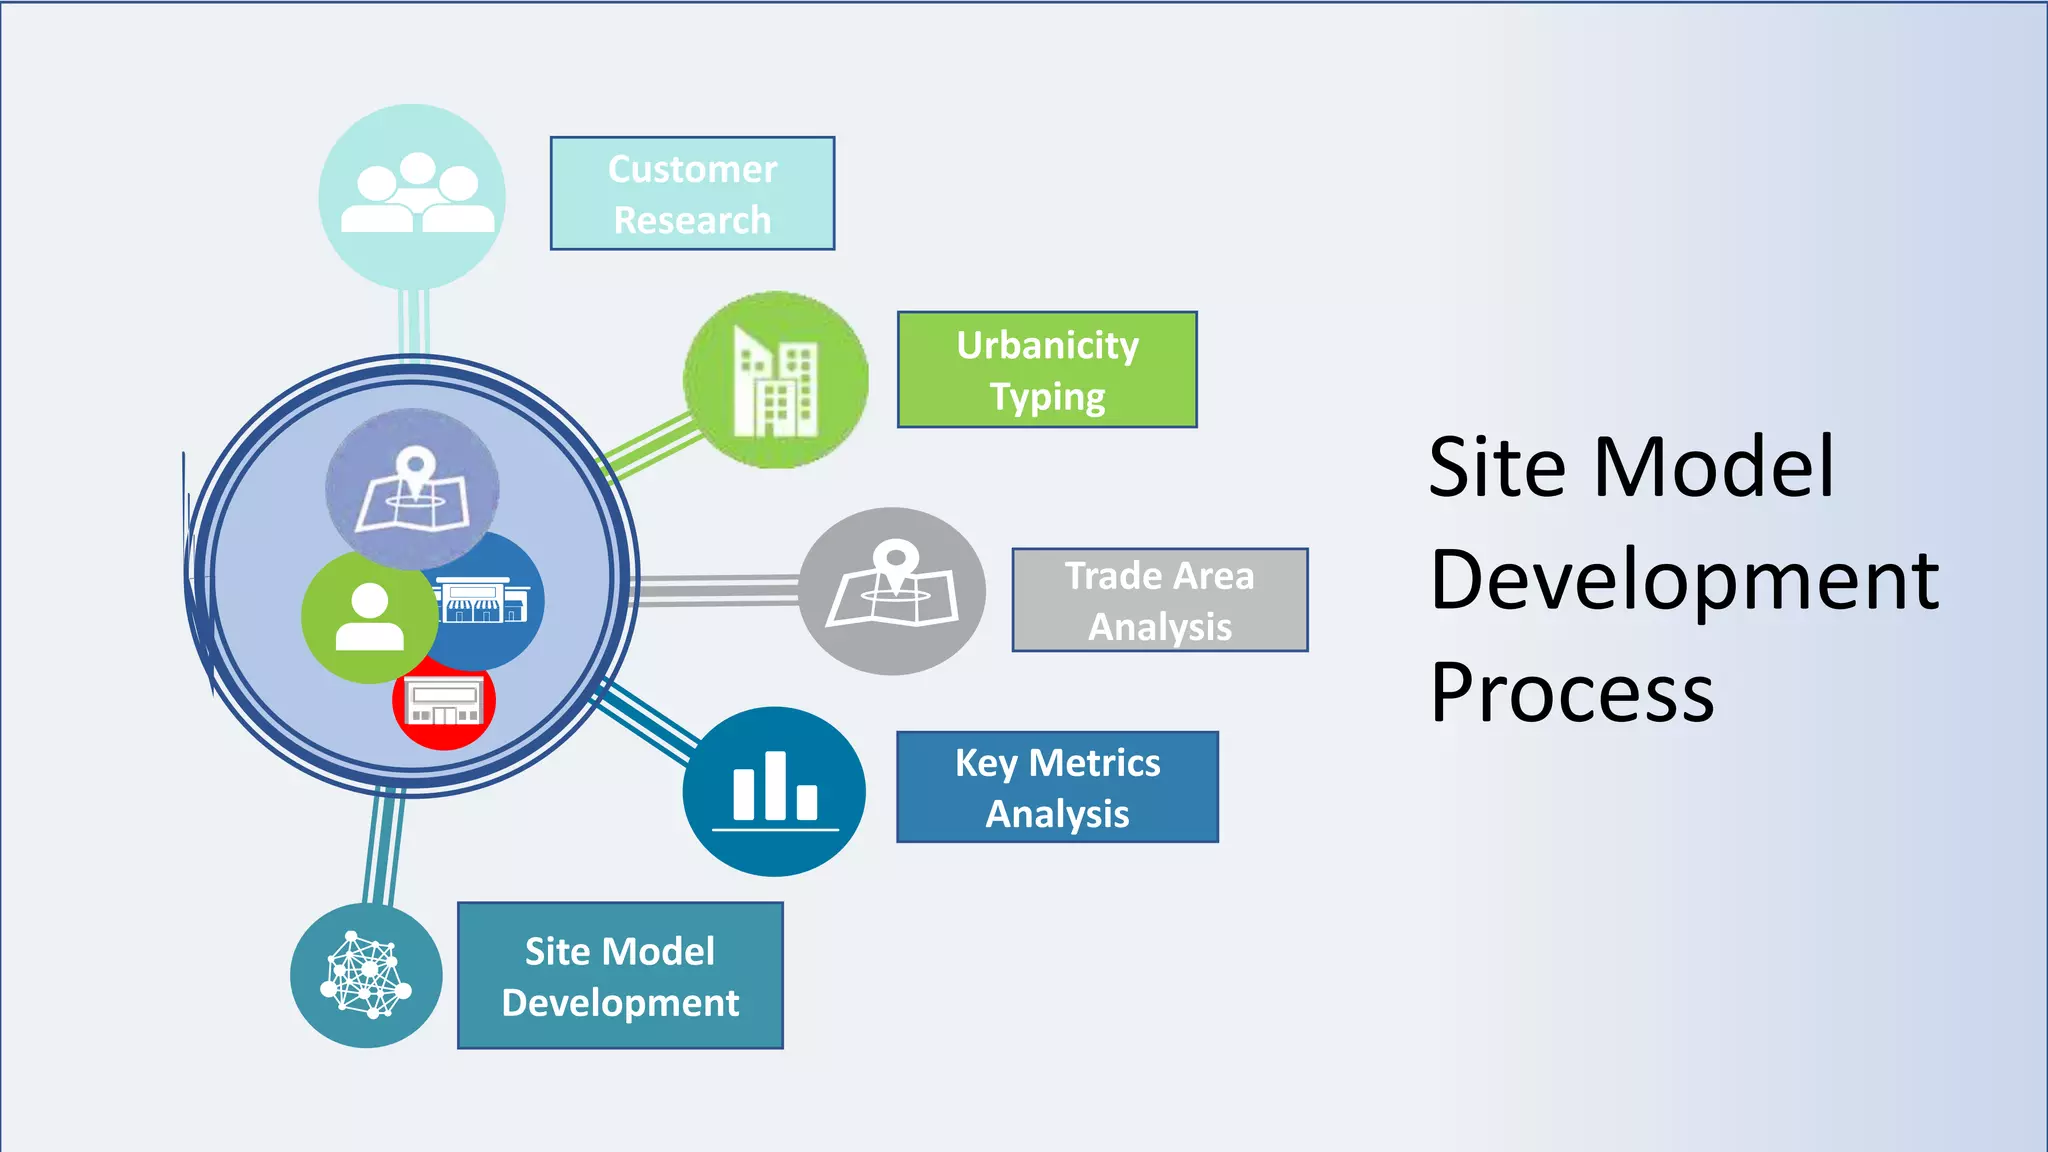
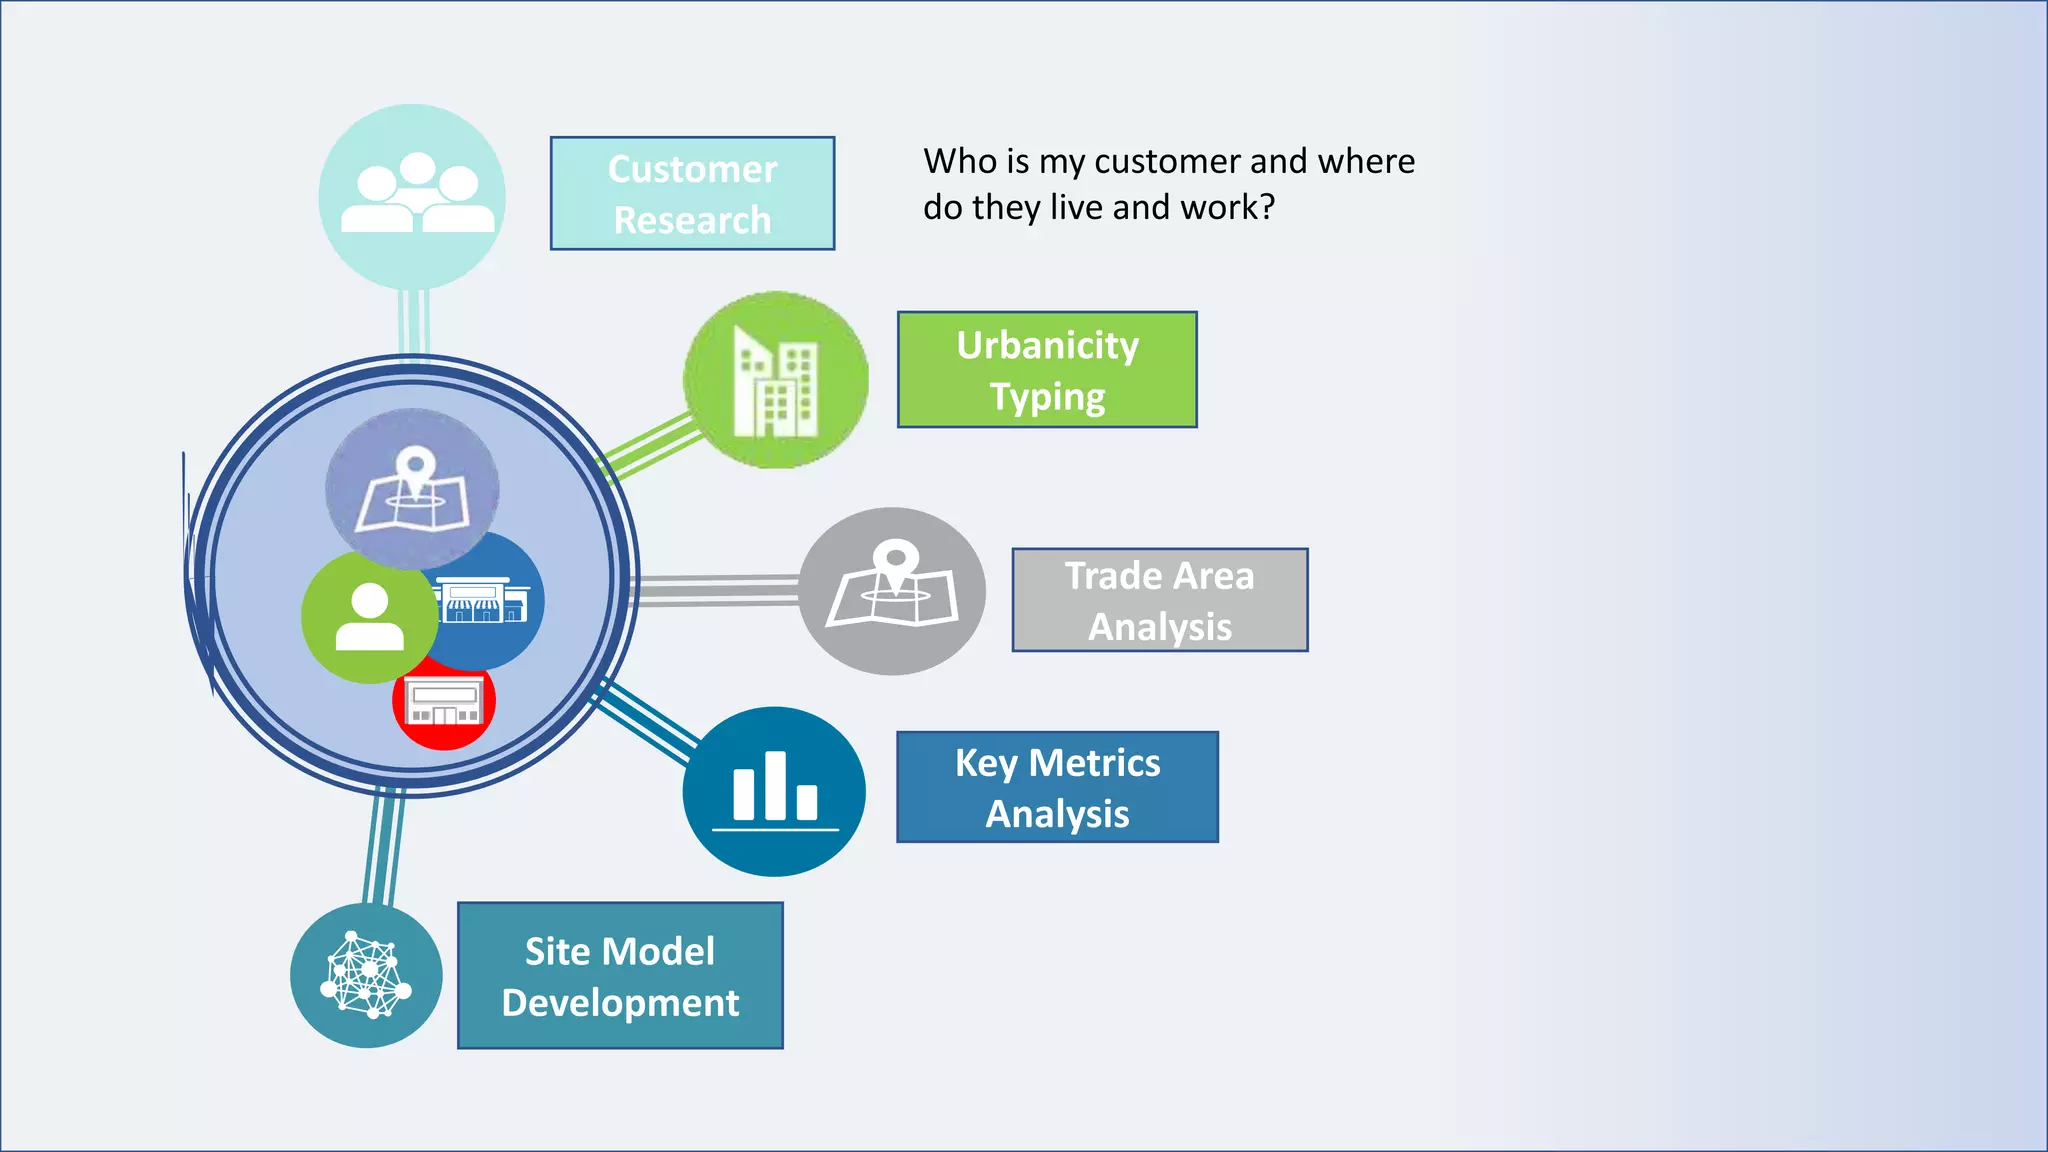
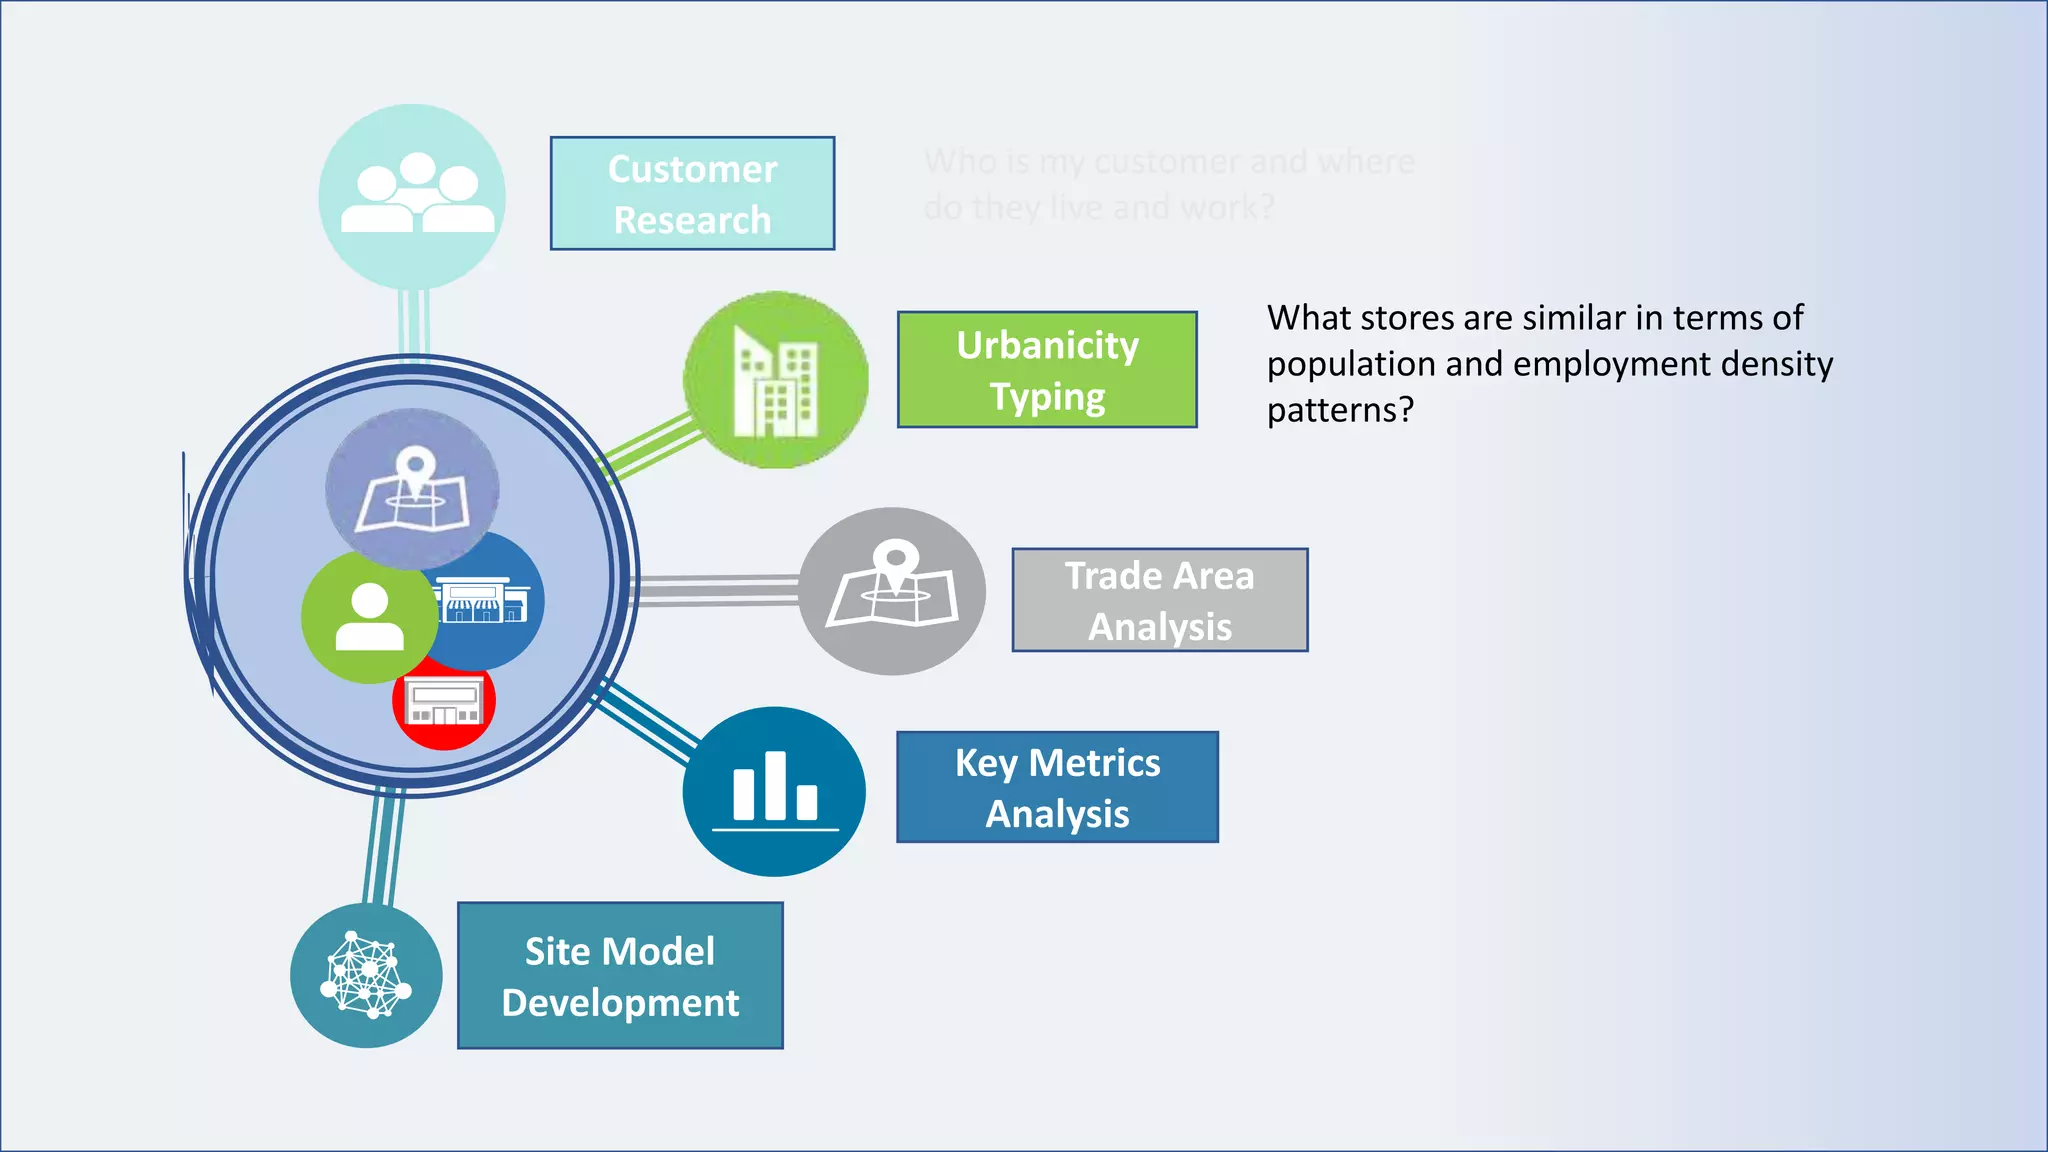
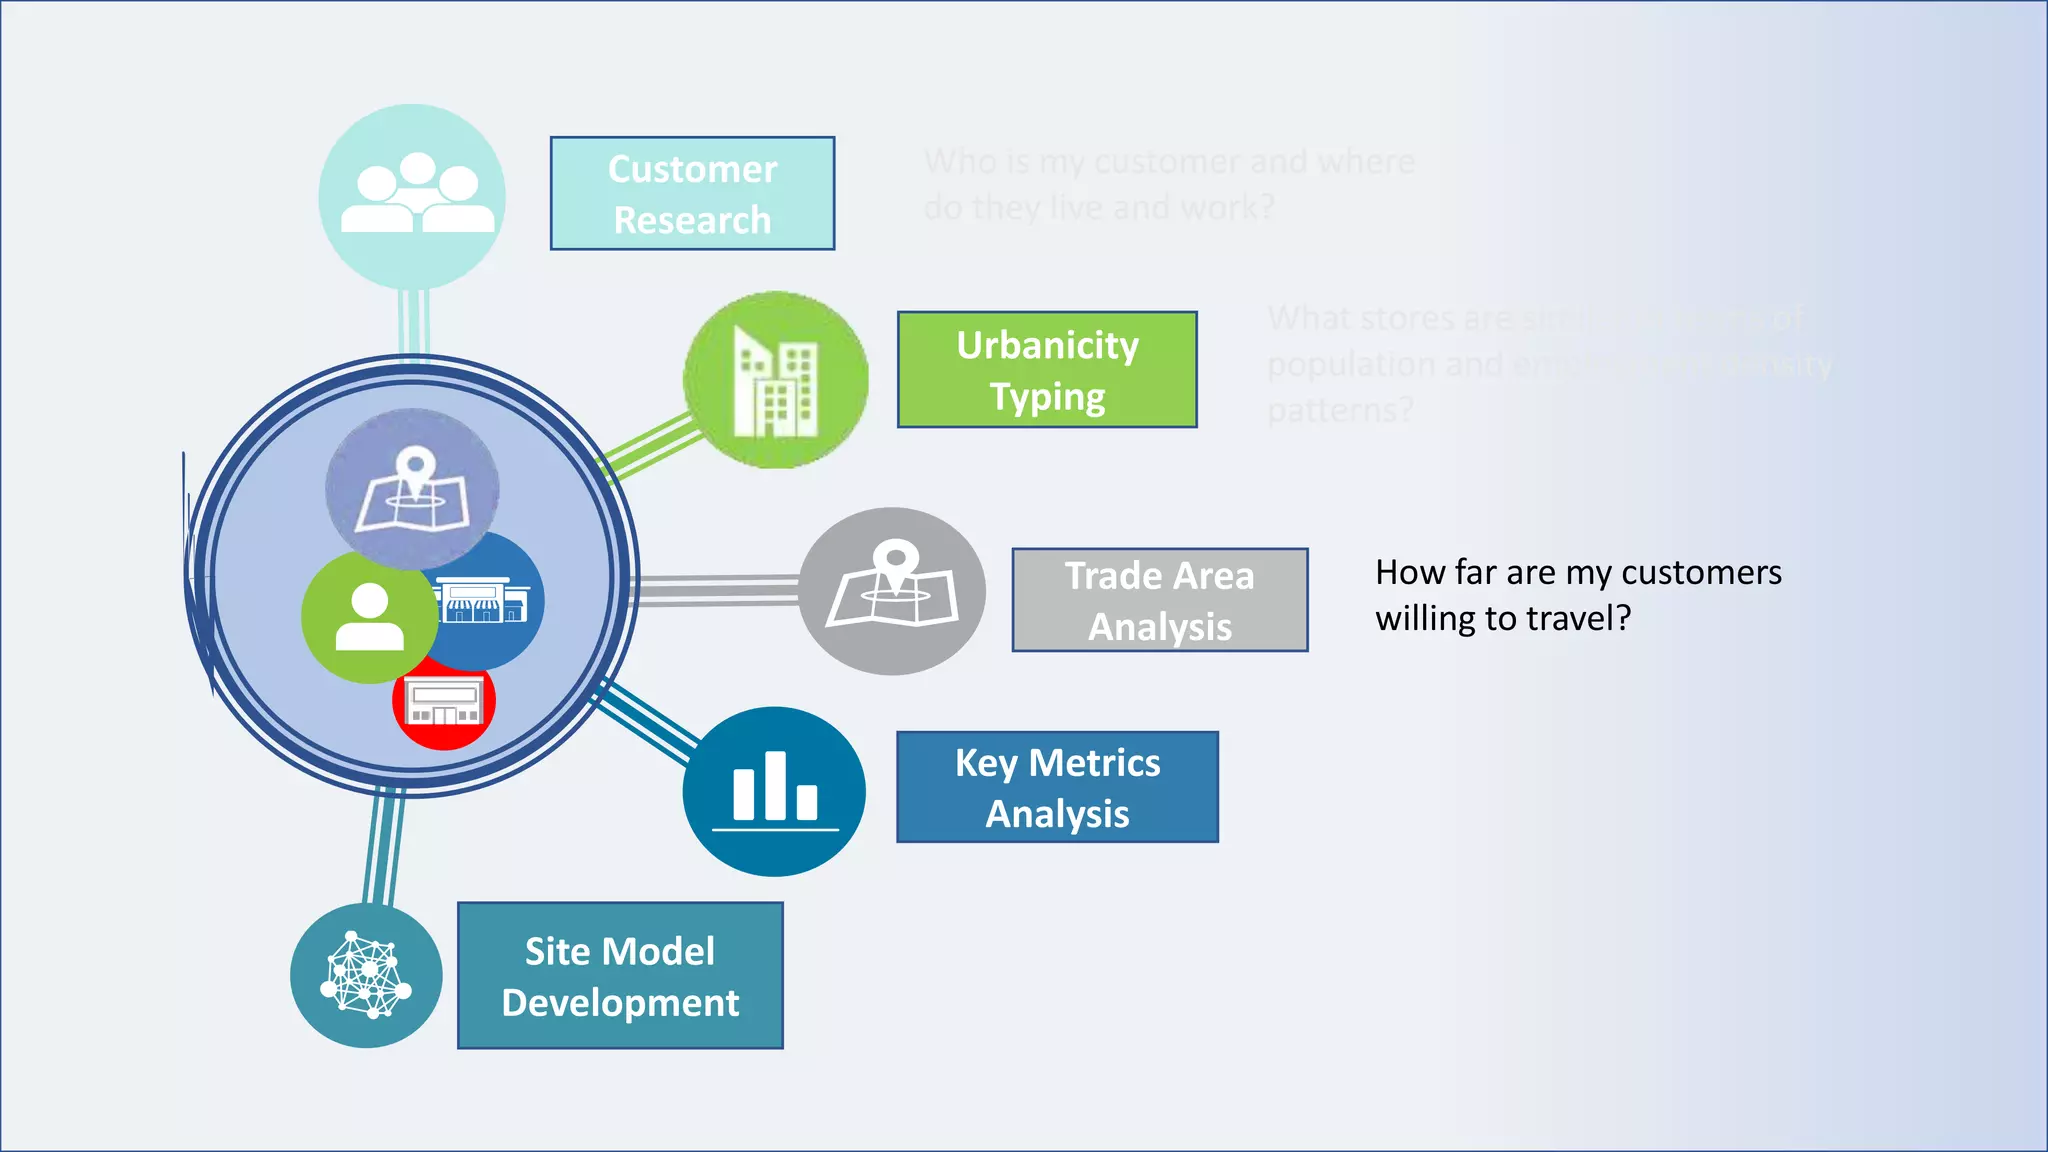
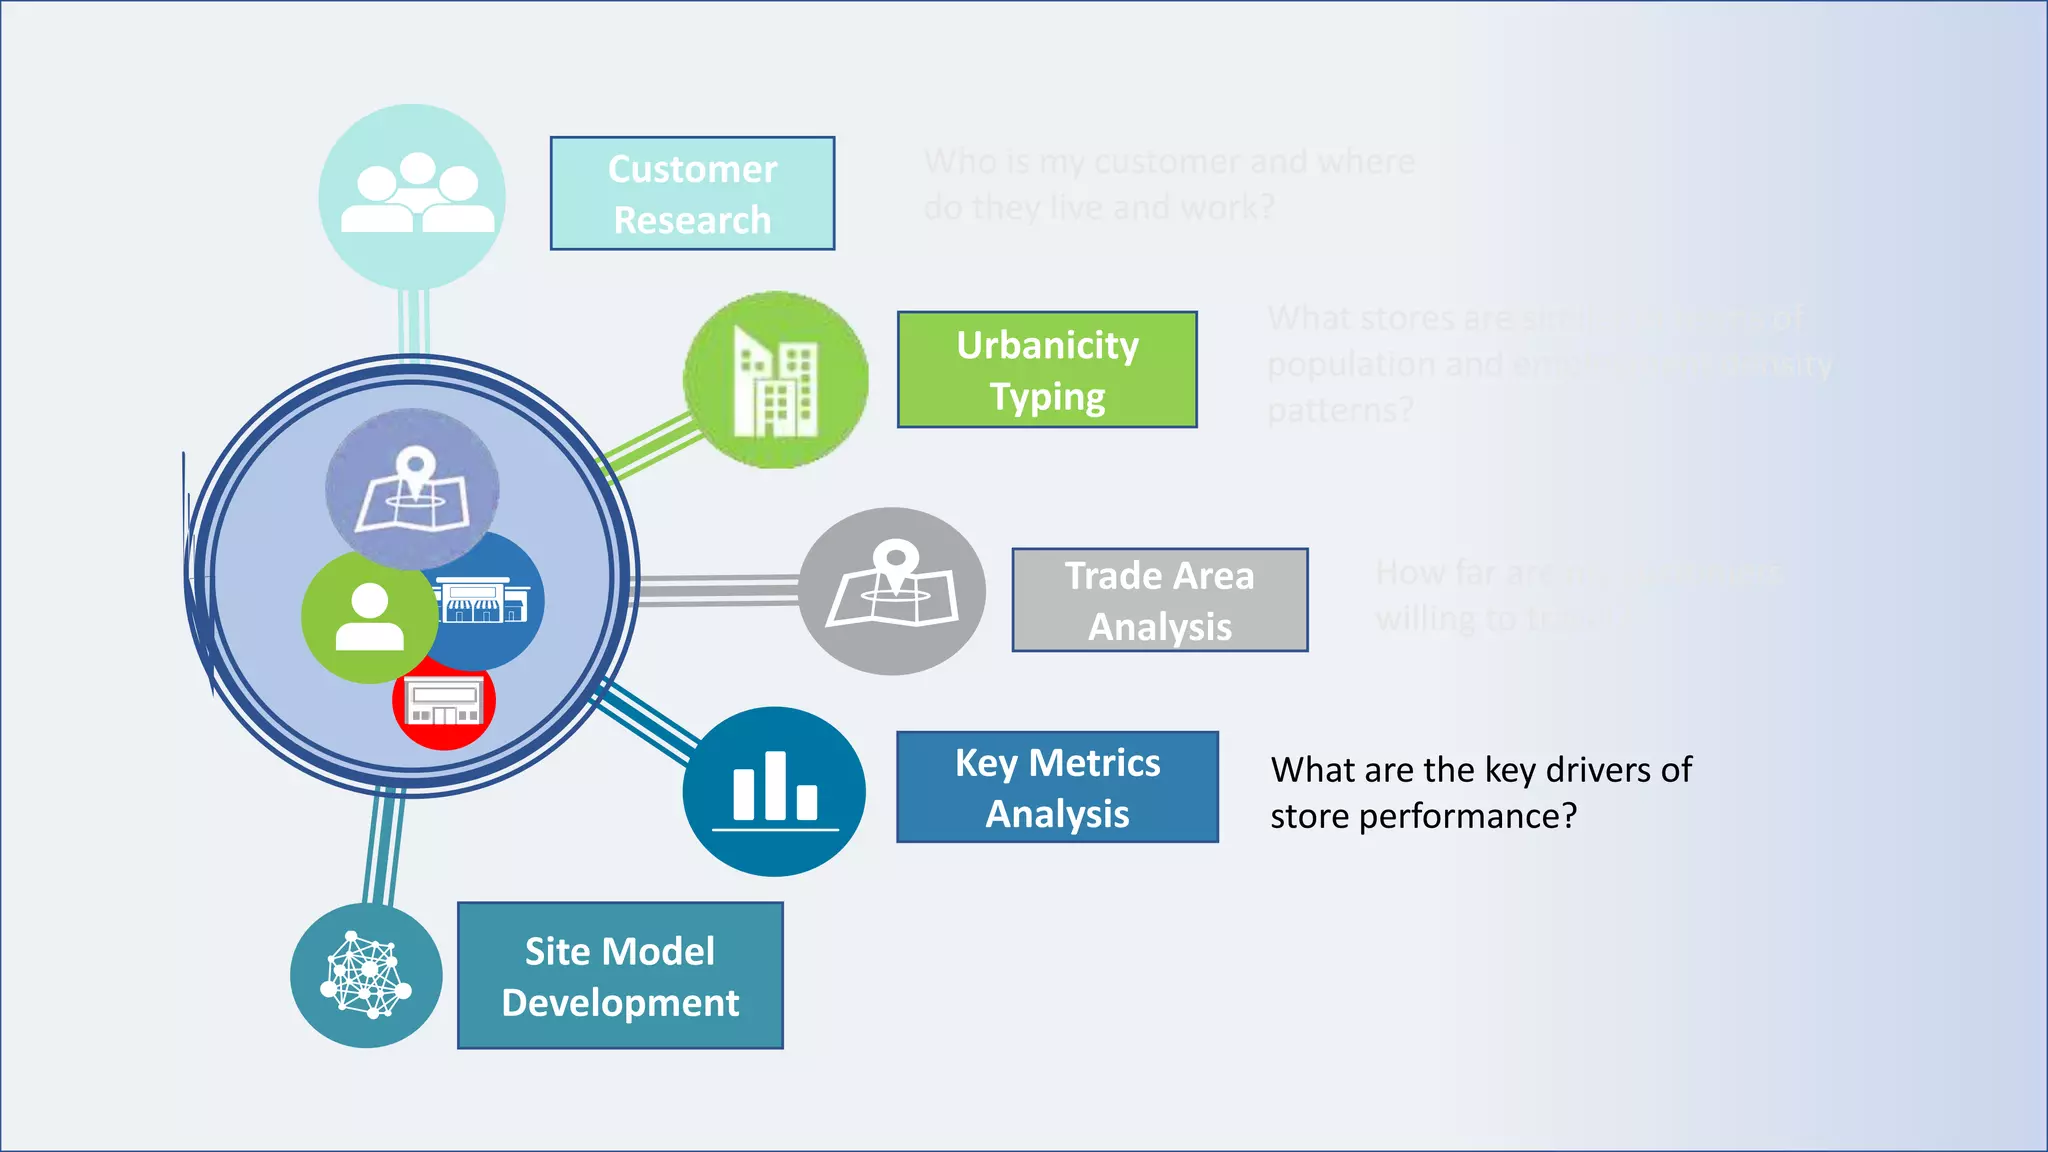
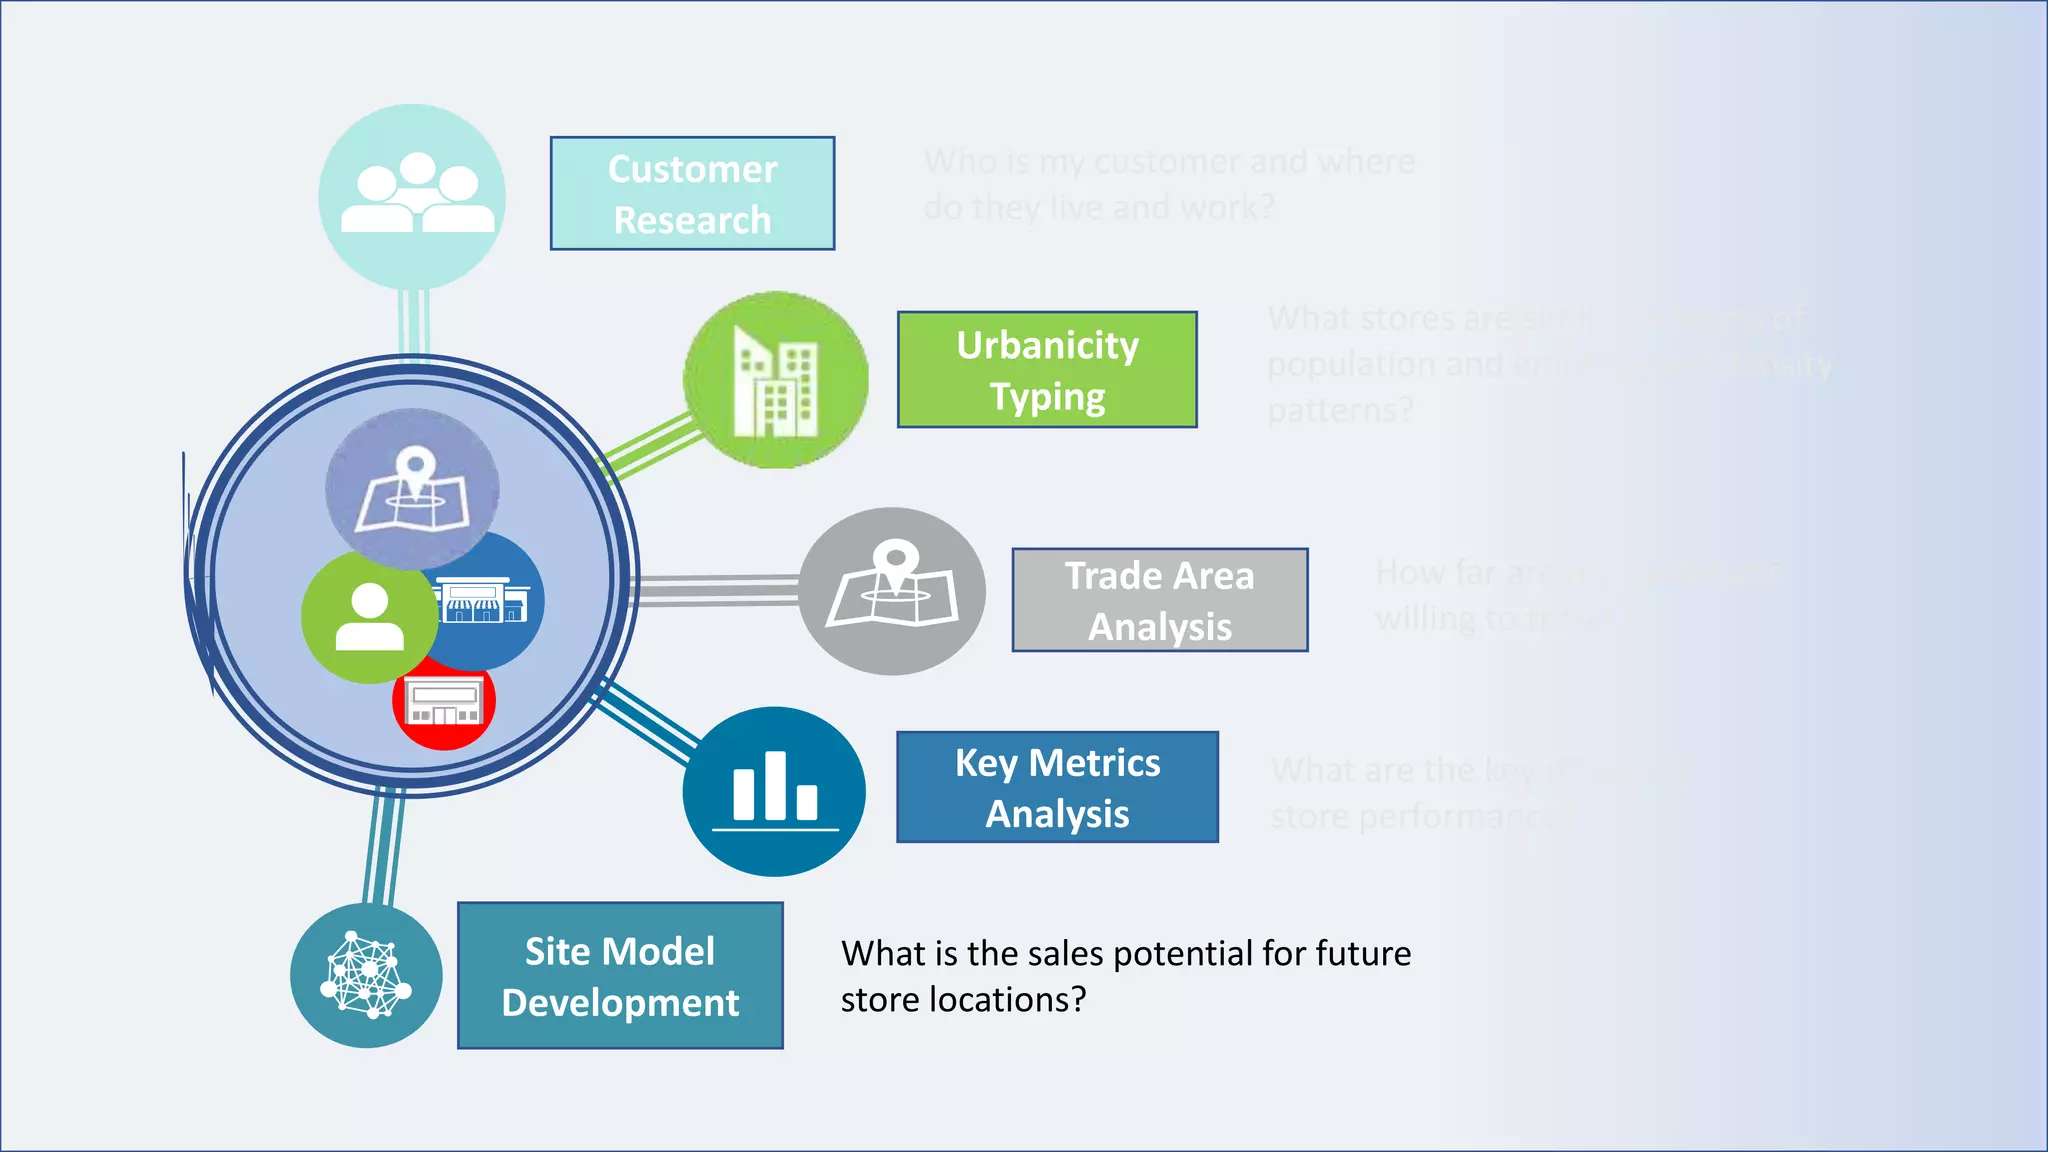
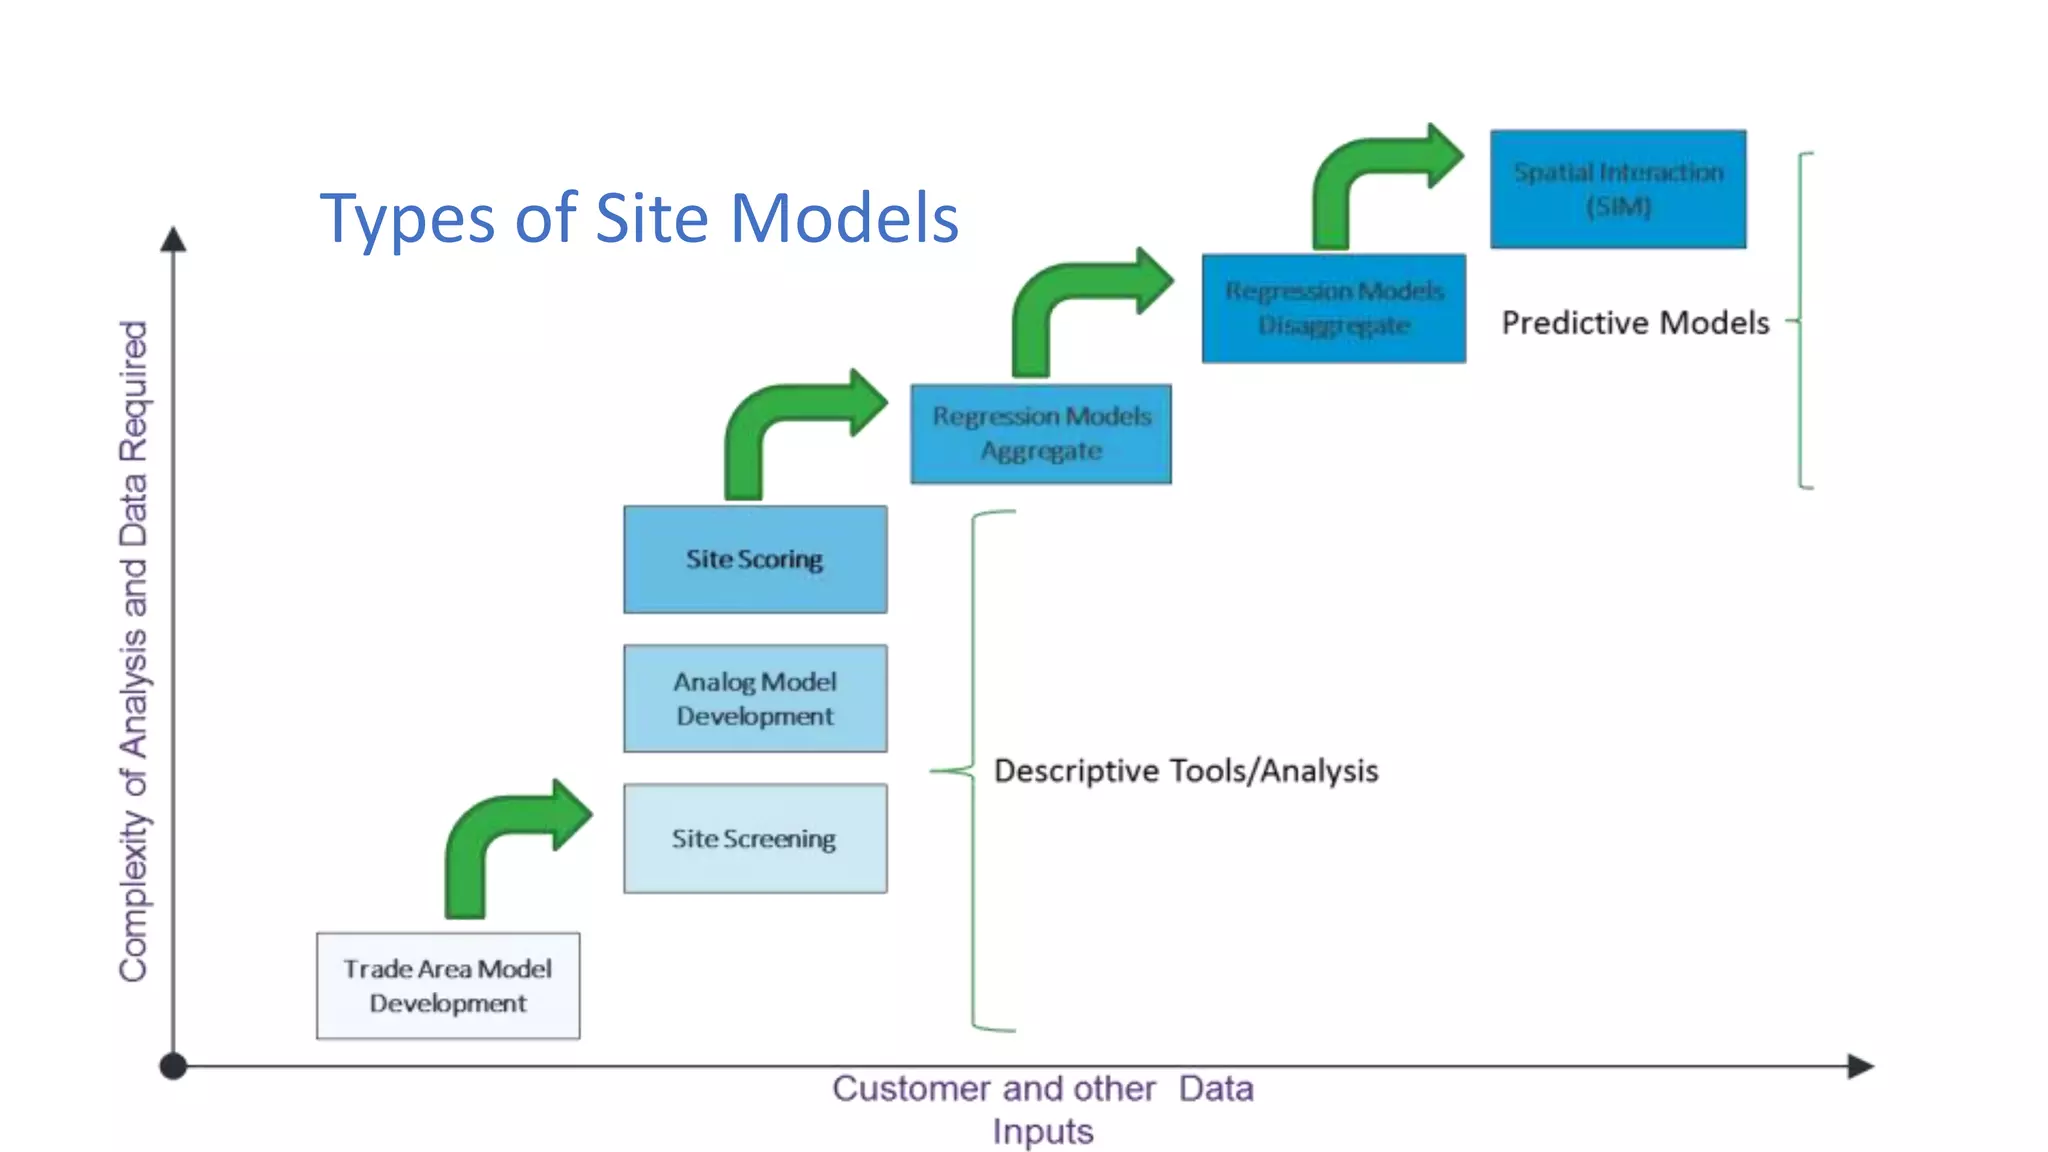
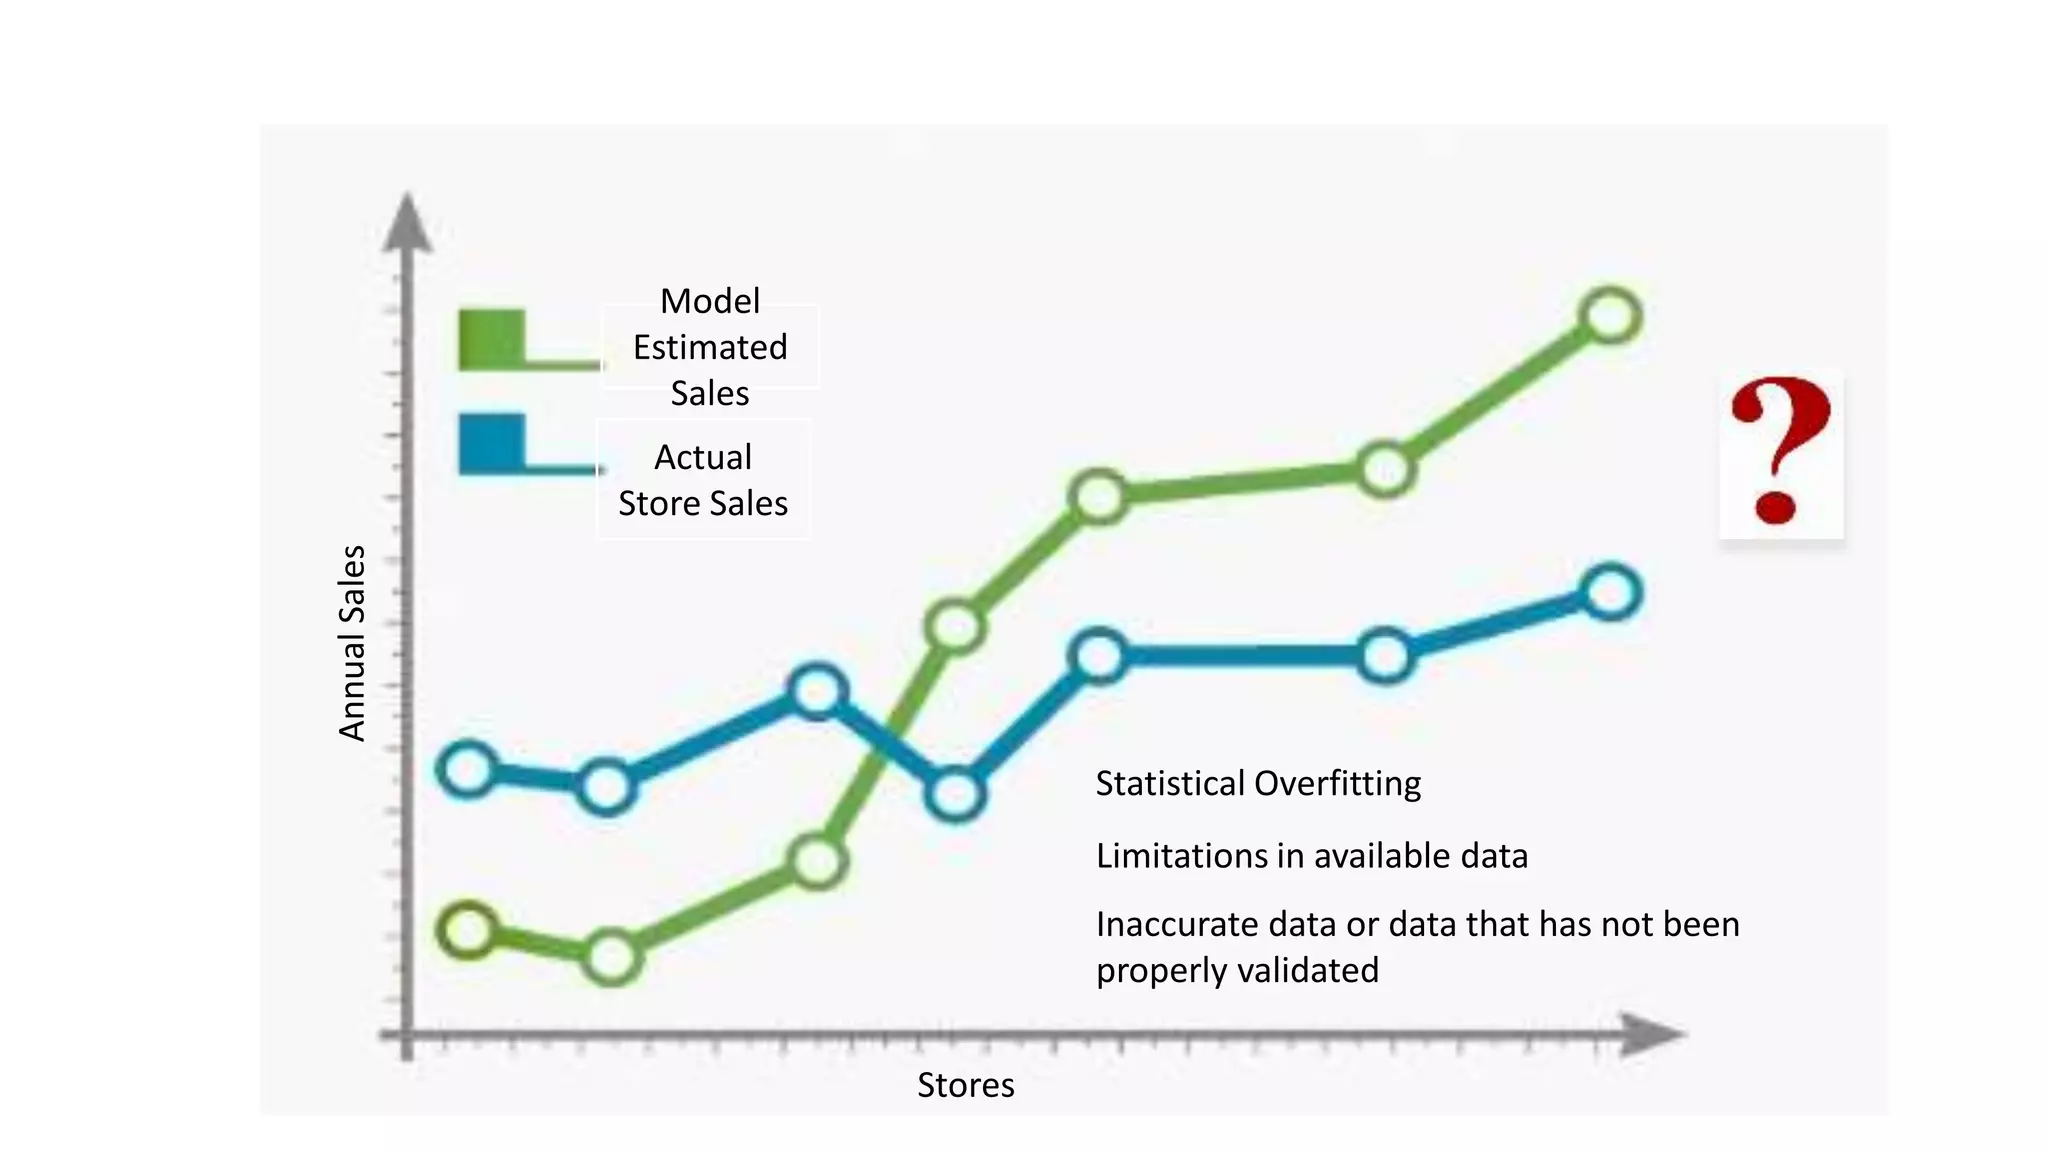


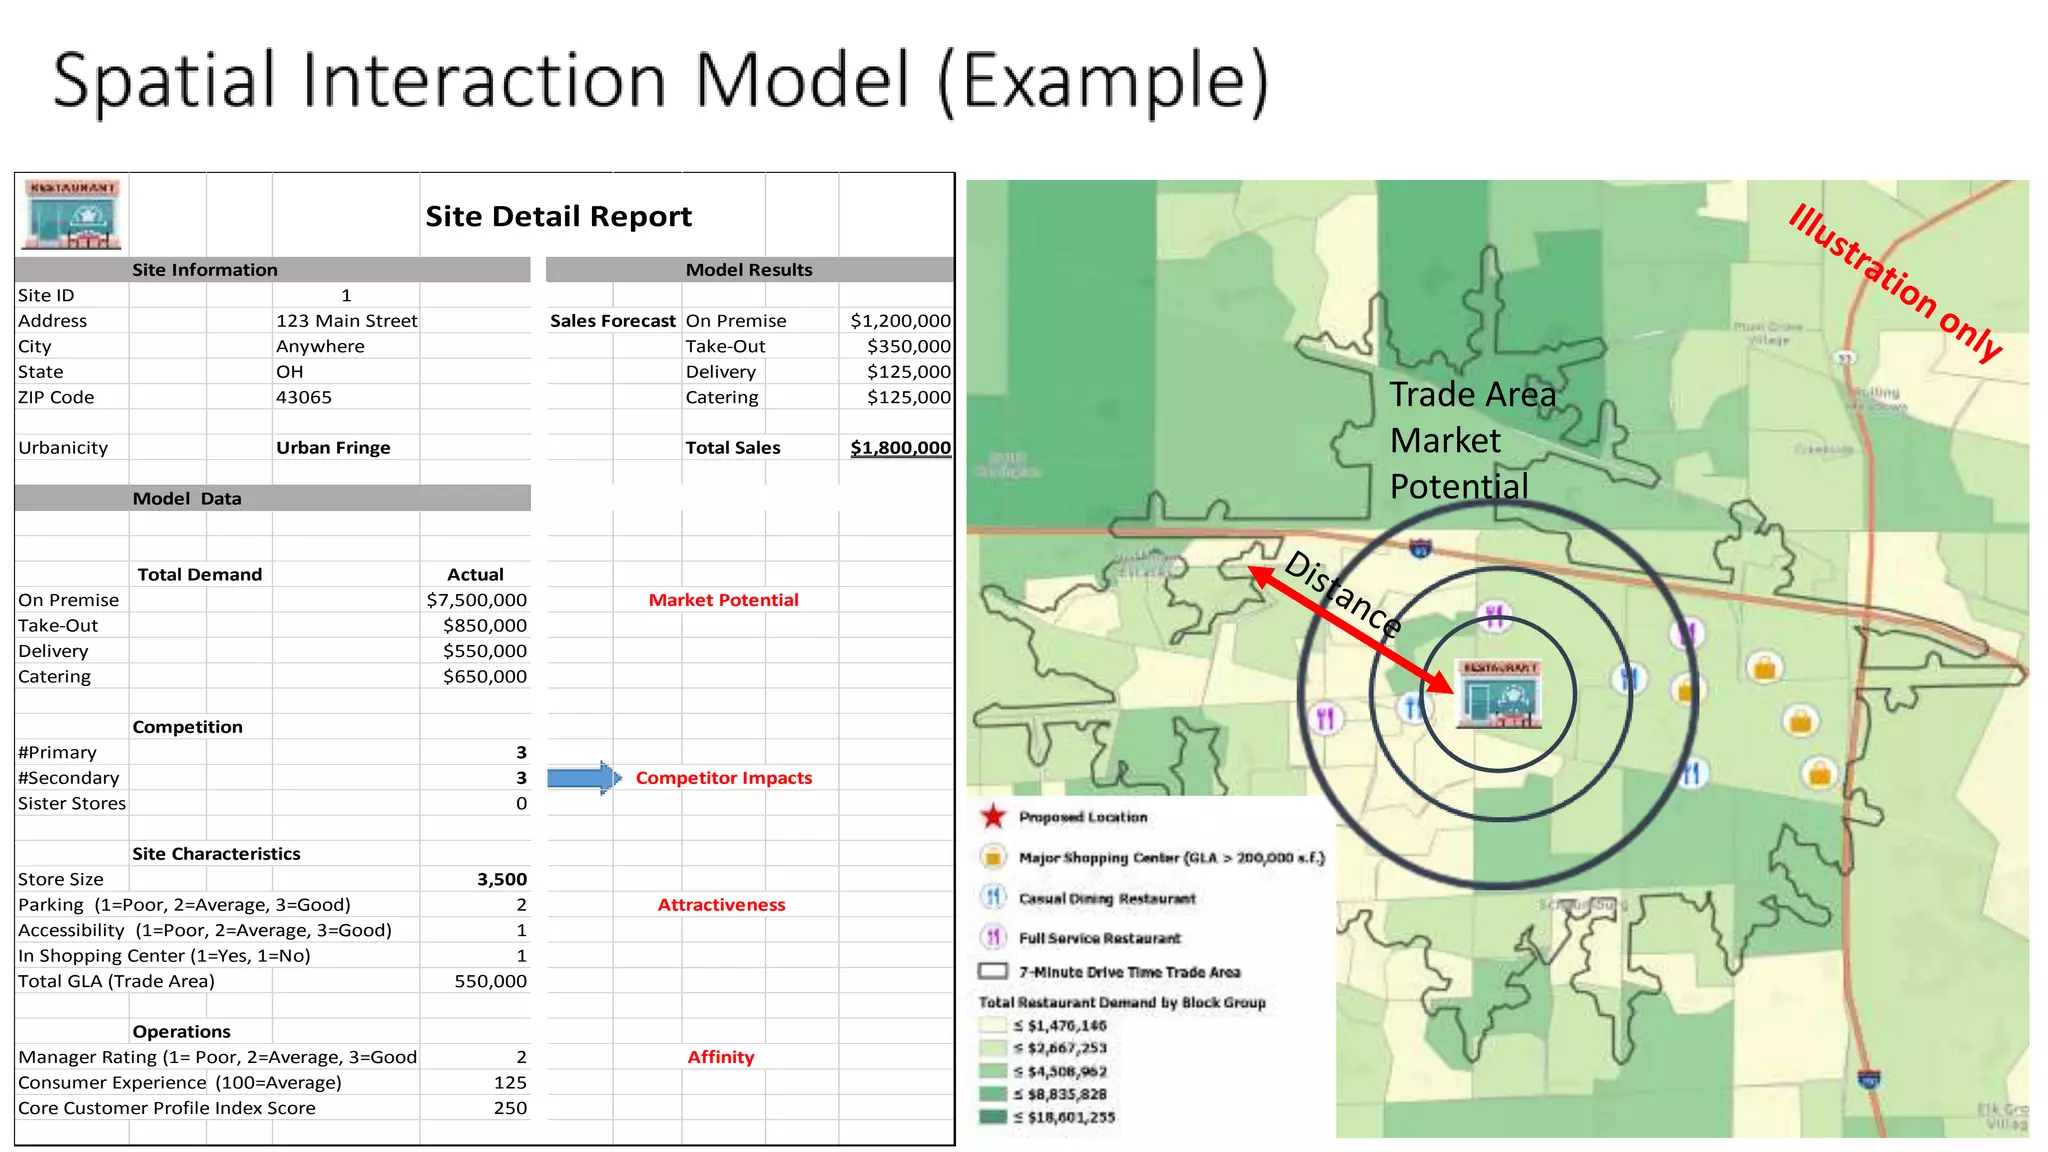

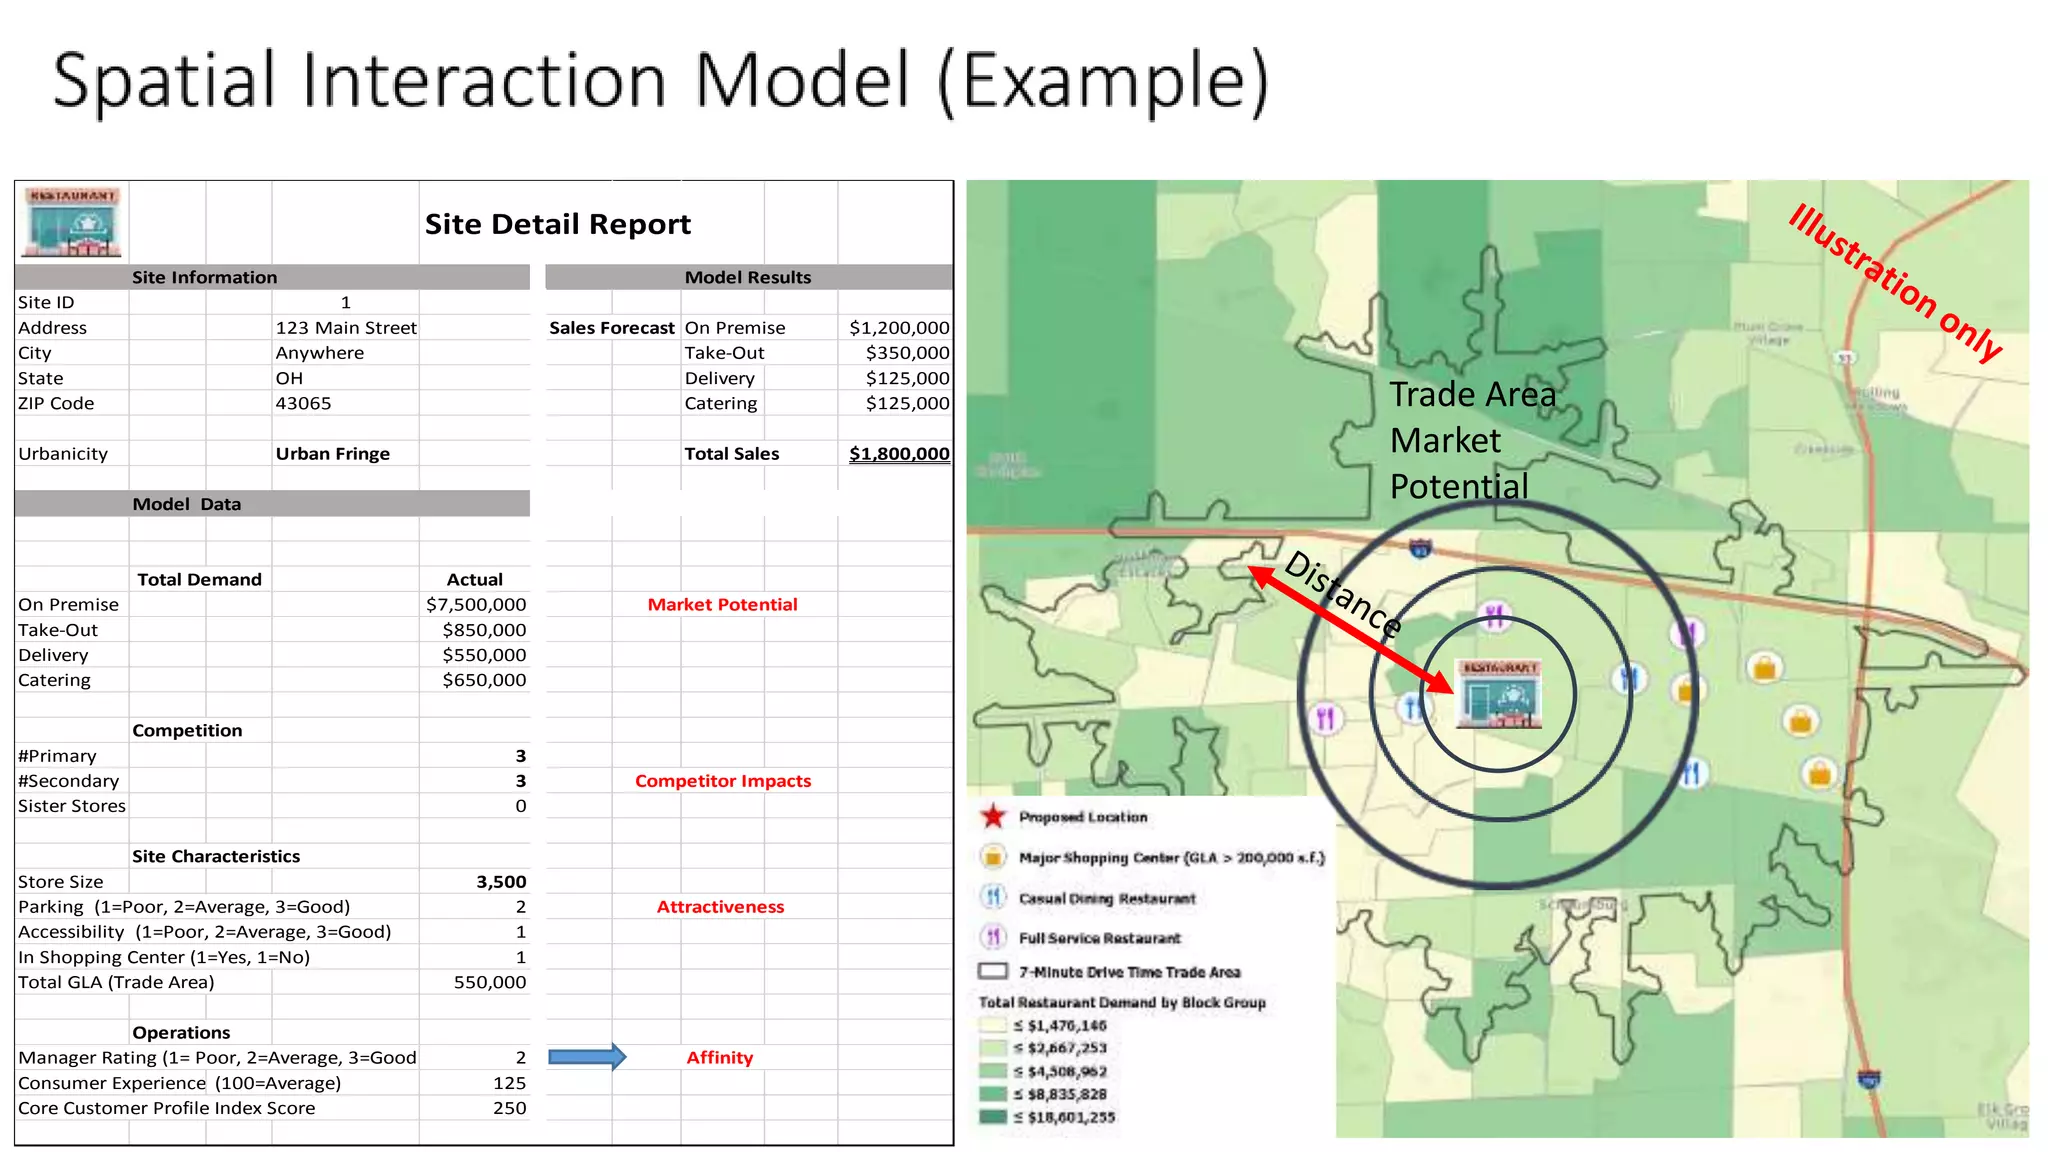
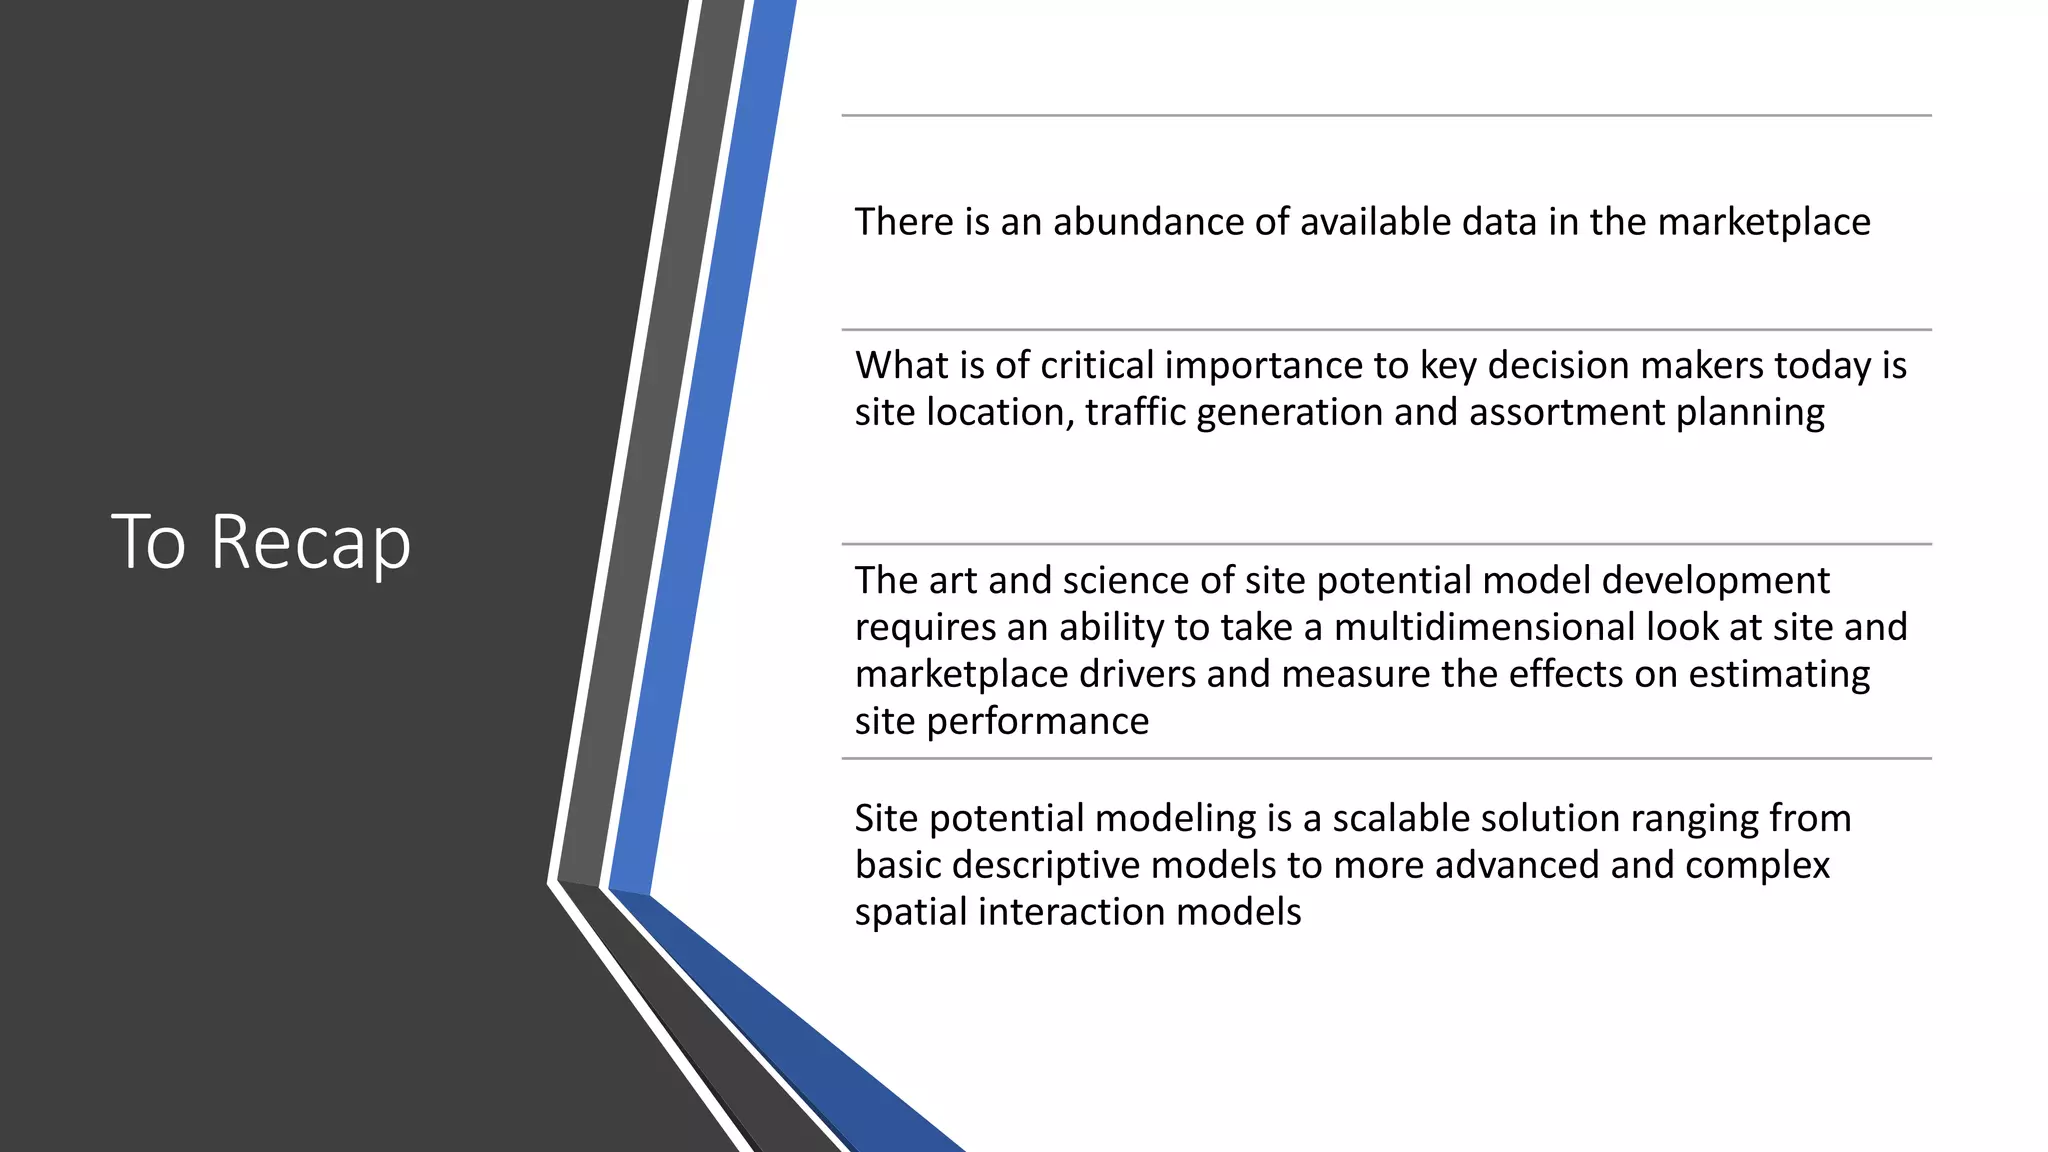


The document discusses the importance of location intelligence as a tool for retail performance management, highlighting various data sources and strategies to improve insights and site modeling. It emphasizes understanding customer demographics, trade area analysis, and the potential of spatial interaction models for predicting store performance and customer behavior. The agenda includes examining new data trends, challenges in retail, and approaches to making informed decisions about site locations and market opportunities.


