Download to read offline


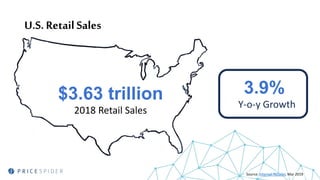
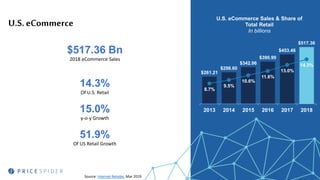
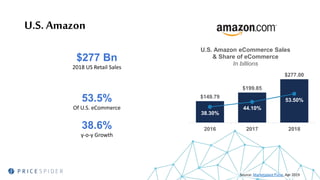


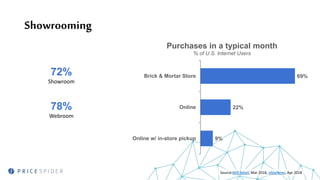


The document discusses the significant growth of U.S. ecommerce, highlighting a $517.36 billion sales figure in 2018, accounting for 14.3% of total retail sales. It emphasizes the dominance of major players like Amazon, which represents 53.5% of U.S. ecommerce, and notes trends such as showrooming and omnichannel strategies in retail. Overall, the report reflects on the ongoing evolution of digital retail, the impact of major market players, and the need for innovative approaches in customer experience.


