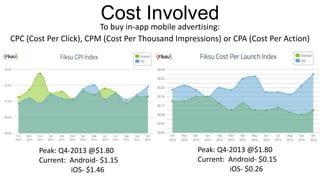
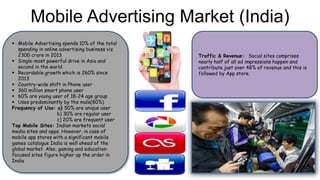
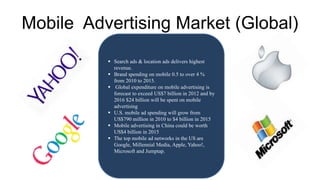
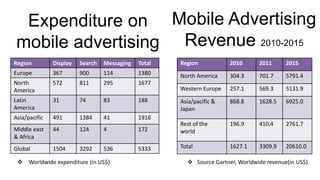
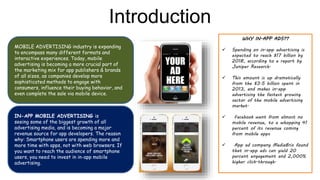
MOBILE ADVERTISING
Presented By:
Deepak Yadav, Diptesh Saha, Kundan Ganvir, Preeya Yadav
Raj Brahmbhatt, Tanya Bhatt (NIFT-MUMBAI)
“Someday we may live in a world where ads aren’t
pesky, interruptive distractions.”
Introduction
IN-APP MOBILE ADVERTISING is
seeing some of the biggest growth of all
advertising media, and is becoming a major
revenue source for app developers. The reason
why: Smartphone users are spending more and
more time with apps, not with web browsers. If
you want to reach the audience of smartphone
users, you need to invest in in-app mobile
advertising.
MOBILE ADVERTISING industry is expanding
to encompass many different formats and
interactive experiences. Today, mobile
advertising is becoming a more crucial part of
the marketing mix for app publishers & brands
of all sizes, as companies develop more
sophisticated methods to engage with
consumers, influence their buying behavior, and
even complete the sale via mobile device.
WHY IN-APP ADS??
 Spending on in-app advertising is
expected to reach $17 billion by
2018, according to a report by
Juniper Research.
 This amount is up dramatically
from the $3.5 billion spent in
2013, and makes in-app
advertising the fastest growing
sector of the mobile advertising
market.
 Facebook went from almost no
mobile revenue, to a whopping 41
percent of its revenue coming
from mobile apps
 App ad company MediaBrix found
that in-app ads can yield 20
percent engagement and 2,000%
higher click-through.
Fashion and Mobile Advertising
Advertising Methods
In-App Advertisement:
1. Through pop ups in various apps
2. Through specific apps
Text Messages E- mail Advertising In-App Advertising
Luxury Brands and App
Advertisements
 Gucci has extended its mobile application interface for
communicating with high-end consumers and offer them
highly interactive content.
 Giorgio Armani: the company applied its mobile
advertising on January 2013 on Vanity Fair Web Site.
Chanel eyes fashion-conscious women with fragrance
mobile ad.
Benefits of In-App Advertising:
 Establish better connection with consumers
 Enhances Experience of consumers
 Help reach the target customer segment
 Increasing number of technology savvy people
[increased use of smart phones]
 Grabs instant attention
Cost Involved
To buy in-app mobile advertising:
CPC (Cost Per Click), CPM (Cost Per Thousand Impressions) or CPA (Cost Per Action)
Peak: Q4-2013 @$1.80
Current: Android- $1.15
iOS- $1.46
Peak: Q4-2013 @$1.80
Current: Android- $0.15
iOS- $0.26
Mobile Advertising Market (India)
 Mobile Advertising spends 10% of the total
spending in online advertising business viz.
2300 crore in 2013
 Single-most powerful drive in Asia and
second in the world
 Recordable growth which is 260% since
2013
 Country-wide shift in Phone user
 360 million smart phone user
 60% are young user of 18-24 age group
 Uses predominantly by the male(80%)
Frequency of Use: a) 50% are unique user
b) 30% are regular user
c) 20% are frequent user
Top Mobile Sites: Indian markets social
media sites and apps. However, in case of
mobile app stores with a significant mobile
games catalogue India is well ahead of the
global market. Also, gaming and education-
focused sites figure higher up the order in
India
Traffic & Revenue: Social sites comprises
nearly half of all ad impressions happen and
contribute just over 48% of revenue and this is
followed by App store.
Mobile Advertising Market (Global)
 Search ads & location ads delivers highest
revenue.
 Brand spending on mobile 0.5 to over 4 %
from 2010 to 2015.
 Global expenditure on mobile advertising is
forecast to exceed US$7 billion in 2012 and by
2016 $24 billion will be spent on mobile
advertising
 U.S. mobile ad spending will grow from
US$790 million in 2010 to $4 billion in 2015
 Mobile advertising in China could be worth
US$4 billion in 2015
 The top mobile ad networks in the US are
Google, Millennial Media, Apple, Yahoo!,
Microsoft and Jumptap.
Region Display Search Messaging Total
Europe 367 900 114 1380
North
America
572 811 295 1677
Latin
America
31 74 83 188
Asia/pacific 491 1384 41 1916
Middle east
& Africa
44 124 4 172
Global 1504 3292 536 5333
Expenditure on
mobile advertising
Region 2010 2011 2015
North America 304.3 701.7 5791.4
Western Europe 257.1 569.3 5131.9
Asia/pacific &
Japan
868.8 1628.5 6925.0
Rest of the
world
196.9 410.4 2761.7
Total 1627.1 3309.9 20610.0
Mobile Advertising
Revenue 2010-2015
 Source Gartner, Worldwide revenue(in US$) Worldwide expenditure (in US$)
Success factors of App Advertising
• Entertainment Factor
• Utility Factor
• Functionality Factor
• Maintenance Factor
• Usability Factor
Mobile Advertising

Mobile Advertising

  • 1.
    MOBILE ADVERTISING Presented By: DeepakYadav, Diptesh Saha, Kundan Ganvir, Preeya Yadav Raj Brahmbhatt, Tanya Bhatt (NIFT-MUMBAI)
  • 2.
    “Someday we maylive in a world where ads aren’t pesky, interruptive distractions.”
  • 3.
    Introduction IN-APP MOBILE ADVERTISINGis seeing some of the biggest growth of all advertising media, and is becoming a major revenue source for app developers. The reason why: Smartphone users are spending more and more time with apps, not with web browsers. If you want to reach the audience of smartphone users, you need to invest in in-app mobile advertising. MOBILE ADVERTISING industry is expanding to encompass many different formats and interactive experiences. Today, mobile advertising is becoming a more crucial part of the marketing mix for app publishers & brands of all sizes, as companies develop more sophisticated methods to engage with consumers, influence their buying behavior, and even complete the sale via mobile device. WHY IN-APP ADS??  Spending on in-app advertising is expected to reach $17 billion by 2018, according to a report by Juniper Research.  This amount is up dramatically from the $3.5 billion spent in 2013, and makes in-app advertising the fastest growing sector of the mobile advertising market.  Facebook went from almost no mobile revenue, to a whopping 41 percent of its revenue coming from mobile apps  App ad company MediaBrix found that in-app ads can yield 20 percent engagement and 2,000% higher click-through.
  • 4.
    Fashion and MobileAdvertising Advertising Methods In-App Advertisement: 1. Through pop ups in various apps 2. Through specific apps Text Messages E- mail Advertising In-App Advertising
  • 5.
    Luxury Brands andApp Advertisements  Gucci has extended its mobile application interface for communicating with high-end consumers and offer them highly interactive content.  Giorgio Armani: the company applied its mobile advertising on January 2013 on Vanity Fair Web Site. Chanel eyes fashion-conscious women with fragrance mobile ad. Benefits of In-App Advertising:  Establish better connection with consumers  Enhances Experience of consumers  Help reach the target customer segment  Increasing number of technology savvy people [increased use of smart phones]  Grabs instant attention
  • 6.
    Cost Involved To buyin-app mobile advertising: CPC (Cost Per Click), CPM (Cost Per Thousand Impressions) or CPA (Cost Per Action) Peak: Q4-2013 @$1.80 Current: Android- $1.15 iOS- $1.46 Peak: Q4-2013 @$1.80 Current: Android- $0.15 iOS- $0.26
  • 7.
    Mobile Advertising Market(India)  Mobile Advertising spends 10% of the total spending in online advertising business viz. 2300 crore in 2013  Single-most powerful drive in Asia and second in the world  Recordable growth which is 260% since 2013  Country-wide shift in Phone user  360 million smart phone user  60% are young user of 18-24 age group  Uses predominantly by the male(80%) Frequency of Use: a) 50% are unique user b) 30% are regular user c) 20% are frequent user Top Mobile Sites: Indian markets social media sites and apps. However, in case of mobile app stores with a significant mobile games catalogue India is well ahead of the global market. Also, gaming and education- focused sites figure higher up the order in India Traffic & Revenue: Social sites comprises nearly half of all ad impressions happen and contribute just over 48% of revenue and this is followed by App store.
  • 8.
    Mobile Advertising Market(Global)  Search ads & location ads delivers highest revenue.  Brand spending on mobile 0.5 to over 4 % from 2010 to 2015.  Global expenditure on mobile advertising is forecast to exceed US$7 billion in 2012 and by 2016 $24 billion will be spent on mobile advertising  U.S. mobile ad spending will grow from US$790 million in 2010 to $4 billion in 2015  Mobile advertising in China could be worth US$4 billion in 2015  The top mobile ad networks in the US are Google, Millennial Media, Apple, Yahoo!, Microsoft and Jumptap.
  • 9.
    Region Display SearchMessaging Total Europe 367 900 114 1380 North America 572 811 295 1677 Latin America 31 74 83 188 Asia/pacific 491 1384 41 1916 Middle east & Africa 44 124 4 172 Global 1504 3292 536 5333 Expenditure on mobile advertising Region 2010 2011 2015 North America 304.3 701.7 5791.4 Western Europe 257.1 569.3 5131.9 Asia/pacific & Japan 868.8 1628.5 6925.0 Rest of the world 196.9 410.4 2761.7 Total 1627.1 3309.9 20610.0 Mobile Advertising Revenue 2010-2015  Source Gartner, Worldwide revenue(in US$) Worldwide expenditure (in US$)
  • 10.
    Success factors ofApp Advertising • Entertainment Factor • Utility Factor • Functionality Factor • Maintenance Factor • Usability Factor

Editor's Notes

  • #4 Mobile advertising, to put it simply, is where the money is.
  • #7 CPA (cost per action – for example, you only have to pay each time a new customer downloads, subscribes or buys from you). CPM' The price of 1,000 advertisement impressions on one webpage. If a website publisher charges $2 CPM, that means an advertiser must pay $2 for every 1,000 impressions of its ad. The "M" in CPM represents the roman numeral for 1,000. The Cost per App Launch Index, which tracks the cost of each repeat app launch over time