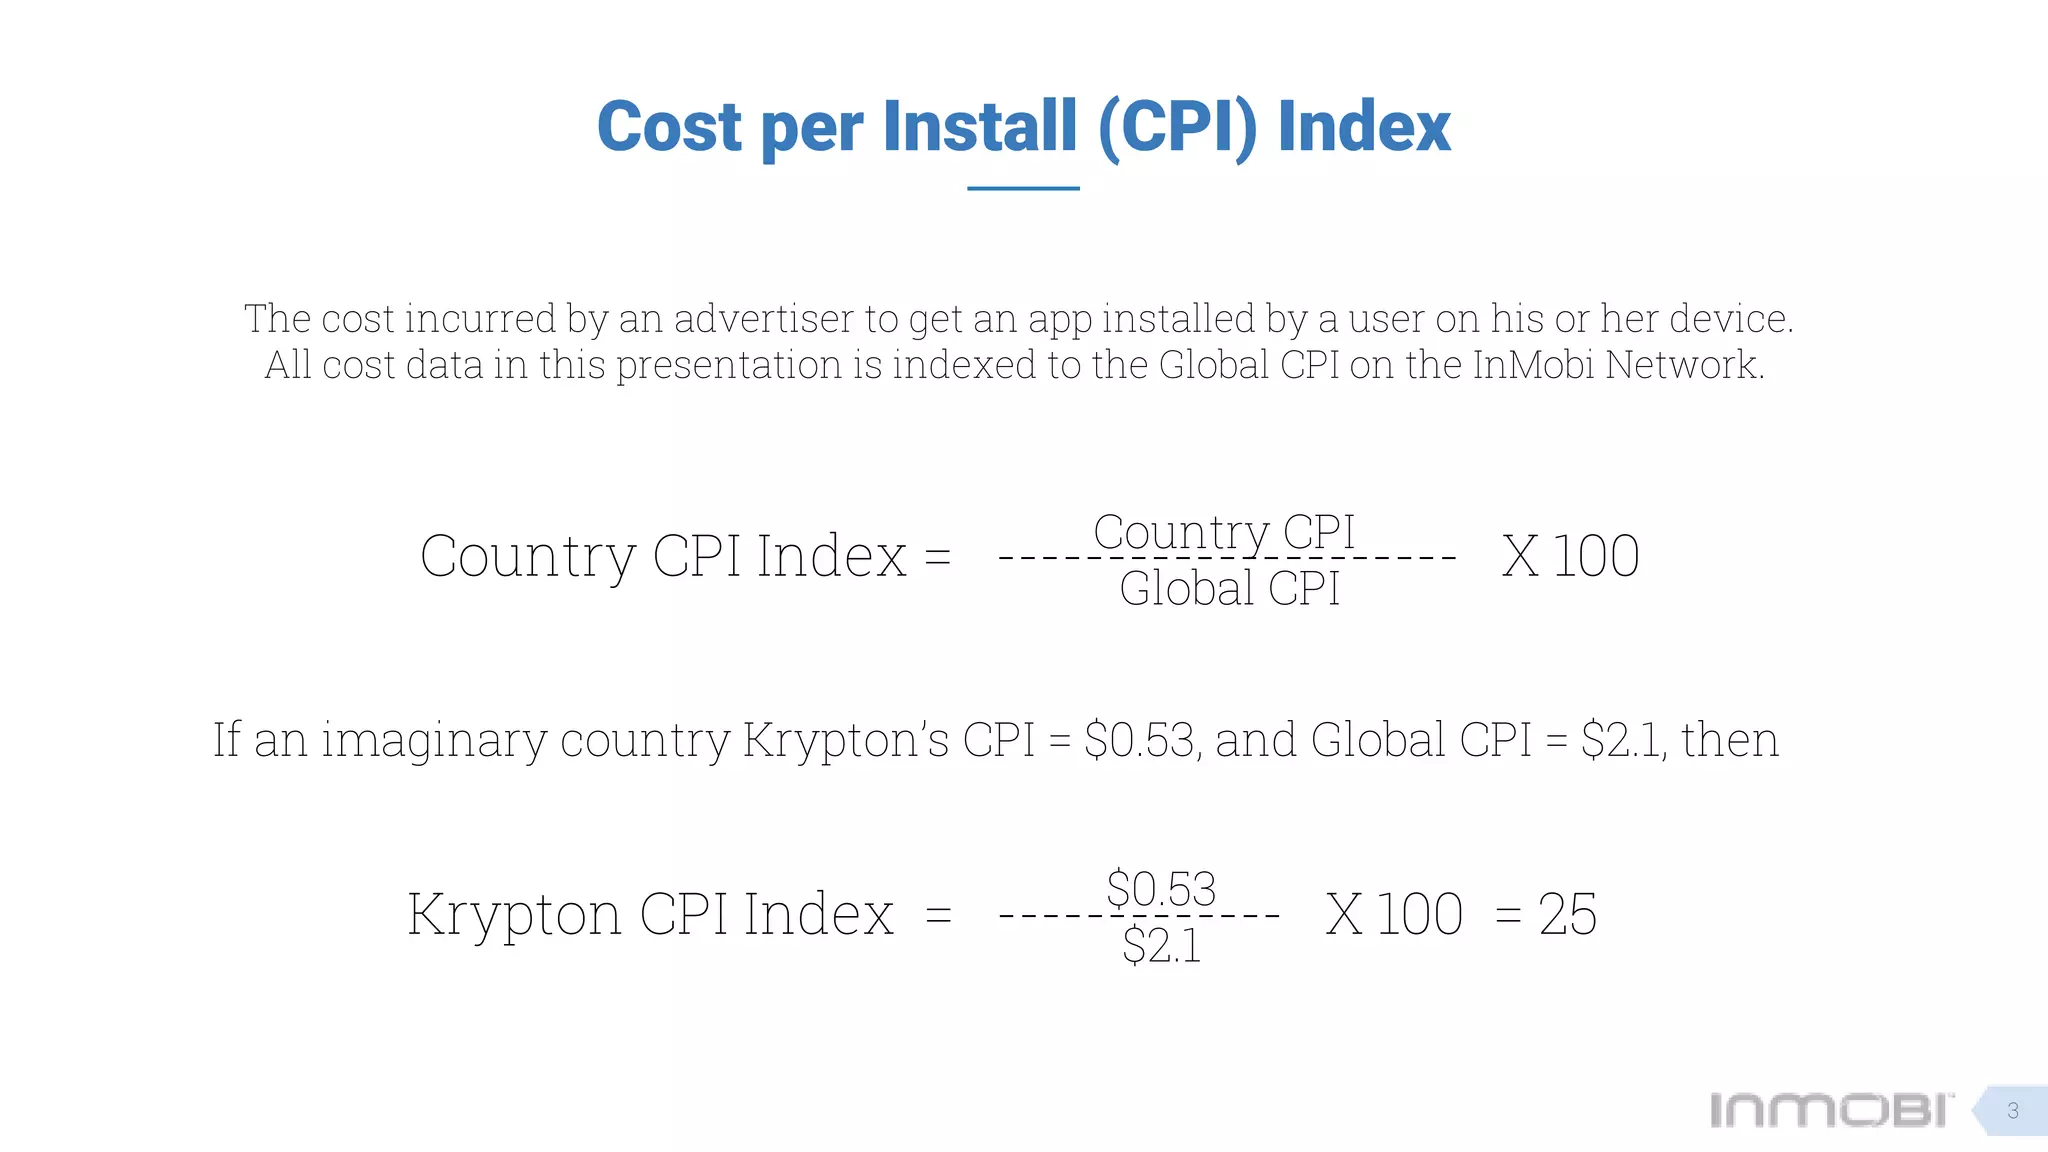
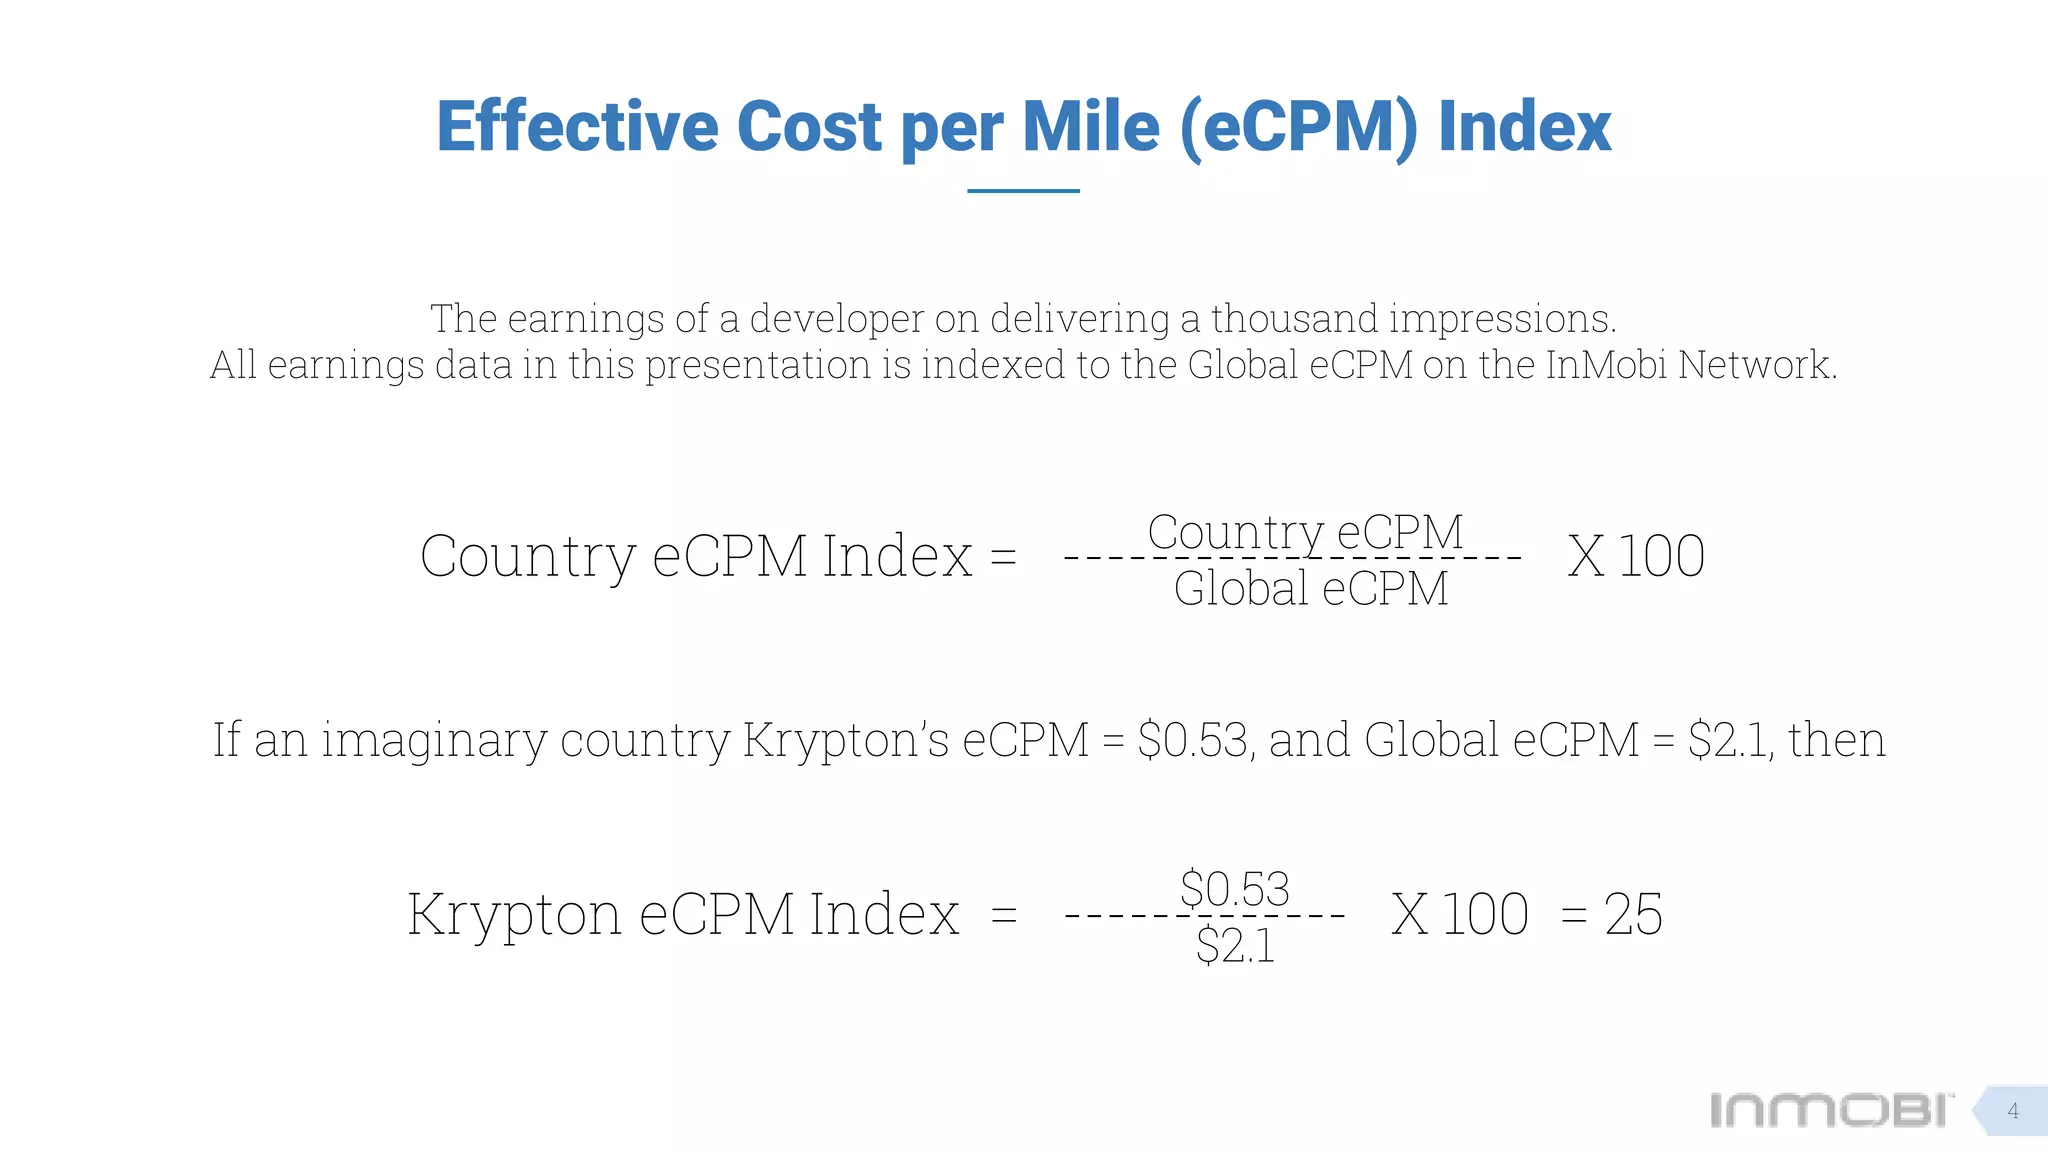
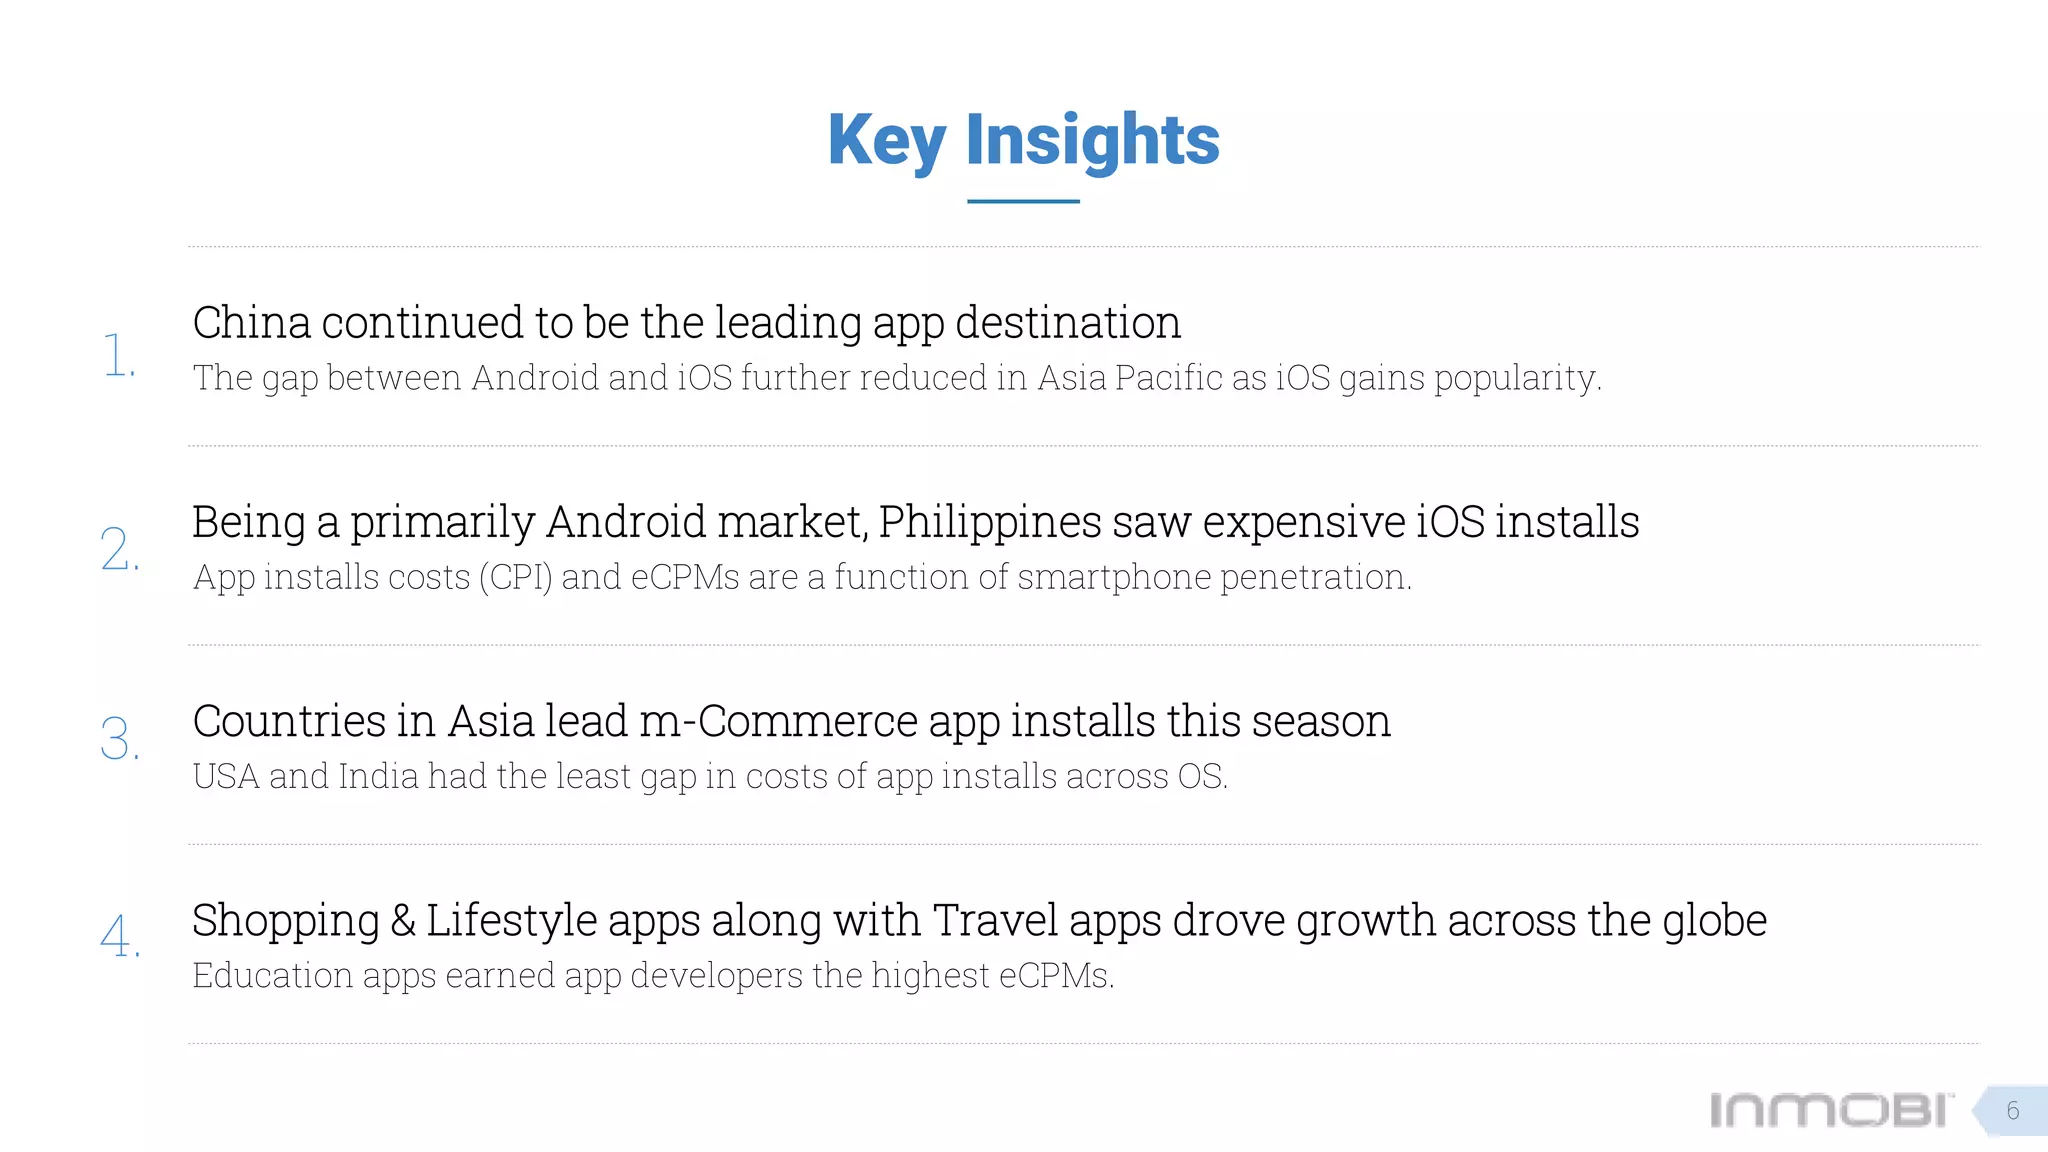
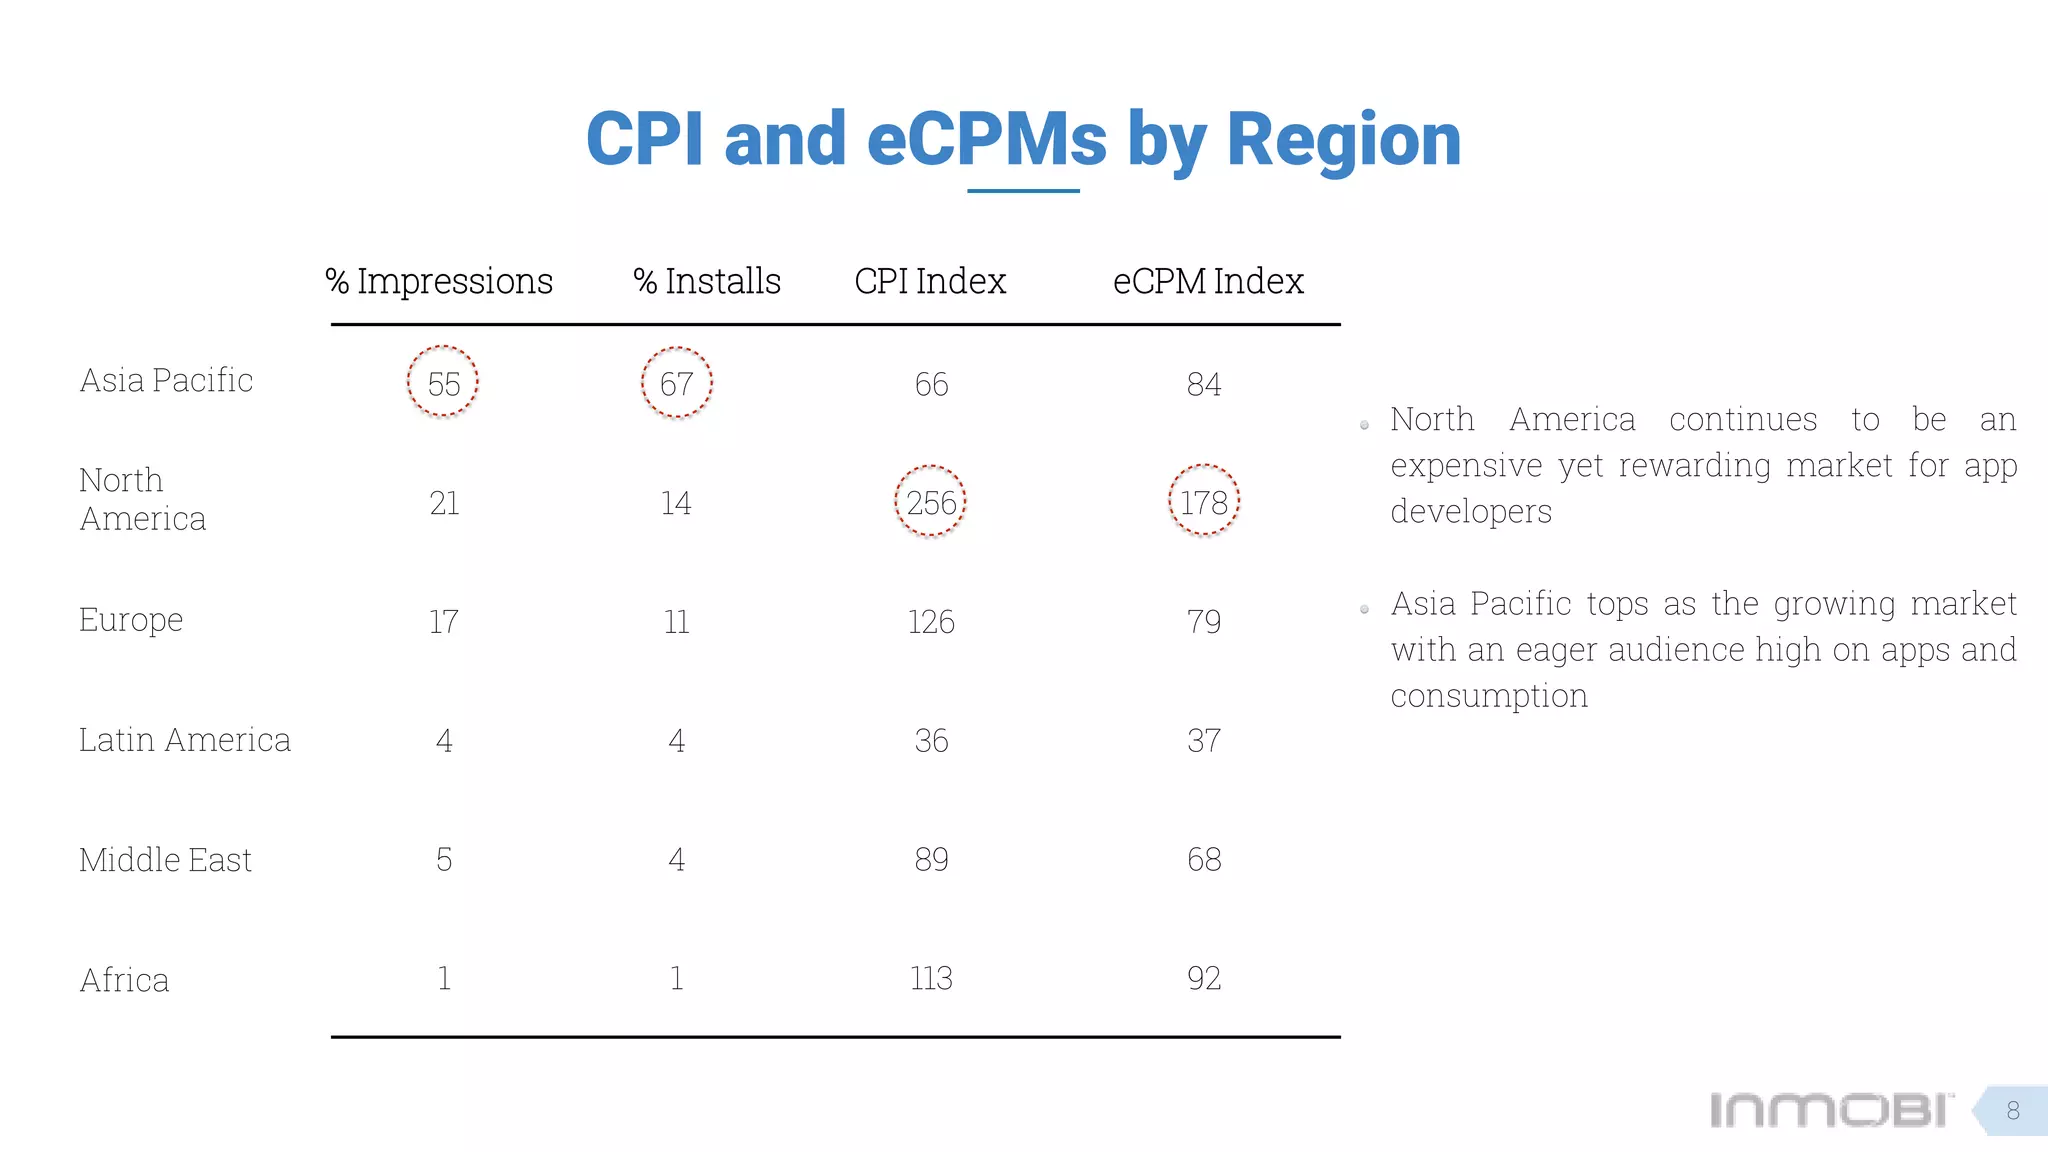
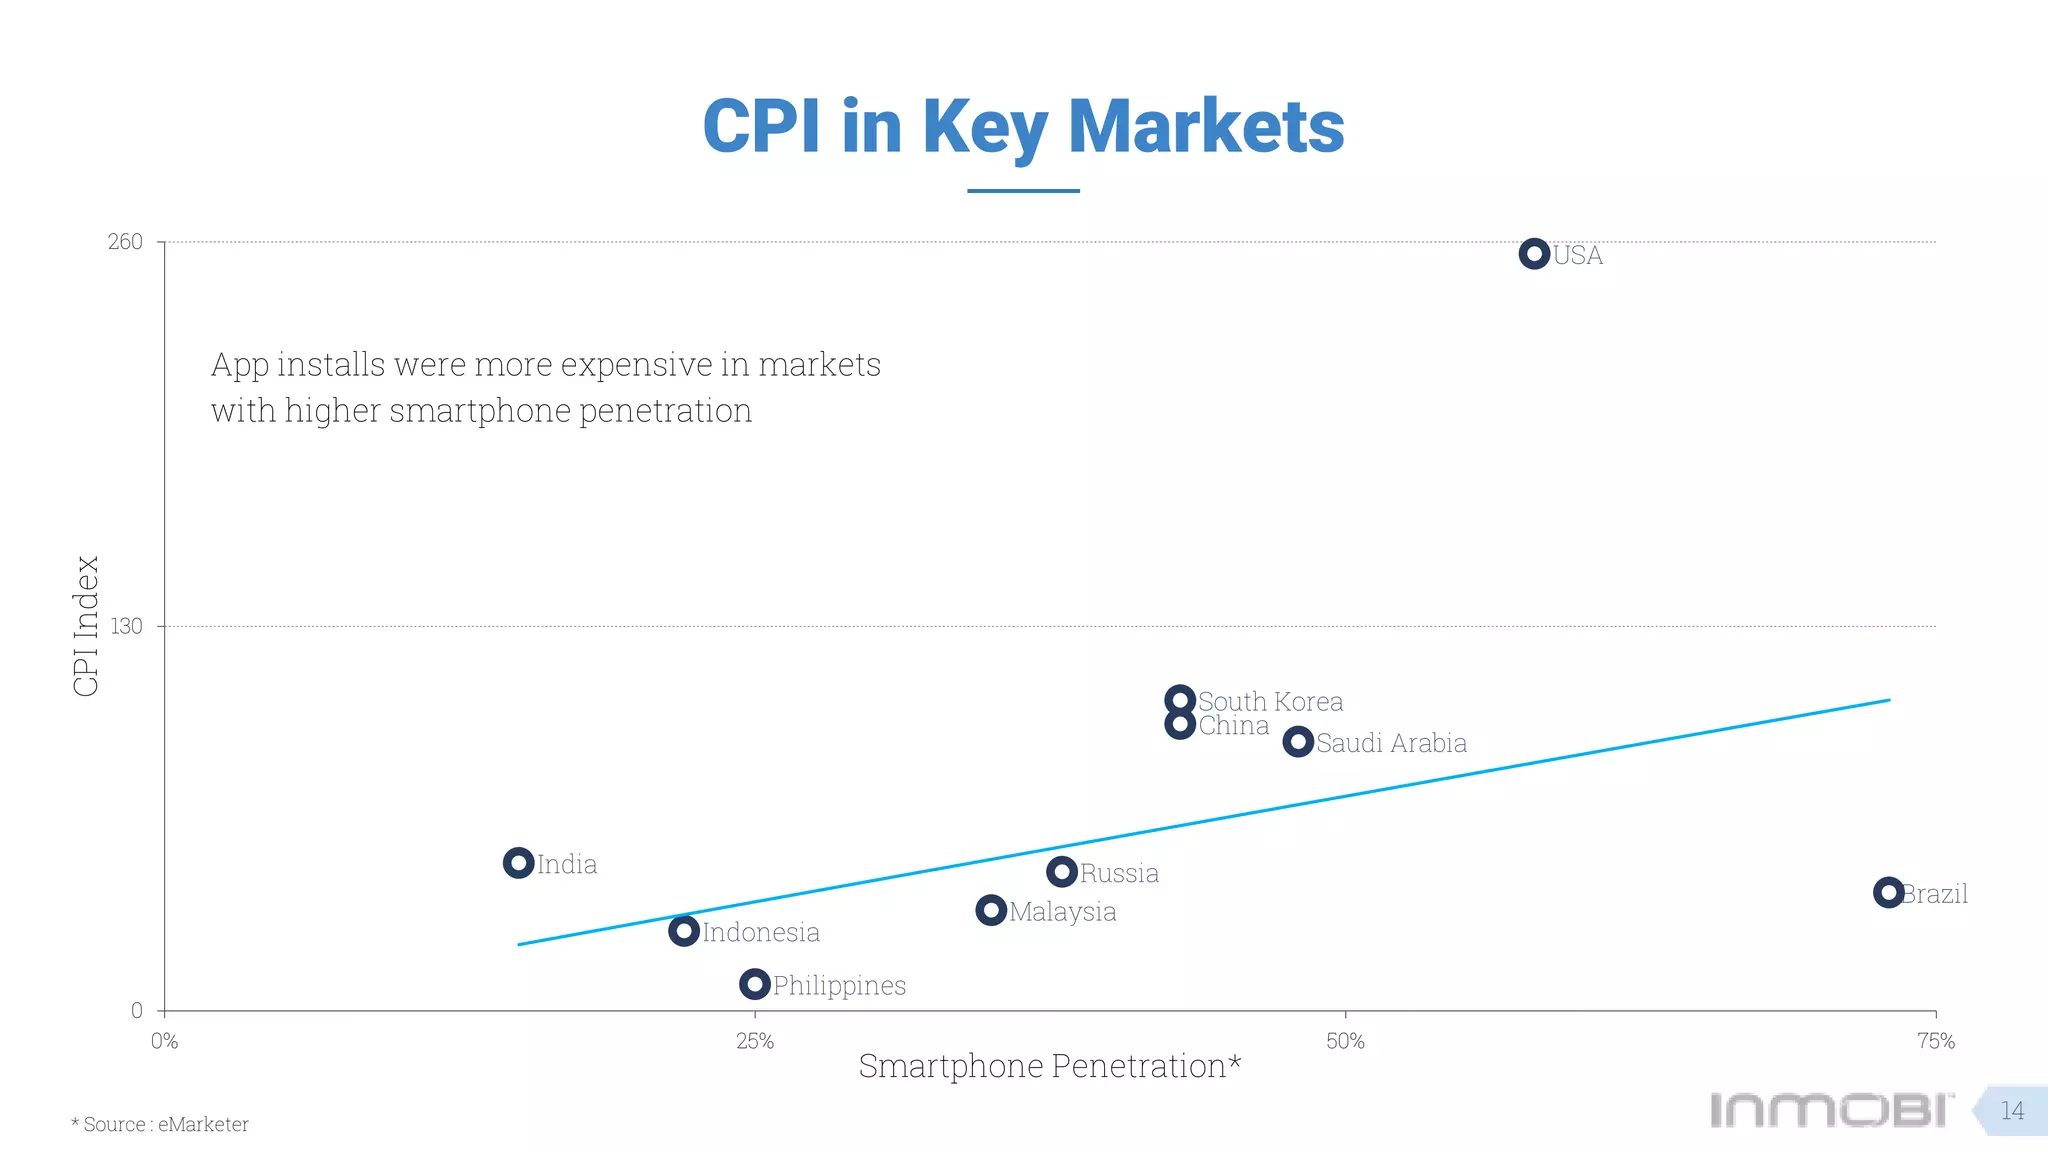
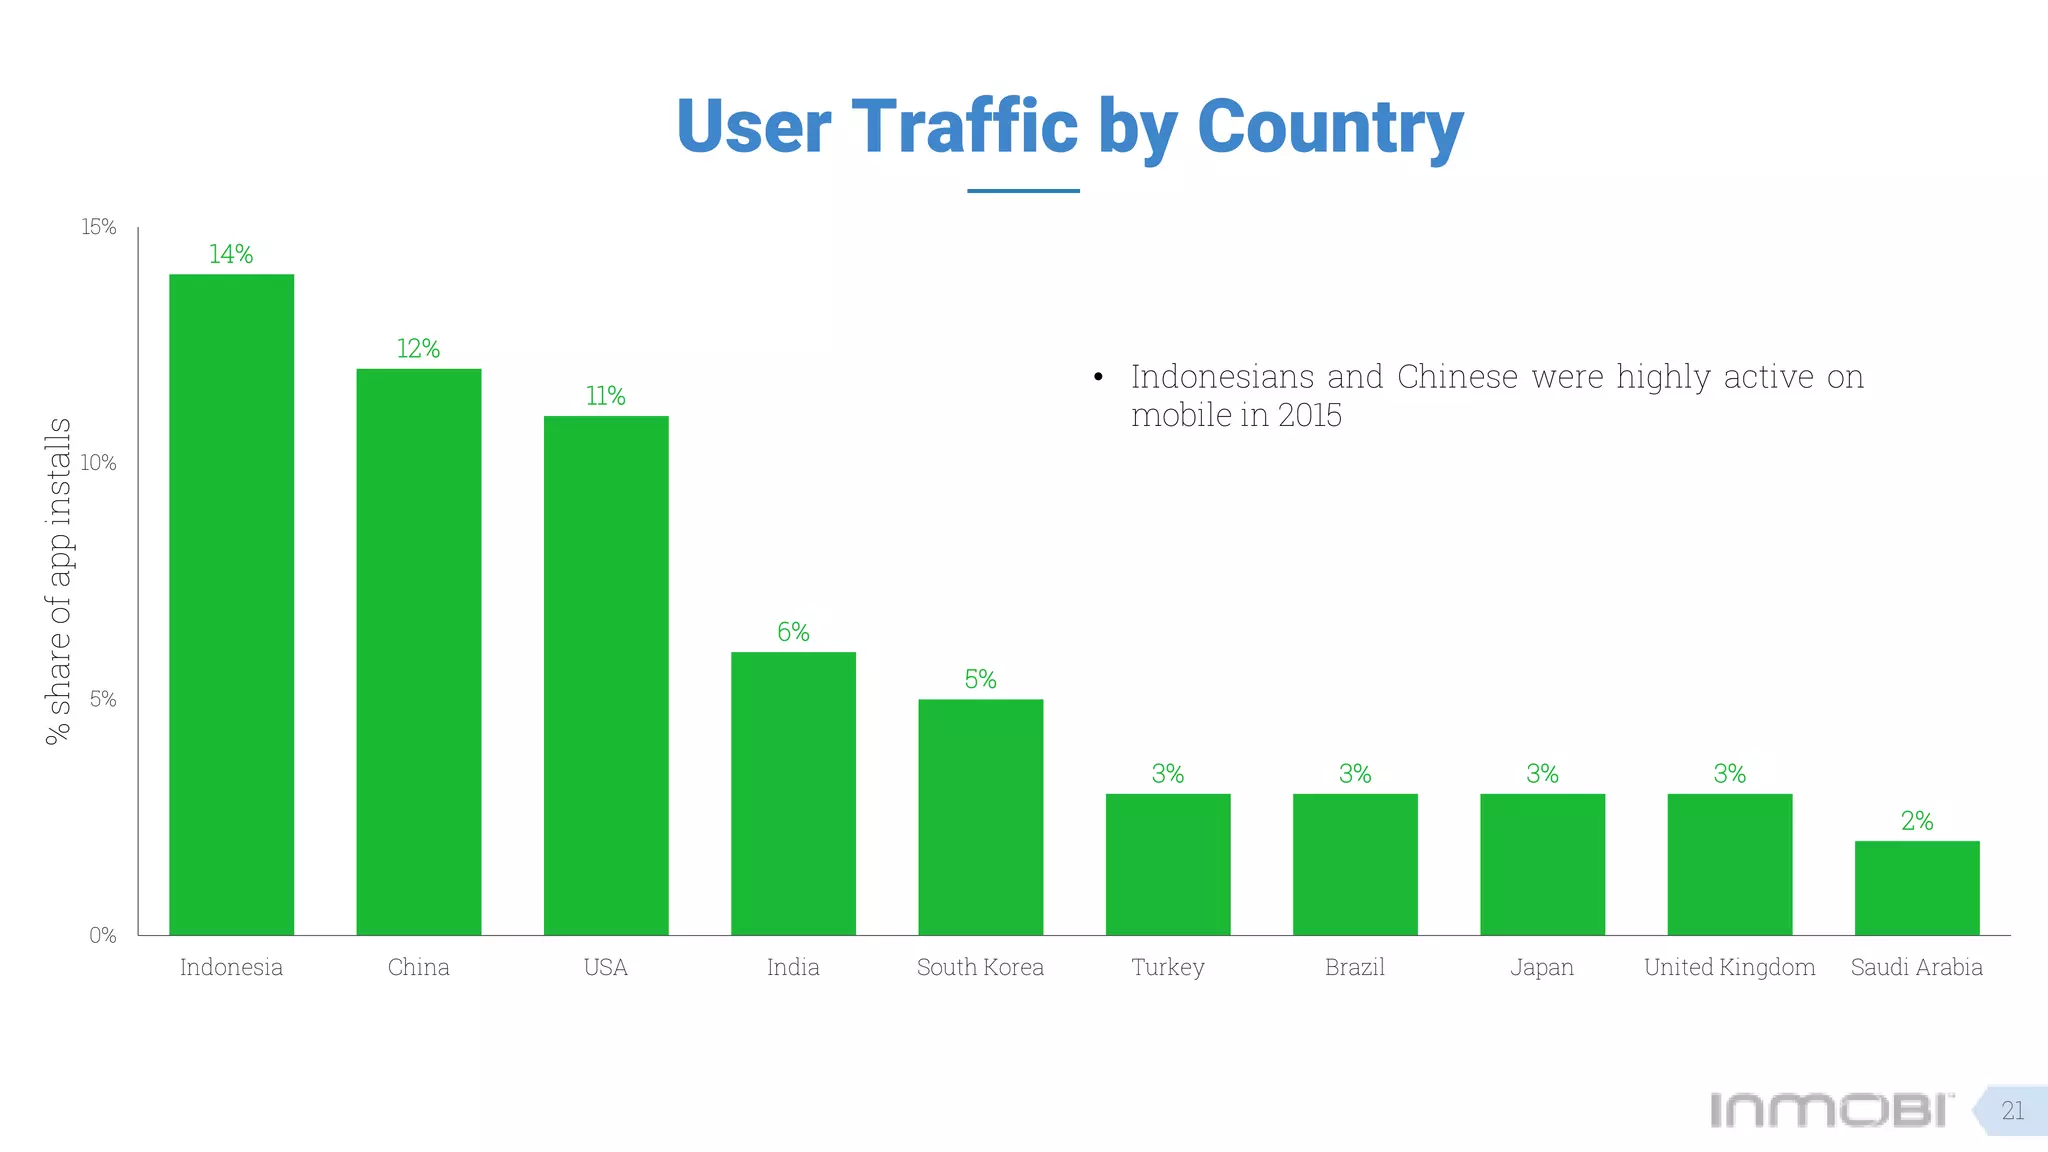
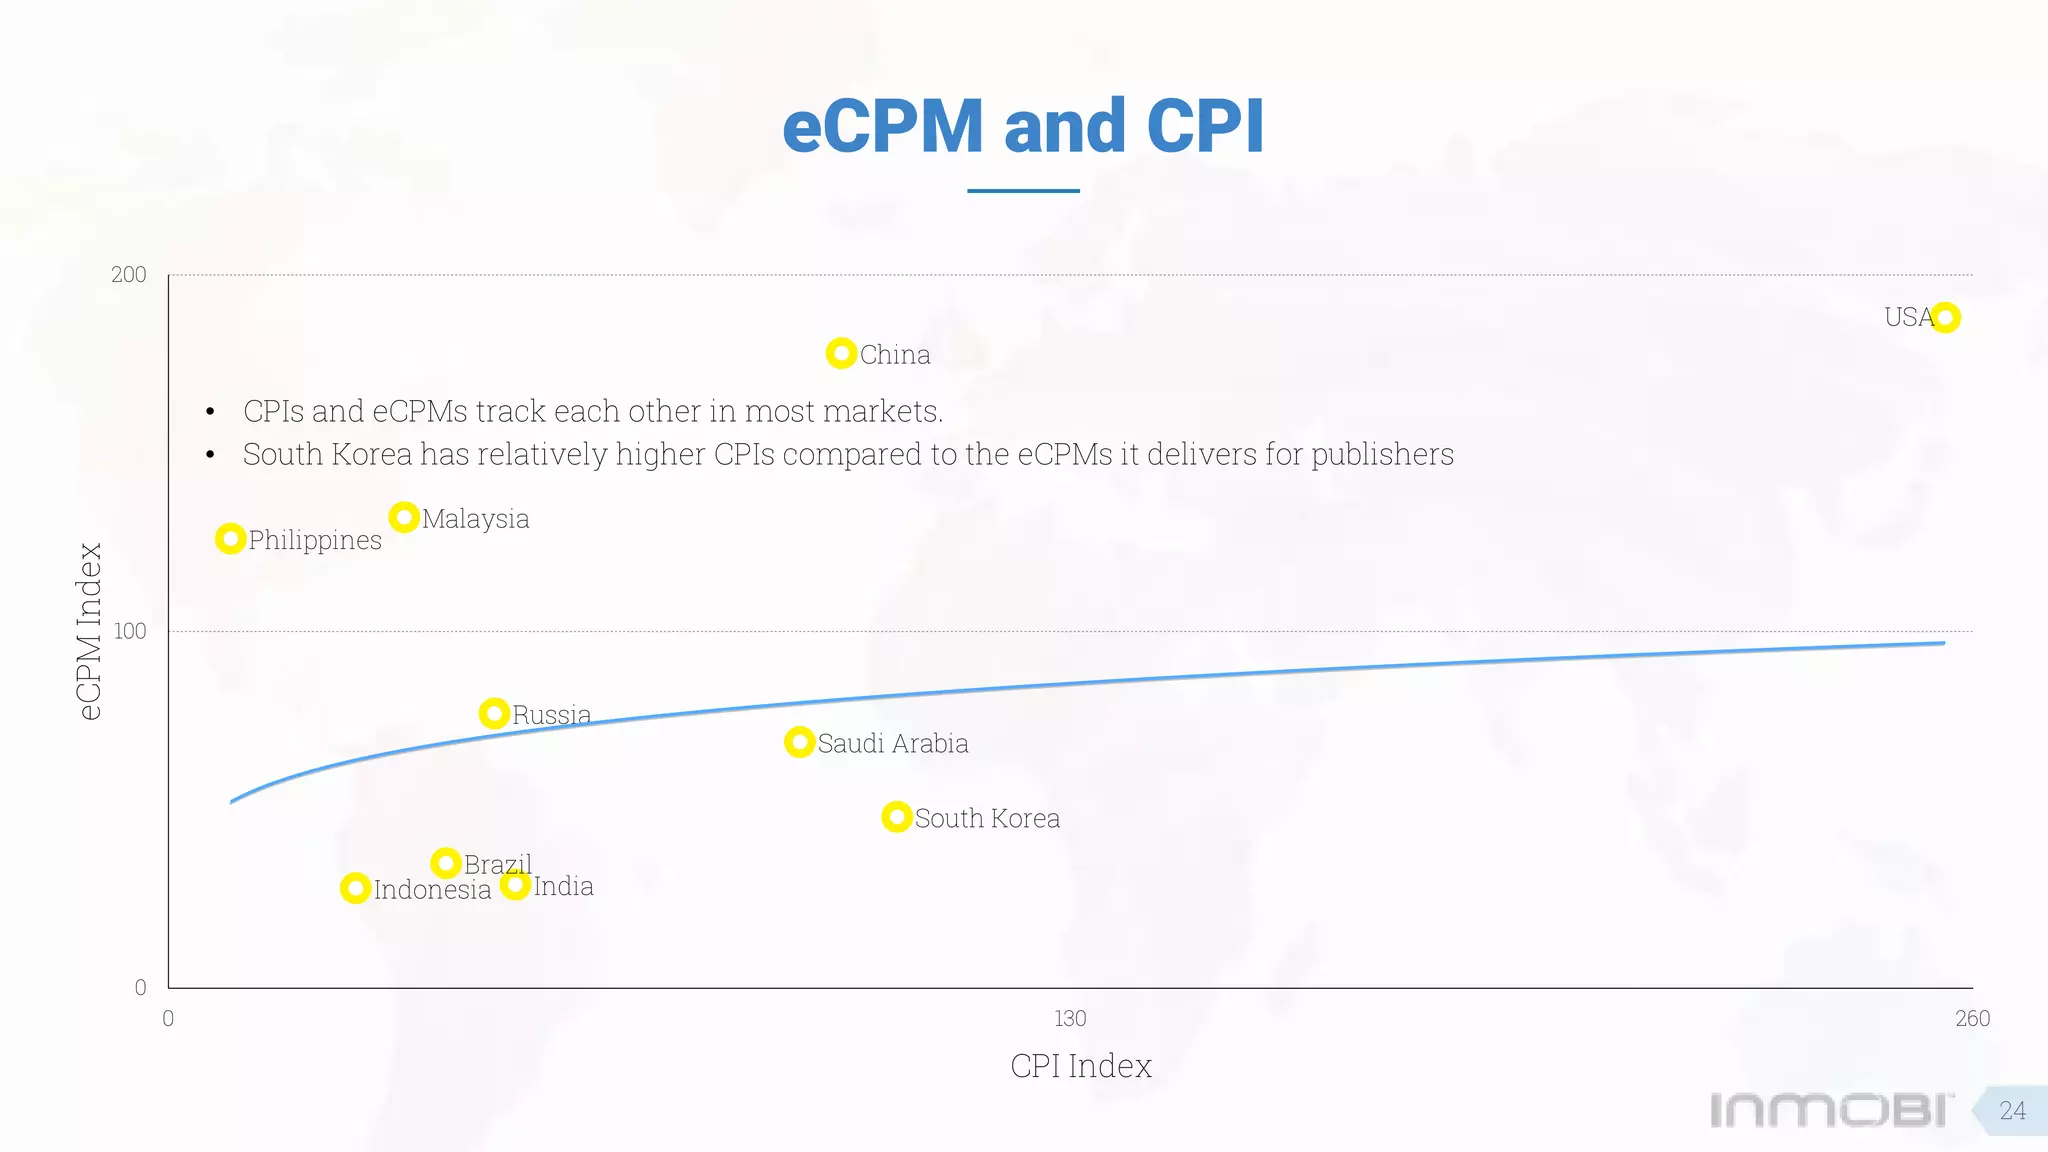
The State of App Downloads and Monetization
InMobi Insights Page
Global | February 2016
Table of Contents
Insights
Key Metrics by Region and OS
App Installs - Deep Dive
App Monetization - Deep Dive
1
2
3
4
Cost per Install (CPI) Index
The cost incurred by an advertiser to get an app installed by a user on his or her device.
All cost data in this presentation is indexed to the Global CPI on the InMobi Network.
Country CPI Index = --------------------- X 100Country CPI
Global CPI
If an imaginary country Krypton’s CPI = $0.53, and Global CPI = $2.1, then
Krypton CPI Index = ------------- X 100 = 25$0.53
$2.1
3
Effective Cost per Mile (eCPM) Index
The earnings of a developer on delivering a thousand impressions.
All earnings data in this presentation is indexed to the Global eCPM on the InMobi Network.
Country eCPM Index = --------------------- X 100Country eCPM
Global eCPM
If an imaginary country Krypton’s eCPM = $0.53, and Global eCPM = $2.1, then
Krypton eCPM Index = ------------- X 100 = 25$0.53
$2.1
4
Insights1
China continued to be the leading app destination
The gap between Android and iOS further reduced in Asia Pacific as iOS gains popularity.
Being a primarily Android market, Philippines saw expensive iOS installs
App installs costs (CPI) and eCPMs are a function of smartphone penetration.
Countries in Asia lead m-Commerce app installs this season
USA and India had the least gap in costs of app installs across OS.
Shopping & Lifestyle apps along with Travel apps drove growth across the globe
Education apps earned app developers the highest eCPMs.
1.
2.
3.
4.
Key Insights
6
CPI and eCPMs by Region
OS Share of Ad Impressions by Region
OS Share of Ad Installs by Region
CPI and eCPMs by OS
Key Metrics by Region and OS2
55 67 66 84
21 14 256 178
17 11 126 79
4 4 36 37
5 4 89 68
1 1 113 92
Asia Pacific
North
America
Europe
Latin America
Middle East
Africa
% Impressions eCPM Index% Installs CPI Index
North America continues to be an
expensive yet rewarding market for app
developers
Asia Pacific tops as the growing market
with an eager audience high on apps and
consumption
CPI and eCPMs by Region
8
OS Share of Ad Impressions by Region
Asia Pacific North America Europe Latin America Middle East Africa
iOS Android
59% 30%
67%
31%
90% 10% 63%
ShareofAdImpressions
Android has a near monopoly in app consumption across most markets given its large
install base.
9
39%
37%
48% 7%69%
Top App Installs Destinations
CPI in Key Markets
Per Capita Installs by Markets
Cost per Install by OS
iOS Premium Over Android
App Install by Category
Ranking m-Commerce installs by
Countries
App Installs - Deep Dive3
28%
15%
13%
9%
5% 5%
4%
3% 3%
2%
0%
7%
14%
21%
28%
35%
China Indonesia USA Philippines India Russia Malaysia Brazil South Korea Saudi Arabia
%shareofappinstalls
Top App Installs
Destinations
• China continued to be the leading app install destination as users amped us their mobile
use
13
CPI in Key Markets
China
Indonesia
USA
Philippines
India Russia
Malaysia
Brazil
South Korea
Saudi Arabia
0
130
260
0% 25% 50% 75%
CPIIndex
Smartphone Penetration*
* Source : eMarketer
14
App installs were more expensive in markets
with higher smartphone penetration
App Install by Category
56%
20%
9%
6%
4%
5%
Games
Shopping & Lifestyle
Travel
Social & Communication
Entertainment
Others
2015
18
• While Gaming continued to rank as the most popular category of app downloaded by users in 2015, Shopping & Lifestyle (m-
Commerce) and Travel apps drove growth across the globe.
User Traffic by Country
Leading Publisher Categories by eCPM
eCPM and Smartphone Penetration
eCPM and CPI
4 App Monetization - Deep Dive
14%
12%
11%
6%
5%
3% 3% 3% 3%
2%
0%
5%
10%
15%
Indonesia China USA India South Korea Turkey Brazil Japan United Kingdom Saudi Arabia
%shareofappinstalls
User Traffic by Country
• Indonesians and Chinese were highly active on
mobile in 2015
21
eCPM and CPI
China
Indonesia
USA
Philippines
India
Russia
Malaysia
Brazil
South Korea
Saudi Arabia
0
100
200
0 130 260
eCPMIndex
CPI Index
• CPIs and eCPMs track each other in most markets.
• South Korea has relatively higher CPIs compared to the eCPMs it delivers for publishers
24
The State of Mobile App Installs and
Monetization
METHODOLOGY
InMobi’s State of App Installs and Monetization Series provides network insights for app
developers, publishers and advertisers. Through analysis of millions of impressions and installs
served each month, this report showcases the latest trends within the mobile app ecosystem on
our network.
ABOUT THE RESEARCH
The information contained in this report is based on data collected through InMobi’s
monetization and installs platform. Only data with all standard fields completed was included
for analysis. Percent change is calculated using absolute numbers, quarter over quarter. Keep in
mind that CTR performance may not be indicative of ad effectiveness. Many brand advertisers
track other metrics, such as engagement rates, interaction rates, dwell time, etc.
25
You can download the complete report here
25
THANK YOU
REACH US AT:
insights@inmobi.com
www.inmobi.com/insights
FOLLOW US ON:
twitter @inmobi
facebook.com/inmobi
linkedin.com/company/inmobi

The State of App Downloads and Monetization Report : Global 2015

  • 1.
    The State ofApp Downloads and Monetization InMobi Insights Page Global | February 2016
  • 2.
    Table of Contents Insights KeyMetrics by Region and OS App Installs - Deep Dive App Monetization - Deep Dive 1 2 3 4
  • 3.
    Cost per Install(CPI) Index The cost incurred by an advertiser to get an app installed by a user on his or her device. All cost data in this presentation is indexed to the Global CPI on the InMobi Network. Country CPI Index = --------------------- X 100Country CPI Global CPI If an imaginary country Krypton’s CPI = $0.53, and Global CPI = $2.1, then Krypton CPI Index = ------------- X 100 = 25$0.53 $2.1 3
  • 4.
    Effective Cost perMile (eCPM) Index The earnings of a developer on delivering a thousand impressions. All earnings data in this presentation is indexed to the Global eCPM on the InMobi Network. Country eCPM Index = --------------------- X 100Country eCPM Global eCPM If an imaginary country Krypton’s eCPM = $0.53, and Global eCPM = $2.1, then Krypton eCPM Index = ------------- X 100 = 25$0.53 $2.1 4
  • 5.
  • 6.
    China continued tobe the leading app destination The gap between Android and iOS further reduced in Asia Pacific as iOS gains popularity. Being a primarily Android market, Philippines saw expensive iOS installs App installs costs (CPI) and eCPMs are a function of smartphone penetration. Countries in Asia lead m-Commerce app installs this season USA and India had the least gap in costs of app installs across OS. Shopping & Lifestyle apps along with Travel apps drove growth across the globe Education apps earned app developers the highest eCPMs. 1. 2. 3. 4. Key Insights 6
  • 7.
    CPI and eCPMsby Region OS Share of Ad Impressions by Region OS Share of Ad Installs by Region CPI and eCPMs by OS Key Metrics by Region and OS2
  • 8.
    55 67 6684 21 14 256 178 17 11 126 79 4 4 36 37 5 4 89 68 1 1 113 92 Asia Pacific North America Europe Latin America Middle East Africa % Impressions eCPM Index% Installs CPI Index North America continues to be an expensive yet rewarding market for app developers Asia Pacific tops as the growing market with an eager audience high on apps and consumption CPI and eCPMs by Region 8
  • 9.
    OS Share ofAd Impressions by Region Asia Pacific North America Europe Latin America Middle East Africa iOS Android 59% 30% 67% 31% 90% 10% 63% ShareofAdImpressions Android has a near monopoly in app consumption across most markets given its large install base. 9 39% 37% 48% 7%69%
  • 10.
    Top App InstallsDestinations CPI in Key Markets Per Capita Installs by Markets Cost per Install by OS iOS Premium Over Android App Install by Category Ranking m-Commerce installs by Countries App Installs - Deep Dive3
  • 11.
    28% 15% 13% 9% 5% 5% 4% 3% 3% 2% 0% 7% 14% 21% 28% 35% ChinaIndonesia USA Philippines India Russia Malaysia Brazil South Korea Saudi Arabia %shareofappinstalls Top App Installs Destinations • China continued to be the leading app install destination as users amped us their mobile use 13
  • 12.
    CPI in KeyMarkets China Indonesia USA Philippines India Russia Malaysia Brazil South Korea Saudi Arabia 0 130 260 0% 25% 50% 75% CPIIndex Smartphone Penetration* * Source : eMarketer 14 App installs were more expensive in markets with higher smartphone penetration
  • 13.
    App Install byCategory 56% 20% 9% 6% 4% 5% Games Shopping & Lifestyle Travel Social & Communication Entertainment Others 2015 18 • While Gaming continued to rank as the most popular category of app downloaded by users in 2015, Shopping & Lifestyle (m- Commerce) and Travel apps drove growth across the globe.
  • 14.
    User Traffic byCountry Leading Publisher Categories by eCPM eCPM and Smartphone Penetration eCPM and CPI 4 App Monetization - Deep Dive
  • 15.
    14% 12% 11% 6% 5% 3% 3% 3%3% 2% 0% 5% 10% 15% Indonesia China USA India South Korea Turkey Brazil Japan United Kingdom Saudi Arabia %shareofappinstalls User Traffic by Country • Indonesians and Chinese were highly active on mobile in 2015 21
  • 16.
    eCPM and CPI China Indonesia USA Philippines India Russia Malaysia Brazil SouthKorea Saudi Arabia 0 100 200 0 130 260 eCPMIndex CPI Index • CPIs and eCPMs track each other in most markets. • South Korea has relatively higher CPIs compared to the eCPMs it delivers for publishers 24
  • 17.
    The State ofMobile App Installs and Monetization METHODOLOGY InMobi’s State of App Installs and Monetization Series provides network insights for app developers, publishers and advertisers. Through analysis of millions of impressions and installs served each month, this report showcases the latest trends within the mobile app ecosystem on our network. ABOUT THE RESEARCH The information contained in this report is based on data collected through InMobi’s monetization and installs platform. Only data with all standard fields completed was included for analysis. Percent change is calculated using absolute numbers, quarter over quarter. Keep in mind that CTR performance may not be indicative of ad effectiveness. Many brand advertisers track other metrics, such as engagement rates, interaction rates, dwell time, etc. 25
  • 18.
    You can downloadthe complete report here 25
  • 19.
    THANK YOU REACH USAT: insights@inmobi.com www.inmobi.com/insights FOLLOW US ON: twitter @inmobi facebook.com/inmobi linkedin.com/company/inmobi