The document discusses several key factors that influence weather and climate through their impact on temperature:
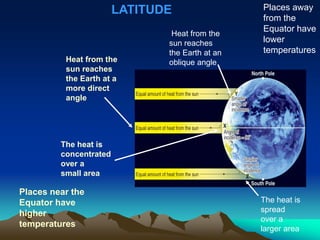
1) Latitude - Places near the equator receive more direct sunlight and have higher temperatures, while areas further from the equator receive sunlight at an oblique angle and have lower temperatures.
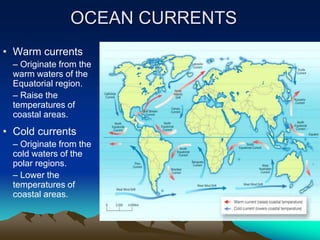
2) Distance from bodies of water - Areas near large bodies of water like oceans have more moderate temperatures due to the water's ability to store and release heat more slowly than land.
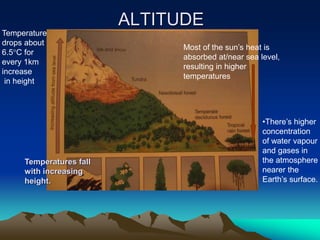
3) Elevation - Temperatures generally decrease with increasing elevation, as there is less atmosphere above to trap heat near the ground.