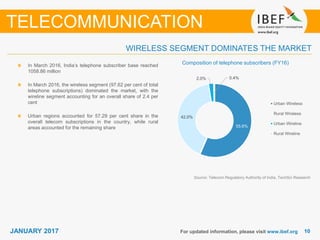
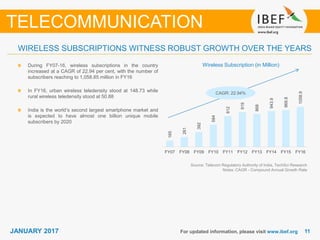
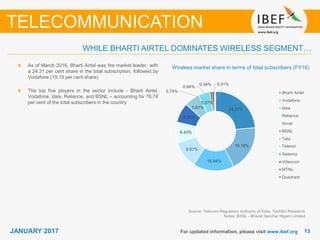
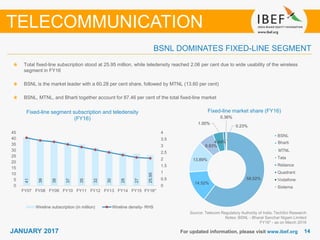
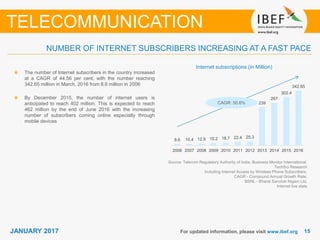
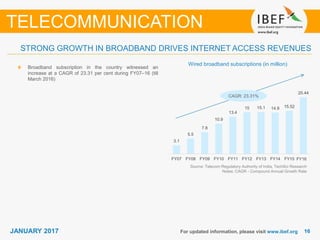
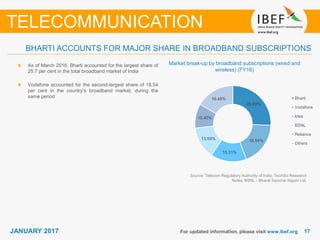
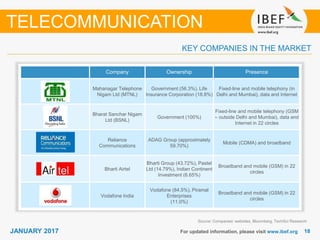
SlideShare a Scribd company logo
11JANUARY 2017
TELECOMMUNICATION
For updated information, please visit www.ibef.orgJANUARY 2017
22JANUARY 2017 For updated information, please visit www.ibef.org
ļ¶ Executive Summaryā€¦ā€¦ā€¦ā€¦ā€¦ā€¦ā€¦ā€¦ā€¦ā€¦. 3
ļ¶ Advantage Indiaā€¦ā€¦ā€¦ā€¦ā€¦ā€¦ā€¦ā€¦ā€¦..ā€¦.ā€¦ 4
ļ¶ Market Overview and Trendsā€¦ā€¦ā€¦ā€¦..ā€¦.. 6
ļ¶ Porterā€™s Five Forces Analysisā€¦ā€¦ā€¦ā€¦ā€¦..22
ļ¶ Strategies Adoptedā€¦ā€¦ā€¦ā€¦ā€¦ā€¦ā€¦ā€¦ā€¦ā€¦24
ļ¶ Growth Driversā€¦ā€¦ā€¦ā€¦ā€¦ā€¦ā€¦ā€¦ā€¦.ā€¦ā€¦.. 26
ļ¶ Opportunitiesā€¦ā€¦ā€¦ā€¦ā€¦ā€¦ā€¦ā€¦ā€¦.ā€¦ā€¦ā€¦ 39
ļ¶ Success Storiesā€¦ā€¦ā€¦ā€¦ā€¦ā€¦ā€¦ā€¦ā€¦ā€¦ā€¦ 43
ļ¶ Useful Informationā€¦ā€¦ā€¦ā€¦ā€¦ā€¦ā€¦.ā€¦ā€¦... 49
TELECOMMUNICATION
JANUARY 2017
33JANUARY 2017 For updated information, please visit www.ibef.org
EXECUTIVE SUMMARY
Second-largest
subscriber base
ā€¢ With a subscriber base of nearly 1058.86 million, as of March 2016, India accounted for
the second-largest telecom network in the world
Third-highest number of
internet users
ā€¢ With 342.65 million internet subscriptions, as of March 2016, India stood third-highest in
terms of total internet users in 2016. India is expected to become the second largest
country in terms of internet subscribers, with around 402 million internet users by
December 2015
Most of the Internet
accessed through
mobile phones
ā€¢ Mobile based Internet is a key component of Indian Internet usage, with seven out of eight
users accessing internet from their mobile phones
ā€¢ Since 2012, the share of time spent on watching videos on mobile devices has grown by
200 hours a year
Rising penetration rate
ā€¢ As of March 2016, urban tele-density stood at 154.01 per cent and rural tele-density at
51.37 per cent
Source: Telecom Regulatory Authority of India, TechSci Research
TELECOMMUNICATION
Affordability and lower
rates
ā€¢ Availability of affordable smartphones and lower rates are expected to drive growth in the
Indian telecom industry
ADVANTAGE INDIA
TELECOMMUNICATION
55JANUARY 2017
Growing demand
For updated information, please visit www.ibef.org
ADVANTAGE INDIA
Source: BMI (Business Monitor International) Report, TechSci Research, Internet Mobile Association of India (IAMAI)
Notes: MNP - Mobile Number Portability
Robust demand
ā€¢ India is the worldā€™s second-largest
telecommunications market, with
1.058 billion subscribers as of
March, 2016
ā€¢ With 70 per cent of the population
staying in rural areas, the rural
market would be a key growth
driver in the coming years
Attractive opportunities
ā€¢ Telecom penetration in the nationā€™s rural
market is expected to increase to 70 per
cent by 2017 from 51.37 per cent, as of
March 2016
ā€¢ India became the second-largest internet
market in December 2014
ā€¢ The government of India has introduced
Digital India program under which all the
sectors such as healthcare, retail, etc. will
be connected through internet
Policy support
ā€¢ The government has been proactive in
its efforts to transform India into a
global telecommunication hub;
prudent regulatory support has also
helped
ā€¢ National Telecom Policy 2012 calls for
unified licensing, full MNP and free
roaming
High ratings
ā€¢ The country has a strong
telecommunication infrastructure
ā€¢ In terms of telecommunication
ratings, India ranks ahead of its
peers in the West and Asia
2016
Number of
subscribers:
1.058
Billion
FY20F
Number of
subscribers:
1.3 billion
Advantage
India
TELECOMMUNICATION
MARKET OVERVIEW AND TRENDS
TELECOMMUNICATION
77JANUARY 2017 For updated information, please visit www.ibef.org
THE TELECOM MARKET SPLIT INTO THREE SEGMENTS
Source: TechSci Research
TELECOMMUNICATION
ā€¢ Comprises establishments operating and maintaining
switching and transmission facilities to provide direct
communications via airwaves
ā€¢ Consists of companies that operate and maintain switching
and transmission facilities to provide direct communications
through landlines, microwave or a combination of landlines
and satellite link-ups
ā€¢ Includes Internet Service Providers (ISPs) that offer
broadband internet connections through consumer and
corporate channels
Mobile
(wireless)
Fixed-line
(wireline)
Internet
services
Telecom
88JANUARY 2017 For updated information, please visit www.ibef.org
TELECOM SUBSCRIBER BASE EXPANDS SUBSTANTIALLY
India is currently the second-largest telecommunication
market and has the third highest number of internet users in
the world
Indiaā€™s telephone subscriber base expanded at a CAGR of
19.96 per cent, reaching 1058.86 million during FY07ā€“16
Tele-density (defined as the number of telephone
connections for every hundred individuals) in India,
increased from 17.9 in FY07 to 83.36 in FY16
In March 2016, total telephone subscription stood at
1058.86 million, while tele-density was at 83.36 percent
TELECOMMUNICATION
Source: Telecom Regulatory Authority of India, TechSci Research
Notes: CAGR - Compound Annual Growth Rate
Growth in total subscribers
205.86
300.49
429.72
621.28
846.32
951.34
898.02
846.32
996
1058.86
0
10
20
30
40
50
60
70
80
90
0
200
400
600
800
1000
1200
Telephone Subscriber (in million) Teledensity
99JANUARY 2017 For updated information, please visit www.ibef.org
Wireless and wireline revenues (USD billion)Indian telecom sectorā€™s revenue grew 7.50 per cent to
USD41.68 billion in FY15 as compared to USD38.78 billion
in FY14
Wireless and wireline revenue increased at a CAGR of 8.91
per cent to USD38.8 billion over FY06ā€“14
Revenues from the telecom equipment is expected to be
USD19 billion in FY15, which is further expected to touch
USD30 billion in FY20.
SURGING TELECOM REVENUES
TELECOMMUNICATION
Source: Telecom Regulatory Authority of India, TechSci Research
Note: CAGR - Compound Annual Growth Rate; FY ā€“ Indian Financial Year (April ā€“ March);
Figures mentioned are as per latest data available
CAGR: 8.91%
19.6
23.3
32.1 33.2 33.3
37.7
40.8
39.1 38.8
FY06 FY07 FY08 FY09 FY10 FY11 FY12 FY13 FY14
1010JANUARY 2017 For updated information, please visit www.ibef.org
In March 2016, Indiaā€™s telephone subscriber base reached
1058.86 million
In March 2016, the wireless segment (97.62 per cent of total
telephone subscriptions) dominated the market, with the
wireline segment accounting for an overall share of 2.4 per
cent
Urban regions accounted for 57.29 per cent share in the
overall telecom subscriptions in the country, while rural
areas accounted for the remaining share
WIRELESS SEGMENT DOMINATES THE MARKET
TELECOMMUNICATION
Source: Telecom Regulatory Authority of India, TechSci Research
Composition of telephone subscribers (FY16)
55.6%
42.0%
2.0% 0.4%
Urban Wireless
Rural Wireless
Urban Wireline
Rural Wireline
1111JANUARY 2017 For updated information, please visit www.ibef.org
WIRELESS SUBSCRIPTIONS WITNESS ROBUST GROWTH OVER THE YEARS
TELECOMMUNICATION
During FY07-16, wireless subscriptions in the country
increased at a CAGR of 22.94 per cent, with the number of
subscribers reaching to 1,058.85 million in FY16
In FY16, urban wireless teledensity stood at 148.73 while
rural wireless teledensity stood at 50.88
India is the worldā€™s second largest smartphone market and
is expected to have almost one billion unique mobile
subscribers by 2020
Source: Telecom Regulatory Authority of India, TechSci Research
Notes: CAGR - Compound Annual Growth Rate
CAGR: 22.94%
Wireless Subscription (in Million)
165
261
392
584
812
919
868
943.9
969.8
1058.9
FY07 FY08 FY09 FY10 FY11 FY12 FY13 FY14 FY15 FY16
1212JANUARY 2017 For updated information, please visit www.ibef.org
WIRELESS TELEDENSITY GROWS OVER THE YEARS
The mobile segmentā€™s teledensity surged 6 times from 14.6
per cent in FY07 to 81.38 per cent, in FY16
GSM services continue to dominate the wireless market
with a 95.73 per cent share (as of March 2016); while
CDMA services accounted for the remaining 4.27 per cent
share
TELECOMMUNICATION
Source: Telecom Regulatory Authority of India, TechSci Research
Notes: Teledensity - The number of telephone lines for every 100 people in a country,
GSM - Global System for Mobile Communications,
CDMA - Code Division Multiple Access
Growth in wireless teledensity
81.38%
77.27%
75.43%
70.90%
76%
68%
49.70%
33.70%
22.80%
14.60%
FY16
FY15
FY14
FY13
FY12
FY11
FY10
FY9
FY8
FY7
1313JANUARY 2017 For updated information, please visit www.ibef.org
WHILE BHARTI AIRTEL DOMINATES WIRELESS SEGMENTā€¦
TELECOMMUNICATION
As of March 2016, Bharti Airtel was the market leader, with
a 24.31 per cent share in the total subscription, followed by
Vodafone (19.15 per cent share)
The top five players in the sector include - Bharti Airtel,
Vodafone, Idea, Reliance, and BSNL ā€“ accounting for 78.74
per cent of the total subscribers in the country
Source: Telecom Regulatory Authority of India, TechSci Research
Notes: BSNL - Bharat Sanchar Nigam Limited
Wireless market share in terms of total subscribers (FY16)
24.31%
19.15%
16.94%
9.91%
8.43%
8.35%
5.81%
5.07%
0.74%
0.64%
0.34% 0.31%
Bharti Airtel
Vodafone
Idea
Reliance
Aircel
BSNL
Tata
Telewings
Sistema
Videocon
MTNL
Quadrant
Telenor
1414JANUARY 2017 For updated information, please visit www.ibef.org
BSNL DOMINATES FIXED-LINE SEGMENT
TELECOMMUNICATION
Fixed-line segment subscription and teledensity
(FY16)
Total fixed-line subscription stood at 25.95 million, while teledensity reached 2.06 per cent due to wide usability of the wireless
segment in FY16
BSNL is the market leader with a 60.28 per cent share, followed by MTNL (13.60 per cent)
BSNL, MTNL, and Bharti together account for 87.46 per cent of the total fixed-line market
Fixed-line market share (FY16)
41
39
38
37
35
32
30
28
27
25.95
0
0.5
1
1.5
2
2.5
3
3.5
4
0
5
10
15
20
25
30
35
40
45
FY07 FY08 FY09 FY10 FY11 FY12 FY13 FY14 FY15 FY16*
Wireline subscription (in million) Wireline density- RHS
Bharti
58.52%
14.52%
13.89%
6.83%
4.64%
1.00%
0.36%
0.23%
BSNL
MTNL
Bharti
Tata
Reliance
Quadrant
Vodafone
Sistema
MTNL
Bharti
Source: Telecom Regulatory Authority of India, TechSci Research
Notes: BSNL - Bharat Sanchar Nigam Limited
FY16* - as on March 2016
1515JANUARY 2017 For updated information, please visit www.ibef.org
NUMBER OF INTERNET SUBSCRIBERS INCREASING AT A FAST PACE
TELECOMMUNICATION
Internet subscriptions (in Million)
The number of Internet subscribers in the country increased
at a CAGR of 44.56 per cent, with the number reaching
342.65 million in March, 2016 from 8.6 million in 2006
By December 2015, the number of internet users is
anticipated to reach 402 million. This is expected to reach
462 million by the end of June 2016 with the increasing
number of subscribers coming online especially through
mobile devices
Source: Telecom Regulatory Authority of India, Business Monitor International,
TechSci Research
Including Internet Access by Wireless Phone Subscribers,
CAGR - Compound Annual Growth Rate;
BSNL - Bharat Sanchar Nigam Ltd,
Internet live stats
CAGR: 50.6%
8.6 10.4 12.9 15.2 18.7 22.4 25.3
239
267
302.4
342.65
2006 2007 2008 2009 2010 2011 2012 2013 2014 2015 2016
1616JANUARY 2017
STRONG GROWTH IN BROADBAND DRIVES INTERNET ACCESS REVENUES
For updated information, please visit www.ibef.org
TELECOMMUNICATION
Broadband subscription in the country witnessed an
increase at a CAGR of 23.31 per cent during FY07ā€“16 (till
March 2016)
Source: Telecom Regulatory Authority of India, TechSci Research
Notes: CAGR - Compound Annual Growth Rate
CAGR: 23.31%
Wired broadband subscriptions (in million)
3.1
5.5
7.8
10.9
13.4
15 15.1 14.9 15.52
20.44
FY07 FY08 FY09 FY10 FY11 FY12 FY13 FY14 FY15 FY16ā½Ā¹ā¾
1717JANUARY 2017 For updated information, please visit www.ibef.org
BHARTI ACCOUNTS FOR MAJOR SHARE IN BROADBAND SUBSCRIPTIONS
As of March 2016, Bharti accounted for the largest share of
25.7 per cent in the total broadband market of India
Vodafone accounted for the second-largest share of 18.54
per cent in the countryā€™s broadband market, during the
same period
TELECOMMUNICATION
Source: Telecom Regulatory Authority of India, TechSci Research
Notes: BSNL - Bharat Sanchar Nigam Ltd,
Market break-up by broadband subscriptions (wired and
wireless) (FY16)
25.69%
18.54%
15.31%
13.59%
10.40%
16.48% Bharti
Vodafone
Idea
BSNL
Reliance
Others
1818JANUARY 2017 For updated information, please visit www.ibef.org
KEY COMPANIES IN THE MARKET
TELECOMMUNICATION
Company Ownership Presence
Mahanagar Telephone
Nigam Ltd (MTNL)
Government (56.3%), Life
Insurance Corporation (18.8%)
Fixed-line and mobile telephony (in
Delhi and Mumbai), data and Internet
Bharat Sanchar Nigam
Ltd (BSNL)
Government (100%)
Fixed-line and mobile telephony (GSM
ā€“ outside Delhi and Mumbai), data and
Internet in 22 circles
Reliance
Communications
ADAG Group (approximately
59.70%)
Mobile (CDMA) and broadband
Bharti Airtel
Bharti Group (43.72%), Pastel
Ltd (14.79%), Indian Continent
Investment (6.65%)
Broadband and mobile (GSM) in 22
circles
Vodafone India
Vodafone (84.5%), Piramal
Enterprises
(11.0%)
Broadband and mobile (GSM) in 22
circles
Source: Companiesā€™ websites, Bloomberg, TechSci Research
1919JANUARY 2017 For updated information, please visit www.ibef.org
NOTABLE TRENDS IN THE INDIAN TELECOM SECTOR ā€¦ (1/2)
TELECOMMUNICATION
Green Telecom
ā€¢ The green telecom concept is aimed at reducing carbon footprint of the telecom industry
through lower energy consumption
ā€¢ Tata has invested around USD16.38 million to convert its 10,000 base stations from
indoor to outdoor to reduce energy consumption and carbon footprint across its 20
telecom circles in India so far
Expansion to Rural
Markets
ā€¢ There are over 62,443 uncovered villages in India; these would be provided with village
telephone facility with subsidy support from the governmentā€™s Universal Service Obligation
Fund (thereby increasing rural teledensity)
ā€¢ In March 2016, the rural subscriber base accounted for 42.42 per cent of the total
subscriber base, thereby fuelling growth across the sector
ā€¢ The most significant recent developments in wireless communication include BWA
technologies such as WiMAX and LTE
ā€¢ In 2015, Airtel launched its 4G services in 296 cities across the India
ā€¢ In 2015, BSNL started its first 4G Wireless Broadband Internet Service- WiMax
ā€¢ Reliance Jio, has launched 4G services across pan- India as on December 2015
Source: TechSci Research
Notes: BWA - Broadband Wireless Access, TRAI - Telecom Regulatory Authority of India
Emergence of BWA
Technologies
ā€¢ IoT is the concept of electronically interconnected and integrated machines, which can
help in gathering and sharing data. The Indian Government is planning to develop 100
smart city projects and has earmarked USD1.09 billion in the current budget, where IoT
would play a vital role in development of those cities.
Internet Of Things
(IOT)
2020JANUARY 2017 For updated information, please visit www.ibef.org
TELECOMMUNICATION
NOTABLE TRENDS IN THE INDIAN TELECOM SECTOR ā€¦ (2/2)
Telecom Finance
Commission
ā€¢ Department of Telecommunication is planning to issue a global tender for inviting
applications for setting up a Telecom Finance Corporation (TFC). The government has
fixed a deadline according to which TFC is expected to be operational by March 31, 2017
Rising investments
ā€¢ Vodafone one of the leading players in the telecom sector in India, has disclosed its plans
to invest USD1310 million to upgrade and expand Vodafone India network coverage and
USD655 million to upgrade its technology centre
Outsourcing non-core
activities
ā€¢ As part of the recent outsourcing trend, operators have outsourced functions such as
network maintenance, IT operations, and customer service
Mobile banking
ā€¢ Availability of affordable smartphones, along with a rise in the security level of mobile
transactions, is expected to boost growth of transactions conducted via phones, with the
overall transaction value being tripled in 2014. In December 2015, 39.5 million mobile
banking transactions were done, as compared to 16.8 million in December 2015.
ā€¢ In May 2016, about 37 lakh mobile banking transaction attempts were able to reach
NPCIā€™s platform
Source: ā€™Searching for New Frontiers of growth: Indian Banksā€™- PwC, TechSci Research,
Reserve Bank of India
Note: NPCI - National Payment Corporation of India
2121JANUARY 2017 For updated information, please visit www.ibef.org
EMERGENCE OF TOWER INDUSTRY
TELECOMMUNICATION
A surge in the subscriber base has necessitated network expansion covering a wider area, thereby creating a need for
significant investment in telecom infrastructure
To curb costs and focus on core operations, telecom companies have been segregating their tower assets into separate
companies. For example: Reliance Communications has decided to finalise a deal to sell its stake in Reliance Infratel. The
value of the deal is around USD3.68 billion
Creating separate tower companies has helped telecom companies lower operating cost and improve capital structure; this
has also provided an additional revenue stream
Inspired by the success seen by Indian players in towers business, most of the operators around the world are replicating the
model
To reduce the carbon footprint for telecom infrastructure, including mobile towers, on 1st January, 2017, TRAI (The Telecom
Regulatory Authority of India), announced to bring consultation paper, that will review the issues related to carbon footprint.
Emergence of tower industry
Rising
competition
Higher
operating
cost and
debt burden
Focus on
tower
sharing to
reduce
costs
Segregation
of towers
into
separate
companies
Source: TechSci Research
PORTER FIVE FORCES ANALYSIS
TELECOMMUNICATION
2323JANUARY 2017 For updated information, please visit www.ibef.org
PORTERā€™S FIVE FORCES ANALYSIS
Source: TechSci Research
Note: VoIP ā€“ Voice Over Internet Protocol
TELECOMMUNICATION
Competitive Rivalry
ā€¢ Customersā€™ low switching cost and price sensitivity are increasing
competition among players
ā€¢ High exit barriers are also intensifying competition
ā€¢ There are around 6 to 7 players in each region, leading to intense
competition
Threat of New Entrants Substitute Products
Bargaining Power of Suppliers Bargaining Power of Customers
ā€¢ Strict government regulations
ā€¢ Extremely high infrastructure
setup cost
ā€¢ Difficulty in achieving
economies of scale
ā€¢ High bargaining power of
suppliers as there are just a few
suppliers in the sector
ā€¢ High cost of switching suppliers
ā€¢ Low switching cost and mobile
number portability give
customers high bargaining
power
ā€¢ Customers are price sensitive
ā€¢ Hardly any threat of substitute
products as there is no
substitute available in the
market
Competitive
Rivalry
(High)
Threat of New
Entrants
(Low)
Threat of
Substitute
Products
(Low)
Bargaining
Power of
Customers
(High)
Bargaining
Power of
Suppliers
(High)
STRATEGIES ADOPTED
TELECOMMUNICATION
2525JANUARY 2017 For updated information, please visit www.ibef.org
STRATEGIES ADOPTED
Source: Company websites, TechSci Research
Notes: CDMA ā€“ Code Division Multiple Access, GSM - Global System for Mobile Communication
TELECOMMUNICATION
ā€¢ Players are using innovative marketing strategies to succeed in this sector. For example,
ā€¢ In August 2015, Idea Cellular launched new campaign ā€œGet idea and danceā€
ā€¢ Airtel launched new ad campaign ā€œAirtel myPlan Familyā€
ā€¢ Players differentiate themselves by providing different services to customers. For example,
ā€¢ In 2015, Airtel India launched a mobile app ā€œWynk Moviesā€, it is a library that includes videos
and movies
ā€¢ In November 2015, Vodafone launched ā€œChoose Your Numberā€ facility where pre paid and post
paid customers get numbers of their own choice
ā€¢ Players price their products very carefully due to the price sensitive nature of customers and high
competition in the sector. Players generally go for price war. For example,
ā€¢ In December 2016, Micromax launched low cost 4G Volte Smartphones, with a pre-activated
Reliance Jio Sim offer of free voice calls and data. These smartphones are launched in the
range of USD67.21 to USD114.57
ā€¢ To compete with Airtel 4G services, Vodafone launched ā€˜Double Dataā€™ scheme for its prepaid
customers where users will get double data pack at the same price.
ā€¢ Companies such as Reliance Jio, Airtel have already launched 4G technology at very
competitive prices
ā€¢ In September 2016, Reliance Jio 4G network plans have been launched by the companyā€™s
chairman Mr. Mukesh Ambani. Free domestic voice calls have been offered by Jio. No charge
or deduction of data would be done for making voice calls to any network across the country.
Also, the company has offered cheaper data plans and tariff plans ranging from USD2.28
to USD76.37 per month. As of October 2016, the companyā€™s subscriber base had crossed 16
million customers
Marketing strategy
Differentiation
Pricing strategy
GROWTH DRIVERS
TELECOMMUNICATION
2727JANUARY 2017 For updated information, please visit www.ibef.org
SECTOR BENEFITS FROM RISING INCOME, GROWING YOUNG POPULATION
TELECOMMUNICATION
Growing demand
Inviting Resulting in
Growing demand
Increasing
investments
Policy support
Higher real
income and
changing lifestyles
Growing young
population
Increasing
MOU and data
usage
Reduction in
license fee
Relaxed
FDI Norms
Encourages
firms to expand
to rural areas
Higher FDI inflows
Increasing M&A
activity
Notes: FDI - Foreign Direct Investment,
MOU - Minutes of Use per month and per subscriber, M&A - Mergers and Acquisitions
2828JANUARY 2017 For updated information, please visit www.ibef.org
RISING INCOME FUELS DEMAND FOR TELECOM SERVICES
Rising per capita income in India (USD)Incomes have risen at a brisk pace in India and will continue
rising given the countryā€™s strong economic growth
prospects.
Nominal per capita income have recorded a CAGR of 8.87
per cent over 2000ā€“15
Increasing income has been a key determinant of demand
growth in the telecommunication sector in India
The IMF estimates nominal per capita income in India to
expand at a CAGR of 4.94 per cent during FY10ā€“FY19
Per capita income in the country is expected to grow at a
CAGR of 8.1 per cent during FY15-FY19
Per capita income in the country is estimated at
USD1,747.5 in FY16
TELECOMMUNICATION
Source: IMF, TechSci Research
Notes: CAGR - Compound Annual Growth Rate,
F ā€“ Forecast, E - Estimate
1430.2
1552.5
1514.8
1504.5
1600.9
1617.3
1747.5
1874.9
2026.7
2207.6
-4.0%
-2.0%
0.0%
2.0%
4.0%
6.0%
8.0%
10.0%
0.0
500.0
1000.0
1500.0
2000.0
2500.0
GDP per capita, current prices Growth Rate
2929JANUARY 2017 For updated information, please visit www.ibef.org
INCREASING INCOME AND GROWING RURAL MARKET ā€“ DEMAND DRIVERS
Indian residents shifting from low to high
income groups (%)
The emergence of an affluent middle class is triggering
demand for the mobile and internet segments
A young, growing population is aiding this trend (especially
demand for smart phones)
TELECOMMUNICATION
Source: McKinsey Quarterly Report, TechSci Research
Note: Mobile Users Come of Ageā€™ February 2011
Million Household, 100%
273 322244
1% 3% 7%2% 6%
17%23%
25%
29%
43%
40%
32%
30% 26%
15%
2015 2020 2030
Globals(>22065.3) Strivers(11032.7-22065.3)
Seekers(4413.1-11032.7) Aspirers(1985.9-4413.1)
Deprived(<1985.9)
3030JANUARY 2017 For updated information, please visit www.ibef.org
INCREASING INTERNET REVENUES AND SUBSCRIPTIONS
MVAS revenues (in USD Billion)The Mobile Value Added Services (MVAS) industry has
expanded at a CAGR of 30.93 per cent to USD9.5 billion by
2015 from USD1.1 billion in 2007
The share of non-voice revenues, which currently stands at
around 10 per cent of telecom operatorsā€™ revenues, is
estimated to rise to more than 30 per cent in the next five to
seven years
A decline in the prices of smartphones and data
subscription rates is likely to drive demand for MVAS
TELECOMMUNICATION
Source: Wipro Technologies,
The Internet and Mobile Association of India, TechSci Research
Notes: CAGR - Compound Annual Growth Rate,
MVAS - Mobile Value-Added Services,
E - Estimate, F - Forecast
CAGR: 30.93%
1.1
1.7 1.9
3.2
4.2
4.9
6.2
7.8
9.5
2007 2008 2009 2010 2011 2012 2013 2014 2015E
3131JANUARY 2017 For updated information, please visit www.ibef.org
STRONG POLICY SUPPORT CRUCIAL TO THE SECTORā€™S DEVELOPMENT ā€¦ (1/3)
To compensate the
consumers in case of
call drop
ā€¢ In October 2015, Telecom Regulatory Authority of India announced an amendment for
Telecom Consumer Protection Regulations 2012 according to which mobile service
operators have to provide compensation to the users in case of call drop.
ā€¢ The formulated regulation would be effective from January, 2016.
Standards of quality
wireline and wireless
services
ā€¢ In 2015, Telecom Regulatory Authority of India made regulations to amend the Standards
of quality of wireline (telephone service) and cellular mobile telephone services. These
regulations has been laid down to ensure better and effective compliance with the quality
of service regulations and to protect the interest of the customers
Relaxed
FDI norms
ā€¢ FDI cap in the telecom sector has been increased to 100 per cent from 74 per cent; out of
100 per cent, 49 per cent will be done through automatic route and the rest will be done
through the FIPB approval route
ā€¢ FDI of up to 100 per cent is permitted for infrastructure providers offering dark fibre,
electronic mail and voice mail
Notes: FDI - Foreign Direct Investment,
FIPB - Foreign Investment Promotion Board
Source: TRAI, TechSci Research
TELECOMMUNICATION
3232JANUARY 2017 For updated information, please visit www.ibef.org
TELECOMMUNICATION
Telecommunication
Tariff Order
ā€¢ In 2015, TRAI passed the telecommunication tariff (16th amendment) order, according to
which, every service provider should offer a special roaming tariff plan to its prepaid and
post-paid customers and on payment of fixed charge for special roaming tariff plan
national roaming should be free
Set up internet
connections
ā€¢ The Department of Information Technology intends to set up over 1 million internet-
enabled common service centres across India as per the National e-Governance Plan
ā€¢ On 8th August 2016, the Telecom Regulatory Authority of India (Trai) made the 10th
amendment to the TCPR (Telecom Consumers Protection Regulations) permitting telecom
companies to offer data packs having maximum validity of 365 days
Reduction in license
fees
ā€¢ In January 2015, the Government of India recommended reduction in license fees of
telecom operators by 6 per cent, telecom operators currently pay 8 per cent of adjusted
gross revenue as licence fee
ā€¢ The issuance of several international and national long-distance licenses has created
opportunities and attracted new companies into the market
Notes: USOF - Universal Service Obligation Fund; OFC - Optical Fibre Cable,
WiMAX - Worldwide Interoperability for Microwave Access Telecommunications
Source: TRAI, TechSci Research
STRONG POLICY SUPPORT CRUCIAL TO THE SECTORā€™S DEVELOPMENT ā€¦ (2/3)
3333JANUARY 2017 For updated information, please visit www.ibef.org
TELECOMMUNICATION
Financial support
ā€¢ The USOF is expected to extend ļ¬nancial support to operators providing services in rural
areas and encourage active infrastructure sharing among operators
ā€¢ TRAI has recommended that USO levy component to be reduced from 5 per cent to 3 per
cent of annual revenues for all the licenses from April 2015
Enhanced spectrum
limit
ā€¢ The prescribed limit on spectrum would be increased from 6.2MHz to 2x8 MHz (paired
spectrum) for GSM technology in all areas other than Delhi and Mumbai, where it will be
2x10MHz (paired spectrum)
ā€¢ Telecom players can, however, obtain additional frequency; there will be an auction of
spectrum subject to the limits prescribed for the merger of licenses
ā€¢ As of October 2016, telecom operators like Vodafone and Tata Teleservices purchased
spectrum worth USD 1.51 billion and USD 0.34 billion, respectively, from the government
Telecommunication
amendment order for
broadcasting and cable
services
ā€¢ In 2015, telecom authority issued this order mandating every DTH operator to specify the
tariff for supply and installation of the customer premises equipment. DTH operator should
specify the refundable security deposit, installation charges, monthly rental charge and
activation
Source: TRAI, TechSci Research
Notes: USOF - Universal Service Obligation Fund; OFC - Optical Fibre Cable
STRONG POLICY SUPPORT CRUCIAL TO THE SECTORā€™S DEVELOPMENT ā€¦ (3/3)
3434JANUARY 2017 For updated information, please visit www.ibef.org
NATIONAL TELECOM POLICY - 2012
Source: Digital Dawn,
KPMG Report 2013, TechSci
Research
TELECOMMUNICATION
ā€˜Broadband for allā€™ with
a minimum download
speed of 2Mbps
Unified licensing,
delinking of spectrum
from license, online
real-time submission
and processing
Aims at a ā€˜One Nation-
One licenseā€™ regime
with no roaming
charges and nation
wide number portability
Increase rural
teledensity from 39 to
70% by 2017, and
100% by 2020
Liberalisation of
spectrum, and
convergence of
network, services and
devices
National Telecom
Policy - 2012
3535JANUARY 2017 For updated information, please visit www.ibef.org
Process of M2M Roadmap Formulation
Source: Digital Dawn,
KPMG Report 2013, TechSci Research
TELECOMMUNICATION
Policy & Regulatory
Committee
Draft roadmap and open
consultation through web
Consultation with Industry
bodies (COAL, FICCI,
AUSPI, ASSOCHAM)
/Other Stakeholders
Firming up of issues &
viewpoints through
Questionnaire to
Stakeholders
Seminars & Workshops
on M2M
Input from consultative
committee & working
groups
Input from various TEC
committees on different
issues
Inputs from DeitY and
Industry stakeholders on
draft documents
National Telecom M2M Roadmap
3636JANUARY 2017 For updated information, please visit www.ibef.org
FOREIGN INVESTMENTS FLOWING IN ā€¦ (1/2)
Cumulative FDI inflows into the telecom sector over April 2000ā€“March 2016, totalled to USD18.38 billion
During this period, FDI into the sector accounted for a share of 6.4 per cent of total FDI inflows into the country, till March
2016
Between April 2014 to March 2016, Telecommunication sector attracted FDI inflows of around USD 6.97 billion.
TELECOMMUNICATION
Source: Department of Industrial Policy & Promotion, TechSci Research
Note: FY16 - Data mentioned is from April 2000 ā€“ September 2016
Cumulative FDI inflows into telecommunication (USD million)
9872.49 10,589.27
12,552.19 12,856.06
14,163.01
17,058.03
21,169.00
FY10 FY11 FY12 FY13 FY14 FY15 FY16
3737JANUARY 2017
Source: Thomson Banker, Deal Tracker, Grant Thornton, TechSci Research
Notes: M&A - Merger and Acquisition, PE - Private Equity
TELECOMMUNICATION
FOREIGN INVESTMENTS FLOWING IN ā€¦ (2/2)
Target Acquirer
Acquisition price
(USD million)
Division acquired
Videocon Telecommunications
Ltd-1800 MHz spectrum in six
circles
Bharti Airtel (2016) 660 100% stake
Bharti Airtel's operations in
Burkina Faso and Sierra Leone
Orange SA (2016) 900 100% stake
MTS Reliance Communication (2015) 736.98 8 ā€“ 10% stake
Augere Wireless Bharti Airtel (2015) 21.3 million 100% stake
Bharti Airtel SingTel(2013) 302 Increases stakes to 32.34%
Bharti Airtel Qatar Foundation Endowment(2014) 1,260 PE deal ā€“ 5% stake
Vodafone India Ltd Vodafone International Holdings (2014) 1,641 Increases stakes to 100%
Foreign investment in India
For updated information, please visit www.ibef.org
As on September 2016, Reliance Communications merged operations with telecom operator Aircel. The merged entity plans
to dilute 25 per cent of its equity by selling stake to Russian company, Sistema.
3838JANUARY 2017 For updated information, please visit www.ibef.org
EXPANSION AND GROWTH STRATEGIES OF LEADING PLAYERS
TELECOMMUNICATION
New Call Telecom
Investment decision
ā€¢ In 2015, New Call Telecom has announced to invest USD300 million in India within next
12-18 months. The company has decided to invest in India to increase its presence. Along
with investments, New Call Telecom has already acquired Nimbuzz (global mobile
technology brand) and New Delhi based Ozone networks
Vodafone India 4G
launch, Reliance Jio 4G
launch
ā€¢ In January 2016, Vodafone India launched its 4G network services in Kolkata and
Kozhikode (Kerala) following its successful implementation in other parts of Kerala such as
Kochi and Thiruvananthapuram
ā€¢ In September 2016, Reliance Jio launched 4G services across India, at comparatively
cheaper rates. The company has targeted to acquire 100 million customers by March 2017.
In addition to the existing plan India 2300 MHz spectrum and 1800 MHz in 14 circles,
during the auction in 2016, Jio invested over USD1,527.7 million to acquire 1800 MHz
spectrum in 6 circles and 800 MHz spectrum in 10 circles
Mobile wallet by
Vodafone
ā€¢ Vodafone India has entered into an agreement with Walmart India to make payments using
M-Pesa mobile wallet services. Under this agreement, Vodafone M-Pesa will offer safe,
secure and convenient transactions and on placing an order with Walmart India, Vodafone
M-Pesa agent will reach out to customer and cash in into his M-Pesa account
Source: Thomson Banker, Deal Tracker, TechSci Research
Note: M&A - Merger and Acquisition
New Entrant in the
Smartphone Market
ā€¢ China based companies such as Xiaomi, One Plus, OPPO, Huawei, etc. have launched
their Smartphones in India.
ā€¢ Domestic Players such as Micromax, Karbonn and Lava are the top three budget
smartphone companies in India
OPPORTUNITIES
TELECOMMUNICATION
4040JANUARY 2017
OPPORTUNITIES ACROSS SEGMENTS IN THE INDUSTRY ā€¦ (1/2)
For updated information, please visit www.ibef.org
TELECOMMUNICATION
ā€¢ The number of wireless
subscribers in India reached
1.033 billion, by March 2016
ā€¢ Of the total 1033.63 million
subscribers in 2016, around
56.96 per cent subscribers
are likely to be from urban
areas and the rest (43.04 per
cent), from rural areas
ā€¢ By 2017, rural tele-density is
expected to reach 70 per cent
and 100 per cent by 2020,
growing from 43.05 per cent
as of March 2016
ā€¢ By March 2016, rural wireless
tele-density in the country
increased to 50.88, while, the
urban wireless tele-density
reached to 148.73 during the
same period
ā€¢ Internet penetration is
expected to grow steadily and
is likely to be bolstered by
government policy
ā€¢ Number of broadband
subscribers reached 149.75
million at the end of March
2016
Increasing mobile subscribers Untapped rural markets Rising internet penetration
Source: KPMG, TRAI, TechSci Research
4141JANUARY 2017 For updated information, please visit www.ibef.org
TELECOMMUNICATION
OPPORTUNITIES ACROSS SEGMENTS IN THE INDUSTRY ā€¦ (2/2)
ā€¢ Telecom infrastructure
was expected to
increase at a CAGR of
20 per cent to 571,000
towers during 2008ā€“15
ā€¢ TRAI has made several
recommendations for
the development of
telecom infrastructure,
including tax benefits
and recognising telecom
infrastructure as
essential infrastructure
ā€¢ The Indian Mobile
Value-Added Services
(MVAS) industry is
expected to reach
USD9.5 billion by 2015
from USD4.9 billion in
2012
ā€¢ Public cloud services
in India generated
USD730 million by
December 2015. Indian
public cloud services
market is expected to
reach USD1.9 billion by
2019.
ā€¢ Telecom equipment
market was estimated to
be USD20 billion in
2015-16
ā€¢ It is anticipated to reach
USD30 billion by 2020
ā€¢ Under Digital India
programme, ā€˜every
Indian has a
smartphone by 2019ā€™
programme
implemented
Development of telecom
infrastructure
Growth in MVAS and
cloud computing
Telecom equipment
market
Source: Press information bureau, Government of India, TechSci Research
Notes: VAS - Value-Added Services, NTP - National Telecom Policy
ā€¢ In order to overcome the
cash related problems
being faced by people,
due to demonetisation,
Paytm launched a
service through which
consumers and
merchants can pay and
receive money instantly,
without an internet
connection
ā€¢ This has enabled non-
smartphone users to go
cashless
Growing Cashless
Transactions
4242JANUARY 2017
MOBILE APPLICATION MARKET: FAST GROWING SEGMENT
For updated information, please visit www.ibef.org
TELECOMMUNICATION
The mobile application (app) market is expected to expand
at a CAGR of 49.62 per cent to USD330 million during
2014ā€“16
The mobile app market is estimated around USD245.6
million in 2015
The segmentā€™s growth is expected to be driven by
increasing mobile connections and availability of low-range
smartphones
Over 100 million apps are downloaded every month across
different platforms such as iOS, Blackberry, Nokia, and
Android
Source: Gartner, Deloitte, Assorted News Articles, TechSci Research
Notes: CAGR - Compounded Annual Growth Rate, *CAGR is
calculated in USD million terms, F - Forecast
CAGR: 49.62%
Mobile App Market Size (USD million)
147.4
245.60
330
2014 2015 2016(F)
SUCCESS STORIES
TELECOMMUNICATION
4444JANUARY 2017 For updated information, please visit www.ibef.org
BHARTI AIRTEL: AN INSPIRING SUCCESS STORY ā€¦ (1/2)
TELECOMMUNICATION
Set up in 1995, Bharti Airtel is worldā€™s leading mobile operator with presence in 20 countries
It is the countryā€™s leading mobile operator, with a customer base of 357.4 million as of March 2016, and the worldā€™s third-
largest telecom operator
Revenues increased at a CAGR of 11.2 per cent during FY08-FY16 from USD6.3 billion in FY08 to USD14.7 billion in FY16
CAGR: 11.2%
Source: Company website, TechSci Research
Notes: CAGR - Compound Annual Growth Rate
Note: (1) - Revenue is including eliminations
Revenues (in USD Billion)Major segments(1) (FY16)
6.3
7.6 8.3
12.3
14.3 14.2 14.2
15.1 14.7
FY08 FY09 FY10 FY11 FY12 FY13 FY14 FY15 FY16
58.10%
8.1%
5.8%
4.9%
3.0%
20.1%
Mobile Services
Airtel Business
Tower Infrastructure
Services
Telemedia Services
Digital TV Services
Others
4545JANUARY 2017 For updated information, please visit www.ibef.org
TELECOMMUNICATION
Bharti Airtel had over 251.2 million subscribers, as of March
2016
The companyā€™s overall subscriber base in the country
expanded at a CAGR of 19.11 per cent, reaching 251.2
million from 62 million over FY08ā€“FY16
Bharti Airtel has a mobile subscriber base of 200 million in
India
Bharti Airtel bought optical network gear from Ciena
Communications Inc in 2014 to expand capacity of its i2i
undersea cable network that connects India to Singapore
The company had expansion plans in Africa to tap the huge
growth potential
It became the first Indian telecom company to offer 4G
service on mobile phones
On 8th April, 2016, Bharti Airtel Ltd acquired 4G TD
spectrum for eight circles namely Bihar, J&K, Tamil Nadu,
West Bengal, Assam, North East, Andhra Pradesh and
Orissa from Aircel Limited
Source: Company website, TechSci Research
Notes: CAGR - Compounded Annual Growth Rate
BHARTI AIRTEL: AN INSPIRING SUCCESS STORY ā€¦ (2/2)
CAGR: 19.11%
Total subscribers (Million)
62
95
131
221
252
271
220 226
251
FY08 FY09 FY10 FY11 FY12 FY13 FY14 FY15 FY16
As of November 2016, the company signed a USD
60 million deal with Finnish gear maker ā€˜Nokiaā€™ to
implement voice-over-LTE (VoLTE) calling
technology
4646JANUARY 2017 For updated information, please visit www.ibef.org
VODAFONE: INDIAā€™S THIRD-LARGEST MOBILE OPERATOR ā€¦ (1/2)
TELECOMMUNICATION
Established in 1994, Vodafone is one of Indiaā€™s leading
mobile operators, with more than 188.2 million customers as
of September 2015
Vodafone's revenues from India increased at a CAGR of
8.44 per cent to USD6.7 billion during FY08ā€“15
Source: Company website, TechSci Research
Notes: CAGR - Compounded Annual Growth Rate
CAGR: 8.44%
Revenues (USD billion)
3.9
4.4
4.9
5.9
6.7
7.4
6.2
6.7
3.8
FY08 FY09 FY10 FY11 FY12 FY13 FY14 FY15 FY16*
5.9
4747JANUARY 2017
VODAFONE: INDIAā€™S THIRD-LARGEST MOBILE OPERATOR ā€¦ (2/2)
For updated information, please visit www.ibef.org
TELECOMMUNICATION
Vodafoneā€™s customer subscription increased at a CAGR of
15.12 per cent to 188.2 million during FY08ā€“FY16(1)
In September 2015, Vodafoneā€™s subscriber base stood at
188.2 million
Vodafone has announced to launch its 4G services in
Mumbai, Delhi, Kolkata, Kerala and Karnataka by
December 2015
Gujarat, Uttar Pradesh, Maharashtra, and West Bengal
together account for over 45 per cent of the total customer
base
Vodafone Group plans to invest heavily in the establishment
of a fibre-optic network in India
Vodafone has launched 4G services in Delhi, Kolkata,
Karnataka and Kerala in February 2016. In May 2016, the
company also planned to cover four circles of Gujarat,
Haryana, UP (East) and West Bengal
Source: Company website, TechSci Research
Notes: FY16(1) represents data till Sep 2015,
CAGR - Compounded Annual Growth Rate
CAGR: 15.12%
Total subscribers (million)
61
91
124
148 147 153
167
183 188.2
FY08 FY09 FY10 FY11 FY12 FY13 FY14 FY15 FY16*FY16
4848JANUARY 2017
MOBILE NUMBER PORTABILITY: A PARADIGM SHIFT IN INDIAN TELECOM
For updated information, please visit www.ibef.org
TELECOMMUNICATION
Mobile Number Portability (MNP) in India was introduced in
November 2010
MNP allows subscribers to change their mobile service
provider while retaining their old mobile number
The portability service was made available for both postpaid
and prepaid customers as well as on both GSM and CDMA
platforms
The implementation of MNP has brought a slew of benefits
for customers in terms of better plans and offers
MNP requests in India increased to 209.13 million at the
end of March, 2016
Source: TRAI Report, TechSci Research
Number of MNP requests (in million)
117.01
153.85
209.13
FY14 FY15 FY16
USEFUL INFORMATION
TELECOMMUNICATION
5050JANUARY 2017
INDUSTRY ASSOCIATIONS
Association of Unified Telecom Service Providers of India (AUSPI)
B-601, Gauri Sadan 5, Hailey Road, New Delhi ā€“ 110 001, India
Tel: 91 11 23358585
Fax: 91 11 23327397
Website: http://www.auspi.in/
Association of Competitive Telecom Operators (ACTO)
601, Nirmal Tower, 26, Barakhamba Road, Connaught Place, New Delhi ā€“ 110 001, India
Tel.: 91 11 43565353 / 43575353
Fax: 91 11 43515353
E-mail: info@acto.in
Website: www.acto.in
Internet & Mobile Association of India (IAMAI)
F-36, Basement, East of Kailash, New Delhi ā€“ 110 065, India
Tel: 91 11 46570328
E-mail: kalyan@iamai.in
Website: www.iwww.iamai.in
For updated information, please visit www.ibef.org
TELECOMMUNICATION
5151JANUARY 2017
APPENDIX
For updated information, please visit www.ibef.org
BMI telecoms business environment ratings
Industry rewards: it considers average revenue per users, number of subscribers, subscriber growth, and number of
operators
Country rewards: it considers urban/rural split, age range, GDP per capita, USD
Industry risks: it considers regulatory independence
Country risk: it rates the country on short-term external risk, policy continuity, legal framework corruption
Telecom ratings: overall rating of the above indicators
TELECOMMUNICATION
5252JANUARY 2017
GLOSSARY ā€¦ (1/2)
BWA: Broadband Wireless Access
CAGR: Compound Annual growth rate
DoT: Department of Telecommunication
FDI: Foreign Direct Investment
FTTH: Fibre To The Home
FY: Indian Financial Year (April to March)
IMF: International Monetary Fund
INR: Indian Rupee
IPTV: Internet Protocol Television
M&A: Mergers and Acquisitions
MoU: Minutes of Use per month and per subscriber
MPEG: Moving Picture Experts Group
For updated information, please visit www.ibef.org
TELECOMMUNICATION
5353JANUARY 2017 For updated information, please visit www.ibef.org
OFC: Optical Fibre Cable
TRAI: Telecom Regulatory Authority of India
USOF: Universal Service Obligation Fund
USD: US Dollar
VAS: Value-Added Services
WiMAX: Worldwide Interoperability for Microwave access telecommunications
Wherever applicable, numbers have been rounded off to the nearest whole number
TELECOMMUNICATION
GLOSSARY ā€¦ (2/2)
5454JANUARY 2017
Exchange rates (Fiscal Year)
For updated information, please visit www.ibef.org
EXCHANGE RATES
Exchange rates (Calendar Year)
TELECOMMUNICATION
Year INR equivalent of one USD
2004ā€“05 44.81
2005ā€“06 44.14
2006ā€“07 45.14
2007ā€“08 40.27
2008ā€“09 46.14
2009ā€“10 47.42
2010ā€“11 45.62
2011ā€“12 46.88
2012ā€“13 54.31
2013ā€“14 60.28
2014-15 61.06
2015-16 65.46
2016-2017E 66.95
Source: Reserve bank of India,
Average for the year
Year INR equivalent of one USD
2005 43.98
2006 45.18
2007 41.34
2008 43.62
2009 48.42
2010 45.72
2011 46.85
2012 53.46
2013 58.44
2014 61.03
2015 64.15
2016 (Expected) 67.22
5555JANUARY 2017
India Brand Equity Foundation (ā€œIBEFā€) engaged TechSci to prepare this presentation and the same has been
prepared by TechSci in consultation with IBEF.
All rights reserved. All copyright in this presentation and related works is solely and exclusively owned by IBEF. The
same may not be reproduced, wholly or in part in any material form (including photocopying or storing it in any
medium by electronic means and whether or not transiently or incidentally to some other use of this presentation),
modified or in any manner communicated to any third party except with the written approval of IBEF.
This presentation is for information purposes only. While due care has been taken during the compilation of this
presentation to ensure that the information is accurate to the best of TechSci and IBEFā€™s knowledge and belief, the
content is not to be construed in any manner whatsoever as a substitute for professional advice.
TechSci and IBEF neither recommend nor endorse any specific products or services that may have been mentioned in
this presentation and nor do they assume any liability or responsibility for the outcome of decisions taken as a result of
any reliance placed on this presentation.
Neither TechSci nor IBEF shall be liable for any direct or indirect damages that may arise due to any act or omission
on the part of the user due to any reliance placed or guidance taken from any portion of this presentation.
For updated information, please visit www.ibef.org
DISCLAIMER
TELECOMMUNICATION

More Related Content

What's hot

Report on telecom sector
Report on telecom sectorReport on telecom sector
Report on telecom sectorsumanmalviya
Ā 
INDIAN TELECOM INDUSTRY
INDIAN TELECOM INDUSTRYINDIAN TELECOM INDUSTRY
INDIAN TELECOM INDUSTRYBHOMA RAM
Ā 
Indian Telecom Industry
Indian Telecom IndustryIndian Telecom Industry
Indian Telecom Industry
Ashish Nangla
Ā 
Indian telecom industry past, present & future
Indian telecom industry  past, present & futureIndian telecom industry  past, present & future
Indian telecom industry past, present & future
Reeha Paul
Ā 
Telecom ppt
Telecom pptTelecom ppt
Telecom pptVikas Saini
Ā 
Major players in telecom industry
Major players in telecom industryMajor players in telecom industry
Major players in telecom industry
Zeeshanā€‹ Ali Patel
Ā 
Telecommunication industry analysis (india)
Telecommunication industry analysis (india)Telecommunication industry analysis (india)
Telecommunication industry analysis (india)
HarshitSingh378
Ā 
Indian Telecom Industry-A brief
Indian Telecom Industry-A briefIndian Telecom Industry-A brief
Indian Telecom Industry-A briefTrailukya Dutta
Ā 
Telecom Industry in India- A Brief Review
Telecom Industry in India- A Brief ReviewTelecom Industry in India- A Brief Review
Telecom Industry in India- A Brief Review
Rashmi Ranjan Moharana
Ā 
Indian Telecommunication Industry
Indian Telecommunication IndustryIndian Telecommunication Industry
Indian Telecommunication Industry
Himanshu Priyadarshi
Ā 
Indian telecom industry
Indian telecom industryIndian telecom industry
Indian telecom industry
Ravindra Kumar
Ā 
Indian Telecom Sector Analysis
Indian Telecom Sector AnalysisIndian Telecom Sector Analysis
Indian Telecom Sector Analysis
Gautam Shah
Ā 
Report on telecom sector
Report on telecom sectorReport on telecom sector
Report on telecom sector
Jonty Mohta
Ā 
Telecom industry marketing ppt
Telecom industry marketing  pptTelecom industry marketing  ppt
Telecom industry marketing ppt
guda Vamshi Netha
Ā 
Telecom Sector in India
Telecom Sector in IndiaTelecom Sector in India
Telecom Sector in India
Sandeep Sreenivasa
Ā 
Telecomsector in india
Telecomsector in indiaTelecomsector in india
Telecomsector in india
Hriday Vittal
Ā 
Telecom Sector Study
Telecom Sector StudyTelecom Sector Study
Telecom Sector Studymails2yamini
Ā 
Telecommunication in India
Telecommunication in IndiaTelecommunication in India
Telecommunication in India
Akshat Goel
Ā 
Telecom Industry in India
Telecom Industry in India Telecom Industry in India
Telecom Industry in India
Krishna Patel
Ā 
Presentation on telecom industry in india
Presentation on  telecom industry in india Presentation on  telecom industry in india
Presentation on telecom industry in india
Unitedworld School Of Business
Ā 

What's hot (20)

Report on telecom sector
Report on telecom sectorReport on telecom sector
Report on telecom sector
Ā 
INDIAN TELECOM INDUSTRY
INDIAN TELECOM INDUSTRYINDIAN TELECOM INDUSTRY
INDIAN TELECOM INDUSTRY
Ā 
Indian Telecom Industry
Indian Telecom IndustryIndian Telecom Industry
Indian Telecom Industry
Ā 
Indian telecom industry past, present & future
Indian telecom industry  past, present & futureIndian telecom industry  past, present & future
Indian telecom industry past, present & future
Ā 
Telecom ppt
Telecom pptTelecom ppt
Telecom ppt
Ā 
Major players in telecom industry
Major players in telecom industryMajor players in telecom industry
Major players in telecom industry
Ā 
Telecommunication industry analysis (india)
Telecommunication industry analysis (india)Telecommunication industry analysis (india)
Telecommunication industry analysis (india)
Ā 
Indian Telecom Industry-A brief
Indian Telecom Industry-A briefIndian Telecom Industry-A brief
Indian Telecom Industry-A brief
Ā 
Telecom Industry in India- A Brief Review
Telecom Industry in India- A Brief ReviewTelecom Industry in India- A Brief Review
Telecom Industry in India- A Brief Review
Ā 
Indian Telecommunication Industry
Indian Telecommunication IndustryIndian Telecommunication Industry
Indian Telecommunication Industry
Ā 
Indian telecom industry
Indian telecom industryIndian telecom industry
Indian telecom industry
Ā 
Indian Telecom Sector Analysis
Indian Telecom Sector AnalysisIndian Telecom Sector Analysis
Indian Telecom Sector Analysis
Ā 
Report on telecom sector
Report on telecom sectorReport on telecom sector
Report on telecom sector
Ā 
Telecom industry marketing ppt
Telecom industry marketing  pptTelecom industry marketing  ppt
Telecom industry marketing ppt
Ā 
Telecom Sector in India
Telecom Sector in IndiaTelecom Sector in India
Telecom Sector in India
Ā 
Telecomsector in india
Telecomsector in indiaTelecomsector in india
Telecomsector in india
Ā 
Telecom Sector Study
Telecom Sector StudyTelecom Sector Study
Telecom Sector Study
Ā 
Telecommunication in India
Telecommunication in IndiaTelecommunication in India
Telecommunication in India
Ā 
Telecom Industry in India
Telecom Industry in India Telecom Industry in India
Telecom Industry in India
Ā 
Presentation on telecom industry in india
Presentation on  telecom industry in india Presentation on  telecom industry in india
Presentation on telecom industry in india
Ā 

Viewers also liked

Telecom & spectrum presentation
Telecom & spectrum presentationTelecom & spectrum presentation
Telecom & spectrum presentation
MSLGROUP India
Ā 
India Social Media Report Edition 2 by Blogworks in assoc with NM Incite (A N...
India Social Media Report Edition 2 by Blogworks in assoc with NM Incite (A N...India Social Media Report Edition 2 by Blogworks in assoc with NM Incite (A N...
India Social Media Report Edition 2 by Blogworks in assoc with NM Incite (A N...
India Social
Ā 
Airtel
AirtelAirtel
Airtel
Rohit Rajeev
Ā 
Telecom group 2 section a
Telecom group 2 section aTelecom group 2 section a
Telecom group 2 section a
blackbat999
Ā 
Indian telecom story
Indian telecom storyIndian telecom story
Indian telecom story
Sarin Sio
Ā 
Social Media in India : Landscape Overview
Social Media in India   : Landscape OverviewSocial Media in India   : Landscape Overview
Social Media in India : Landscape Overview
NextBigWhat
Ā 
Wholesale Voice Trends 2017
Wholesale Voice Trends 2017Wholesale Voice Trends 2017
Wholesale Voice Trends 2017
TelecoDays
Ā 
Uttarakhand State Report February 2017
Uttarakhand State Report February 2017Uttarakhand State Report February 2017
Uttarakhand State Report February 2017
India Brand Equity Foundation
Ā 
Indian telecom industry
Indian telecom industryIndian telecom industry
Indian telecom industryrahulchawla89
Ā 
Dynamics of the Indian Telecom Industry
Dynamics of the Indian Telecom IndustryDynamics of the Indian Telecom Industry
Dynamics of the Indian Telecom Industryjmadari
Ā 
Measurement of performance of bharti airtel by using different ratios
Measurement of performance of bharti airtel by using different ratiosMeasurement of performance of bharti airtel by using different ratios
Measurement of performance of bharti airtel by using different ratiosPartha Pratim Mahanta
Ā 
Evolution of Social Media in India
Evolution of Social Media in IndiaEvolution of Social Media in India
Evolution of Social Media in India
Social Media Gurukul
Ā 
Social Media Statistics - India Study 2015
Social Media Statistics - India Study 2015Social Media Statistics - India Study 2015
Social Media Statistics - India Study 2015
IdeateLabs
Ā 
Entertainment Sectore Report - February 2017
Entertainment Sectore Report - February 2017Entertainment Sectore Report - February 2017
Entertainment Sectore Report - February 2017
India Brand Equity Foundation
Ā 
Telecom industry analysis
Telecom industry analysisTelecom industry analysis
Telecom industry analysisHeemanish Midde
Ā 
IPL 2015 - Social TV Report by Omnicom Media Group
IPL 2015 - Social TV Report by Omnicom Media GroupIPL 2015 - Social TV Report by Omnicom Media Group
IPL 2015 - Social TV Report by Omnicom Media Group
Avinash Jhangiani
Ā 
Airtel Presentation
Airtel PresentationAirtel Presentation
Airtel Presentation
Sayan Maiti
Ā 
Future of Social Media in India
Future of Social Media in India Future of Social Media in India
Future of Social Media in India
Meghana Bhat
Ā 

Viewers also liked (18)

Telecom & spectrum presentation
Telecom & spectrum presentationTelecom & spectrum presentation
Telecom & spectrum presentation
Ā 
India Social Media Report Edition 2 by Blogworks in assoc with NM Incite (A N...
India Social Media Report Edition 2 by Blogworks in assoc with NM Incite (A N...India Social Media Report Edition 2 by Blogworks in assoc with NM Incite (A N...
India Social Media Report Edition 2 by Blogworks in assoc with NM Incite (A N...
Ā 
Airtel
AirtelAirtel
Airtel
Ā 
Telecom group 2 section a
Telecom group 2 section aTelecom group 2 section a
Telecom group 2 section a
Ā 
Indian telecom story
Indian telecom storyIndian telecom story
Indian telecom story
Ā 
Social Media in India : Landscape Overview
Social Media in India   : Landscape OverviewSocial Media in India   : Landscape Overview
Social Media in India : Landscape Overview
Ā 
Wholesale Voice Trends 2017
Wholesale Voice Trends 2017Wholesale Voice Trends 2017
Wholesale Voice Trends 2017
Ā 
Uttarakhand State Report February 2017
Uttarakhand State Report February 2017Uttarakhand State Report February 2017
Uttarakhand State Report February 2017
Ā 
Indian telecom industry
Indian telecom industryIndian telecom industry
Indian telecom industry
Ā 
Dynamics of the Indian Telecom Industry
Dynamics of the Indian Telecom IndustryDynamics of the Indian Telecom Industry
Dynamics of the Indian Telecom Industry
Ā 
Measurement of performance of bharti airtel by using different ratios
Measurement of performance of bharti airtel by using different ratiosMeasurement of performance of bharti airtel by using different ratios
Measurement of performance of bharti airtel by using different ratios
Ā 
Evolution of Social Media in India
Evolution of Social Media in IndiaEvolution of Social Media in India
Evolution of Social Media in India
Ā 
Social Media Statistics - India Study 2015
Social Media Statistics - India Study 2015Social Media Statistics - India Study 2015
Social Media Statistics - India Study 2015
Ā 
Entertainment Sectore Report - February 2017
Entertainment Sectore Report - February 2017Entertainment Sectore Report - February 2017
Entertainment Sectore Report - February 2017
Ā 
Telecom industry analysis
Telecom industry analysisTelecom industry analysis
Telecom industry analysis
Ā 
IPL 2015 - Social TV Report by Omnicom Media Group
IPL 2015 - Social TV Report by Omnicom Media GroupIPL 2015 - Social TV Report by Omnicom Media Group
IPL 2015 - Social TV Report by Omnicom Media Group
Ā 
Airtel Presentation
Airtel PresentationAirtel Presentation
Airtel Presentation
Ā 
Future of Social Media in India
Future of Social Media in India Future of Social Media in India
Future of Social Media in India
Ā 

Similar to Telecommunication Sectore Report - January 2017

Telecommunication Sector Reports november-2016
Telecommunication Sector Reports november-2016Telecommunication Sector Reports november-2016
Telecommunication Sector Reports november-2016
India Brand Equity Foundation
Ā 
Telecommunication november-20163
Telecommunication november-20163Telecommunication november-20163
Telecommunication november-20163
Akshay Agrawal
Ā 
Telecommunication Sectore Report - February 2017
Telecommunication Sectore Report - February 2017Telecommunication Sectore Report - February 2017
Telecommunication Sectore Report - February 2017
India Brand Equity Foundation
Ā 
Telecommunication Sector Report - March 2017
Telecommunication Sector Report - March 2017Telecommunication Sector Report - March 2017
Telecommunication Sector Report - March 2017
India Brand Equity Foundation
Ā 
Telecommunication Sector Report April 2017
Telecommunication Sector Report April 2017 Telecommunication Sector Report April 2017
Telecommunication Sector Report April 2017
India Brand Equity Foundation
Ā 
Telecommunication Sector Report May 2017
Telecommunication Sector Report May 2017Telecommunication Sector Report May 2017
Telecommunication Sector Report May 2017
India Brand Equity Foundation
Ā 
Telecommunication Sector Report June 2017
Telecommunication Sector Report June 2017Telecommunication Sector Report June 2017
Telecommunication Sector Report June 2017
India Brand Equity Foundation
Ā 
Telecommunication Sector Report July 2017
Telecommunication Sector Report July 2017Telecommunication Sector Report July 2017
Telecommunication Sector Report July 2017
India Brand Equity Foundation
Ā 
Telecommunication Sector Report September 2017
Telecommunication Sector Report September 2017Telecommunication Sector Report September 2017
Telecommunication Sector Report September 2017
India Brand Equity Foundation
Ā 
Telecommunications Sector Report October 2017
Telecommunications Sector Report October 2017Telecommunications Sector Report October 2017
Telecommunications Sector Report October 2017
India Brand Equity Foundation
Ā 
Telecommunications Sector Report March 2018
Telecommunications Sector Report March 2018Telecommunications Sector Report March 2018
Telecommunications Sector Report March 2018
India Brand Equity Foundation
Ā 
Telecommunications Sector Report November 2017
Telecommunications Sector Report November 2017Telecommunications Sector Report November 2017
Telecommunications Sector Report November 2017
India Brand Equity Foundation
Ā 
Telecommunications Sector Report December 2017
Telecommunications Sector Report December 2017Telecommunications Sector Report December 2017
Telecommunications Sector Report December 2017
India Brand Equity Foundation
Ā 
Telecommunications Sector Report - January 2018
Telecommunications Sector Report - January 2018Telecommunications Sector Report - January 2018
Telecommunications Sector Report - January 2018
India Brand Equity Foundation
Ā 
Telecommunications Sector Report - September 2018
Telecommunications Sector Report - September 2018Telecommunications Sector Report - September 2018
Telecommunications Sector Report - September 2018
India Brand Equity Foundation
Ā 
Telecommunications Sector Report April 2018
Telecommunications Sector Report April 2018Telecommunications Sector Report April 2018
Telecommunications Sector Report April 2018
India Brand Equity Foundation
Ā 
Telecommunications Sector Report - July 2018
Telecommunications Sector Report - July 2018Telecommunications Sector Report - July 2018
Telecommunications Sector Report - July 2018
India Brand Equity Foundation
Ā 
Telecommunications Sector Report - October 2018
Telecommunications Sector Report - October 2018Telecommunications Sector Report - October 2018
Telecommunications Sector Report - October 2018
India Brand Equity Foundation
Ā 
Telecommunications Sector Report - April 2019
Telecommunications Sector Report - April 2019Telecommunications Sector Report - April 2019
Telecommunications Sector Report - April 2019
India Brand Equity Foundation
Ā 
Telecommunications Sector Report - November 2018
Telecommunications Sector Report - November 2018Telecommunications Sector Report - November 2018
Telecommunications Sector Report - November 2018
India Brand Equity Foundation
Ā 

Similar to Telecommunication Sectore Report - January 2017 (20)

Telecommunication Sector Reports november-2016
Telecommunication Sector Reports november-2016Telecommunication Sector Reports november-2016
Telecommunication Sector Reports november-2016
Ā 
Telecommunication november-20163
Telecommunication november-20163Telecommunication november-20163
Telecommunication november-20163
Ā 
Telecommunication Sectore Report - February 2017
Telecommunication Sectore Report - February 2017Telecommunication Sectore Report - February 2017
Telecommunication Sectore Report - February 2017
Ā 
Telecommunication Sector Report - March 2017
Telecommunication Sector Report - March 2017Telecommunication Sector Report - March 2017
Telecommunication Sector Report - March 2017
Ā 
Telecommunication Sector Report April 2017
Telecommunication Sector Report April 2017 Telecommunication Sector Report April 2017
Telecommunication Sector Report April 2017
Ā 
Telecommunication Sector Report May 2017
Telecommunication Sector Report May 2017Telecommunication Sector Report May 2017
Telecommunication Sector Report May 2017
Ā 
Telecommunication Sector Report June 2017
Telecommunication Sector Report June 2017Telecommunication Sector Report June 2017
Telecommunication Sector Report June 2017
Ā 
Telecommunication Sector Report July 2017
Telecommunication Sector Report July 2017Telecommunication Sector Report July 2017
Telecommunication Sector Report July 2017
Ā 
Telecommunication Sector Report September 2017
Telecommunication Sector Report September 2017Telecommunication Sector Report September 2017
Telecommunication Sector Report September 2017
Ā 
Telecommunications Sector Report October 2017
Telecommunications Sector Report October 2017Telecommunications Sector Report October 2017
Telecommunications Sector Report October 2017
Ā 
Telecommunications Sector Report March 2018
Telecommunications Sector Report March 2018Telecommunications Sector Report March 2018
Telecommunications Sector Report March 2018
Ā 
Telecommunications Sector Report November 2017
Telecommunications Sector Report November 2017Telecommunications Sector Report November 2017
Telecommunications Sector Report November 2017
Ā 
Telecommunications Sector Report December 2017
Telecommunications Sector Report December 2017Telecommunications Sector Report December 2017
Telecommunications Sector Report December 2017
Ā 
Telecommunications Sector Report - January 2018
Telecommunications Sector Report - January 2018Telecommunications Sector Report - January 2018
Telecommunications Sector Report - January 2018
Ā 
Telecommunications Sector Report - September 2018
Telecommunications Sector Report - September 2018Telecommunications Sector Report - September 2018
Telecommunications Sector Report - September 2018
Ā 
Telecommunications Sector Report April 2018
Telecommunications Sector Report April 2018Telecommunications Sector Report April 2018
Telecommunications Sector Report April 2018
Ā 
Telecommunications Sector Report - July 2018
Telecommunications Sector Report - July 2018Telecommunications Sector Report - July 2018
Telecommunications Sector Report - July 2018
Ā 
Telecommunications Sector Report - October 2018
Telecommunications Sector Report - October 2018Telecommunications Sector Report - October 2018
Telecommunications Sector Report - October 2018
Ā 
Telecommunications Sector Report - April 2019
Telecommunications Sector Report - April 2019Telecommunications Sector Report - April 2019
Telecommunications Sector Report - April 2019
Ā 
Telecommunications Sector Report - November 2018
Telecommunications Sector Report - November 2018Telecommunications Sector Report - November 2018
Telecommunications Sector Report - November 2018
Ā 

More from India Brand Equity Foundation

Tamil Nadu State report - April 2019
Tamil Nadu State report - April 2019Tamil Nadu State report - April 2019
Tamil Nadu State report - April 2019
India Brand Equity Foundation
Ā 
Steel Sector Report - April 2019
Steel Sector Report - April 2019Steel Sector Report - April 2019
Steel Sector Report - April 2019
India Brand Equity Foundation
Ā 
Services Sector Report - April 2019
Services Sector Report - April 2019Services Sector Report - April 2019
Services Sector Report - April 2019
India Brand Equity Foundation
Ā 
Real Estate Sector Report - April 2019
Real Estate Sector Report - April 2019Real Estate Sector Report - April 2019
Real Estate Sector Report - April 2019
India Brand Equity Foundation
Ā 
Rajasthan State Report - April 2019
Rajasthan State Report - April 2019Rajasthan State Report - April 2019
Rajasthan State Report - April 2019
India Brand Equity Foundation
Ā 
Railways Sector Report April 2019
Railways Sector Report April 2019Railways Sector Report April 2019
Railways Sector Report April 2019
India Brand Equity Foundation
Ā 
Power Sector Report - April 2019
Power Sector Report - April 2019Power Sector Report - April 2019
Power Sector Report - April 2019
India Brand Equity Foundation
Ā 
Nagaland State Report - April 2019
Nagaland State Report - April 2019Nagaland State Report - April 2019
Nagaland State Report - April 2019
India Brand Equity Foundation
Ā 
Meghalaya State Report April 2019
Meghalaya State Report April 2019Meghalaya State Report April 2019
Meghalaya State Report April 2019
India Brand Equity Foundation
Ā 
Infrastructure Sector Report - April 2019
Infrastructure Sector Report - April 2019Infrastructure Sector Report - April 2019
Infrastructure Sector Report - April 2019
India Brand Equity Foundation
Ā 
Media and Entertainment Sector report - April 2019
Media and Entertainment Sector report - April 2019Media and Entertainment Sector report - April 2019
Media and Entertainment Sector report - April 2019
India Brand Equity Foundation
Ā 
Manufacturing Sector Report - April 2019
Manufacturing Sector Report - April 2019Manufacturing Sector Report - April 2019
Manufacturing Sector Report - April 2019
India Brand Equity Foundation
Ā 
Manipur State Report - April 2019
Manipur State Report - April 2019Manipur State Report - April 2019
Manipur State Report - April 2019
India Brand Equity Foundation
Ā 
Himachal Pradesh State Report - April 2019
Himachal Pradesh State Report - April 2019Himachal Pradesh State Report - April 2019
Himachal Pradesh State Report - April 2019
India Brand Equity Foundation
Ā 
Gujarat State Report - April 2019
Gujarat State Report - April 2019Gujarat State Report - April 2019
Gujarat State Report - April 2019
India Brand Equity Foundation
Ā 
Gems and Jewellery Sector Report - April 2019
Gems and Jewellery Sector Report - April 2019Gems and Jewellery Sector Report - April 2019
Gems and Jewellery Sector Report - April 2019
India Brand Equity Foundation
Ā 
Engineering and Capital Goods Sector Report - April 2019
Engineering and Capital Goods Sector Report - April 2019Engineering and Capital Goods Sector Report - April 2019
Engineering and Capital Goods Sector Report - April 2019
India Brand Equity Foundation
Ā 
E Commerce Sector Report - April 2019
E Commerce Sector Report - April 2019E Commerce Sector Report - April 2019
E Commerce Sector Report - April 2019
India Brand Equity Foundation
Ā 
Delhi State Report - April 2019
Delhi State Report - April 2019Delhi State Report - April 2019
Delhi State Report - April 2019
India Brand Equity Foundation
Ā 
Chhattisgarh State Report - April 2019
Chhattisgarh State Report - April 2019Chhattisgarh State Report - April 2019
Chhattisgarh State Report - April 2019
India Brand Equity Foundation
Ā 

More from India Brand Equity Foundation (20)

Tamil Nadu State report - April 2019
Tamil Nadu State report - April 2019Tamil Nadu State report - April 2019
Tamil Nadu State report - April 2019
Ā 
Steel Sector Report - April 2019
Steel Sector Report - April 2019Steel Sector Report - April 2019
Steel Sector Report - April 2019
Ā 
Services Sector Report - April 2019
Services Sector Report - April 2019Services Sector Report - April 2019
Services Sector Report - April 2019
Ā 
Real Estate Sector Report - April 2019
Real Estate Sector Report - April 2019Real Estate Sector Report - April 2019
Real Estate Sector Report - April 2019
Ā 
Rajasthan State Report - April 2019
Rajasthan State Report - April 2019Rajasthan State Report - April 2019
Rajasthan State Report - April 2019
Ā 
Railways Sector Report April 2019
Railways Sector Report April 2019Railways Sector Report April 2019
Railways Sector Report April 2019
Ā 
Power Sector Report - April 2019
Power Sector Report - April 2019Power Sector Report - April 2019
Power Sector Report - April 2019
Ā 
Nagaland State Report - April 2019
Nagaland State Report - April 2019Nagaland State Report - April 2019
Nagaland State Report - April 2019
Ā 
Meghalaya State Report April 2019
Meghalaya State Report April 2019Meghalaya State Report April 2019
Meghalaya State Report April 2019
Ā 
Infrastructure Sector Report - April 2019
Infrastructure Sector Report - April 2019Infrastructure Sector Report - April 2019
Infrastructure Sector Report - April 2019
Ā 
Media and Entertainment Sector report - April 2019
Media and Entertainment Sector report - April 2019Media and Entertainment Sector report - April 2019
Media and Entertainment Sector report - April 2019
Ā 
Manufacturing Sector Report - April 2019
Manufacturing Sector Report - April 2019Manufacturing Sector Report - April 2019
Manufacturing Sector Report - April 2019
Ā 
Manipur State Report - April 2019
Manipur State Report - April 2019Manipur State Report - April 2019
Manipur State Report - April 2019
Ā 
Himachal Pradesh State Report - April 2019
Himachal Pradesh State Report - April 2019Himachal Pradesh State Report - April 2019
Himachal Pradesh State Report - April 2019
Ā 
Gujarat State Report - April 2019
Gujarat State Report - April 2019Gujarat State Report - April 2019
Gujarat State Report - April 2019
Ā 
Gems and Jewellery Sector Report - April 2019
Gems and Jewellery Sector Report - April 2019Gems and Jewellery Sector Report - April 2019
Gems and Jewellery Sector Report - April 2019
Ā 
Engineering and Capital Goods Sector Report - April 2019
Engineering and Capital Goods Sector Report - April 2019Engineering and Capital Goods Sector Report - April 2019
Engineering and Capital Goods Sector Report - April 2019
Ā 
E Commerce Sector Report - April 2019
E Commerce Sector Report - April 2019E Commerce Sector Report - April 2019
E Commerce Sector Report - April 2019
Ā 
Delhi State Report - April 2019
Delhi State Report - April 2019Delhi State Report - April 2019
Delhi State Report - April 2019
Ā 
Chhattisgarh State Report - April 2019
Chhattisgarh State Report - April 2019Chhattisgarh State Report - April 2019
Chhattisgarh State Report - April 2019
Ā 

Recently uploaded

PF-Wagner's Theory of Public Expenditure.pptx
PF-Wagner's Theory of Public Expenditure.pptxPF-Wagner's Theory of Public Expenditure.pptx
PF-Wagner's Theory of Public Expenditure.pptx
GunjanSharma28848
Ā 
Latino Buying Power - May 2024 Presentation for Latino Caucus
Latino Buying Power - May 2024 Presentation for Latino CaucusLatino Buying Power - May 2024 Presentation for Latino Caucus
Latino Buying Power - May 2024 Presentation for Latino Caucus
Danay Escanaverino
Ā 
äø€ęƔäø€åŽŸē‰ˆBirminghamęƕäøščƁä¼Æ꘎ēæ°å¤§å­¦|学院ęƕäøščÆęˆē»©å•å¦‚何办ē†
äø€ęƔäø€åŽŸē‰ˆBirminghamęƕäøščƁä¼Æ꘎ēæ°å¤§å­¦|学院ęƕäøščÆęˆē»©å•å¦‚何办ē†äø€ęƔäø€åŽŸē‰ˆBirminghamęƕäøščƁä¼Æ꘎ēæ°å¤§å­¦|学院ęƕäøščÆęˆē»©å•å¦‚何办ē†
äø€ęƔäø€åŽŸē‰ˆBirminghamęƕäøščƁä¼Æ꘎ēæ°å¤§å­¦|学院ęƕäøščÆęˆē»©å•å¦‚何办ē†
betoozp
Ā 
how to sell pi coins effectively (from 50 - 100k pi)
how to sell pi coins effectively (from 50 - 100k  pi)how to sell pi coins effectively (from 50 - 100k  pi)
how to sell pi coins effectively (from 50 - 100k pi)
DOT TECH
Ā 
äø€ęƔäø€åŽŸē‰ˆUOLęƕäøščƁ利ē‰©ęµ¦å¤§å­¦ęƕäøščÆęˆē»©å•å¦‚何办ē†
äø€ęƔäø€åŽŸē‰ˆUOLęƕäøščƁ利ē‰©ęµ¦å¤§å­¦ęƕäøščÆęˆē»©å•å¦‚何办ē†äø€ęƔäø€åŽŸē‰ˆUOLęƕäøščƁ利ē‰©ęµ¦å¤§å­¦ęƕäøščÆęˆē»©å•å¦‚何办ē†
äø€ęƔäø€åŽŸē‰ˆUOLęƕäøščƁ利ē‰©ęµ¦å¤§å­¦ęƕäøščÆęˆē»©å•å¦‚何办ē†
ydubwyt
Ā 
Intro_Economics_ GPresentation Week 4.pptx
Intro_Economics_ GPresentation Week 4.pptxIntro_Economics_ GPresentation Week 4.pptx
Intro_Economics_ GPresentation Week 4.pptx
shetivia
Ā 
when will pi network coin be available on crypto exchange.
when will pi network coin be available on crypto exchange.when will pi network coin be available on crypto exchange.
when will pi network coin be available on crypto exchange.
DOT TECH
Ā 
What price will pi network be listed on exchanges
What price will pi network be listed on exchangesWhat price will pi network be listed on exchanges
What price will pi network be listed on exchanges
DOT TECH
Ā 
how can I sell my pi coins for cash in a pi APP
how can I sell my pi coins for cash in a pi APPhow can I sell my pi coins for cash in a pi APP
how can I sell my pi coins for cash in a pi APP
DOT TECH
Ā 
Webinar Exploring DORA for Fintechs - Simont Braun
Webinar Exploring DORA for Fintechs - Simont BraunWebinar Exploring DORA for Fintechs - Simont Braun
Webinar Exploring DORA for Fintechs - Simont Braun
FinTech Belgium
Ā 
The European Unemployment Puzzle: implications from population aging
The European Unemployment Puzzle: implications from population agingThe European Unemployment Puzzle: implications from population aging
The European Unemployment Puzzle: implications from population aging
GRAPE
Ā 
Empowering the Unbanked: The Vital Role of NBFCs in Promoting Financial Inclu...
Empowering the Unbanked: The Vital Role of NBFCs in Promoting Financial Inclu...Empowering the Unbanked: The Vital Role of NBFCs in Promoting Financial Inclu...
Empowering the Unbanked: The Vital Role of NBFCs in Promoting Financial Inclu...
Vighnesh Shashtri
Ā 
Greek trade a pillar of dynamic economic growth - European Business Review
Greek trade a pillar of dynamic economic growth - European Business ReviewGreek trade a pillar of dynamic economic growth - European Business Review
Greek trade a pillar of dynamic economic growth - European Business Review
Antonis Zairis
Ā 
how can i use my minded pi coins I need some funds.
how can i use my minded pi coins I need some funds.how can i use my minded pi coins I need some funds.
how can i use my minded pi coins I need some funds.
DOT TECH
Ā 
Scope Of Macroeconomics introduction and basic theories
Scope Of Macroeconomics introduction and basic theoriesScope Of Macroeconomics introduction and basic theories
Scope Of Macroeconomics introduction and basic theories
nomankalyar153
Ā 
The secret way to sell pi coins effortlessly.
The secret way to sell pi coins effortlessly.The secret way to sell pi coins effortlessly.
The secret way to sell pi coins effortlessly.
DOT TECH
Ā 
what is the future of Pi Network currency.
what is the future of Pi Network currency.what is the future of Pi Network currency.
what is the future of Pi Network currency.
DOT TECH
Ā 
Poonawalla Fincorp and IndusInd Bank Introduce New Co-Branded Credit Card
Poonawalla Fincorp and IndusInd Bank Introduce New Co-Branded Credit CardPoonawalla Fincorp and IndusInd Bank Introduce New Co-Branded Credit Card
Poonawalla Fincorp and IndusInd Bank Introduce New Co-Branded Credit Card
nickysharmasucks
Ā 
The new type of smart, sustainable entrepreneurship and the next day | Europe...
The new type of smart, sustainable entrepreneurship and the next day | Europe...The new type of smart, sustainable entrepreneurship and the next day | Europe...
The new type of smart, sustainable entrepreneurship and the next day | Europe...
Antonis Zairis
Ā 
how can I sell pi coins after successfully completing KYC
how can I sell pi coins after successfully completing KYChow can I sell pi coins after successfully completing KYC
how can I sell pi coins after successfully completing KYC
DOT TECH
Ā 

Recently uploaded (20)

PF-Wagner's Theory of Public Expenditure.pptx
PF-Wagner's Theory of Public Expenditure.pptxPF-Wagner's Theory of Public Expenditure.pptx
PF-Wagner's Theory of Public Expenditure.pptx
Ā 
Latino Buying Power - May 2024 Presentation for Latino Caucus
Latino Buying Power - May 2024 Presentation for Latino CaucusLatino Buying Power - May 2024 Presentation for Latino Caucus
Latino Buying Power - May 2024 Presentation for Latino Caucus
Ā 
äø€ęƔäø€åŽŸē‰ˆBirminghamęƕäøščƁä¼Æ꘎ēæ°å¤§å­¦|学院ęƕäøščÆęˆē»©å•å¦‚何办ē†
äø€ęƔäø€åŽŸē‰ˆBirminghamęƕäøščƁä¼Æ꘎ēæ°å¤§å­¦|学院ęƕäøščÆęˆē»©å•å¦‚何办ē†äø€ęƔäø€åŽŸē‰ˆBirminghamęƕäøščƁä¼Æ꘎ēæ°å¤§å­¦|学院ęƕäøščÆęˆē»©å•å¦‚何办ē†
äø€ęƔäø€åŽŸē‰ˆBirminghamęƕäøščƁä¼Æ꘎ēæ°å¤§å­¦|学院ęƕäøščÆęˆē»©å•å¦‚何办ē†
Ā 
how to sell pi coins effectively (from 50 - 100k pi)
how to sell pi coins effectively (from 50 - 100k  pi)how to sell pi coins effectively (from 50 - 100k  pi)
how to sell pi coins effectively (from 50 - 100k pi)
Ā 
äø€ęƔäø€åŽŸē‰ˆUOLęƕäøščƁ利ē‰©ęµ¦å¤§å­¦ęƕäøščÆęˆē»©å•å¦‚何办ē†
äø€ęƔäø€åŽŸē‰ˆUOLęƕäøščƁ利ē‰©ęµ¦å¤§å­¦ęƕäøščÆęˆē»©å•å¦‚何办ē†äø€ęƔäø€åŽŸē‰ˆUOLęƕäøščƁ利ē‰©ęµ¦å¤§å­¦ęƕäøščÆęˆē»©å•å¦‚何办ē†
äø€ęƔäø€åŽŸē‰ˆUOLęƕäøščƁ利ē‰©ęµ¦å¤§å­¦ęƕäøščÆęˆē»©å•å¦‚何办ē†
Ā 
Intro_Economics_ GPresentation Week 4.pptx
Intro_Economics_ GPresentation Week 4.pptxIntro_Economics_ GPresentation Week 4.pptx
Intro_Economics_ GPresentation Week 4.pptx
Ā 
when will pi network coin be available on crypto exchange.
when will pi network coin be available on crypto exchange.when will pi network coin be available on crypto exchange.
when will pi network coin be available on crypto exchange.
Ā 
What price will pi network be listed on exchanges
What price will pi network be listed on exchangesWhat price will pi network be listed on exchanges
What price will pi network be listed on exchanges
Ā 
how can I sell my pi coins for cash in a pi APP
how can I sell my pi coins for cash in a pi APPhow can I sell my pi coins for cash in a pi APP
how can I sell my pi coins for cash in a pi APP
Ā 
Webinar Exploring DORA for Fintechs - Simont Braun
Webinar Exploring DORA for Fintechs - Simont BraunWebinar Exploring DORA for Fintechs - Simont Braun
Webinar Exploring DORA for Fintechs - Simont Braun
Ā 
The European Unemployment Puzzle: implications from population aging
The European Unemployment Puzzle: implications from population agingThe European Unemployment Puzzle: implications from population aging
The European Unemployment Puzzle: implications from population aging
Ā 
Empowering the Unbanked: The Vital Role of NBFCs in Promoting Financial Inclu...
Empowering the Unbanked: The Vital Role of NBFCs in Promoting Financial Inclu...Empowering the Unbanked: The Vital Role of NBFCs in Promoting Financial Inclu...
Empowering the Unbanked: The Vital Role of NBFCs in Promoting Financial Inclu...
Ā 
Greek trade a pillar of dynamic economic growth - European Business Review
Greek trade a pillar of dynamic economic growth - European Business ReviewGreek trade a pillar of dynamic economic growth - European Business Review
Greek trade a pillar of dynamic economic growth - European Business Review
Ā 
how can i use my minded pi coins I need some funds.
how can i use my minded pi coins I need some funds.how can i use my minded pi coins I need some funds.
how can i use my minded pi coins I need some funds.
Ā 
Scope Of Macroeconomics introduction and basic theories
Scope Of Macroeconomics introduction and basic theoriesScope Of Macroeconomics introduction and basic theories
Scope Of Macroeconomics introduction and basic theories
Ā 
The secret way to sell pi coins effortlessly.
The secret way to sell pi coins effortlessly.The secret way to sell pi coins effortlessly.
The secret way to sell pi coins effortlessly.
Ā 
what is the future of Pi Network currency.
what is the future of Pi Network currency.what is the future of Pi Network currency.
what is the future of Pi Network currency.
Ā 
Poonawalla Fincorp and IndusInd Bank Introduce New Co-Branded Credit Card
Poonawalla Fincorp and IndusInd Bank Introduce New Co-Branded Credit CardPoonawalla Fincorp and IndusInd Bank Introduce New Co-Branded Credit Card
Poonawalla Fincorp and IndusInd Bank Introduce New Co-Branded Credit Card
Ā 
The new type of smart, sustainable entrepreneurship and the next day | Europe...
The new type of smart, sustainable entrepreneurship and the next day | Europe...The new type of smart, sustainable entrepreneurship and the next day | Europe...
The new type of smart, sustainable entrepreneurship and the next day | Europe...
Ā 
how can I sell pi coins after successfully completing KYC
how can I sell pi coins after successfully completing KYChow can I sell pi coins after successfully completing KYC
how can I sell pi coins after successfully completing KYC
Ā 

Telecommunication Sectore Report - January 2017

  • 1. 11JANUARY 2017 TELECOMMUNICATION For updated information, please visit www.ibef.orgJANUARY 2017
  • 2. 22JANUARY 2017 For updated information, please visit www.ibef.org ļ¶ Executive Summaryā€¦ā€¦ā€¦ā€¦ā€¦ā€¦ā€¦ā€¦ā€¦ā€¦. 3 ļ¶ Advantage Indiaā€¦ā€¦ā€¦ā€¦ā€¦ā€¦ā€¦ā€¦ā€¦..ā€¦.ā€¦ 4 ļ¶ Market Overview and Trendsā€¦ā€¦ā€¦ā€¦..ā€¦.. 6 ļ¶ Porterā€™s Five Forces Analysisā€¦ā€¦ā€¦ā€¦ā€¦..22 ļ¶ Strategies Adoptedā€¦ā€¦ā€¦ā€¦ā€¦ā€¦ā€¦ā€¦ā€¦ā€¦24 ļ¶ Growth Driversā€¦ā€¦ā€¦ā€¦ā€¦ā€¦ā€¦ā€¦ā€¦.ā€¦ā€¦.. 26 ļ¶ Opportunitiesā€¦ā€¦ā€¦ā€¦ā€¦ā€¦ā€¦ā€¦ā€¦.ā€¦ā€¦ā€¦ 39 ļ¶ Success Storiesā€¦ā€¦ā€¦ā€¦ā€¦ā€¦ā€¦ā€¦ā€¦ā€¦ā€¦ 43 ļ¶ Useful Informationā€¦ā€¦ā€¦ā€¦ā€¦ā€¦ā€¦.ā€¦ā€¦... 49 TELECOMMUNICATION JANUARY 2017
  • 3. 33JANUARY 2017 For updated information, please visit www.ibef.org EXECUTIVE SUMMARY Second-largest subscriber base ā€¢ With a subscriber base of nearly 1058.86 million, as of March 2016, India accounted for the second-largest telecom network in the world Third-highest number of internet users ā€¢ With 342.65 million internet subscriptions, as of March 2016, India stood third-highest in terms of total internet users in 2016. India is expected to become the second largest country in terms of internet subscribers, with around 402 million internet users by December 2015 Most of the Internet accessed through mobile phones ā€¢ Mobile based Internet is a key component of Indian Internet usage, with seven out of eight users accessing internet from their mobile phones ā€¢ Since 2012, the share of time spent on watching videos on mobile devices has grown by 200 hours a year Rising penetration rate ā€¢ As of March 2016, urban tele-density stood at 154.01 per cent and rural tele-density at 51.37 per cent Source: Telecom Regulatory Authority of India, TechSci Research TELECOMMUNICATION Affordability and lower rates ā€¢ Availability of affordable smartphones and lower rates are expected to drive growth in the Indian telecom industry
  • 5. 55JANUARY 2017 Growing demand For updated information, please visit www.ibef.org ADVANTAGE INDIA Source: BMI (Business Monitor International) Report, TechSci Research, Internet Mobile Association of India (IAMAI) Notes: MNP - Mobile Number Portability Robust demand ā€¢ India is the worldā€™s second-largest telecommunications market, with 1.058 billion subscribers as of March, 2016 ā€¢ With 70 per cent of the population staying in rural areas, the rural market would be a key growth driver in the coming years Attractive opportunities ā€¢ Telecom penetration in the nationā€™s rural market is expected to increase to 70 per cent by 2017 from 51.37 per cent, as of March 2016 ā€¢ India became the second-largest internet market in December 2014 ā€¢ The government of India has introduced Digital India program under which all the sectors such as healthcare, retail, etc. will be connected through internet Policy support ā€¢ The government has been proactive in its efforts to transform India into a global telecommunication hub; prudent regulatory support has also helped ā€¢ National Telecom Policy 2012 calls for unified licensing, full MNP and free roaming High ratings ā€¢ The country has a strong telecommunication infrastructure ā€¢ In terms of telecommunication ratings, India ranks ahead of its peers in the West and Asia 2016 Number of subscribers: 1.058 Billion FY20F Number of subscribers: 1.3 billion Advantage India TELECOMMUNICATION
  • 6. MARKET OVERVIEW AND TRENDS TELECOMMUNICATION
  • 7. 77JANUARY 2017 For updated information, please visit www.ibef.org THE TELECOM MARKET SPLIT INTO THREE SEGMENTS Source: TechSci Research TELECOMMUNICATION ā€¢ Comprises establishments operating and maintaining switching and transmission facilities to provide direct communications via airwaves ā€¢ Consists of companies that operate and maintain switching and transmission facilities to provide direct communications through landlines, microwave or a combination of landlines and satellite link-ups ā€¢ Includes Internet Service Providers (ISPs) that offer broadband internet connections through consumer and corporate channels Mobile (wireless) Fixed-line (wireline) Internet services Telecom
  • 8. 88JANUARY 2017 For updated information, please visit www.ibef.org TELECOM SUBSCRIBER BASE EXPANDS SUBSTANTIALLY India is currently the second-largest telecommunication market and has the third highest number of internet users in the world Indiaā€™s telephone subscriber base expanded at a CAGR of 19.96 per cent, reaching 1058.86 million during FY07ā€“16 Tele-density (defined as the number of telephone connections for every hundred individuals) in India, increased from 17.9 in FY07 to 83.36 in FY16 In March 2016, total telephone subscription stood at 1058.86 million, while tele-density was at 83.36 percent TELECOMMUNICATION Source: Telecom Regulatory Authority of India, TechSci Research Notes: CAGR - Compound Annual Growth Rate Growth in total subscribers 205.86 300.49 429.72 621.28 846.32 951.34 898.02 846.32 996 1058.86 0 10 20 30 40 50 60 70 80 90 0 200 400 600 800 1000 1200 Telephone Subscriber (in million) Teledensity
  • 9. 99JANUARY 2017 For updated information, please visit www.ibef.org Wireless and wireline revenues (USD billion)Indian telecom sectorā€™s revenue grew 7.50 per cent to USD41.68 billion in FY15 as compared to USD38.78 billion in FY14 Wireless and wireline revenue increased at a CAGR of 8.91 per cent to USD38.8 billion over FY06ā€“14 Revenues from the telecom equipment is expected to be USD19 billion in FY15, which is further expected to touch USD30 billion in FY20. SURGING TELECOM REVENUES TELECOMMUNICATION Source: Telecom Regulatory Authority of India, TechSci Research Note: CAGR - Compound Annual Growth Rate; FY ā€“ Indian Financial Year (April ā€“ March); Figures mentioned are as per latest data available CAGR: 8.91% 19.6 23.3 32.1 33.2 33.3 37.7 40.8 39.1 38.8 FY06 FY07 FY08 FY09 FY10 FY11 FY12 FY13 FY14
  • 10. 1010JANUARY 2017 For updated information, please visit www.ibef.org In March 2016, Indiaā€™s telephone subscriber base reached 1058.86 million In March 2016, the wireless segment (97.62 per cent of total telephone subscriptions) dominated the market, with the wireline segment accounting for an overall share of 2.4 per cent Urban regions accounted for 57.29 per cent share in the overall telecom subscriptions in the country, while rural areas accounted for the remaining share WIRELESS SEGMENT DOMINATES THE MARKET TELECOMMUNICATION Source: Telecom Regulatory Authority of India, TechSci Research Composition of telephone subscribers (FY16) 55.6% 42.0% 2.0% 0.4% Urban Wireless Rural Wireless Urban Wireline Rural Wireline
  • 11. 1111JANUARY 2017 For updated information, please visit www.ibef.org WIRELESS SUBSCRIPTIONS WITNESS ROBUST GROWTH OVER THE YEARS TELECOMMUNICATION During FY07-16, wireless subscriptions in the country increased at a CAGR of 22.94 per cent, with the number of subscribers reaching to 1,058.85 million in FY16 In FY16, urban wireless teledensity stood at 148.73 while rural wireless teledensity stood at 50.88 India is the worldā€™s second largest smartphone market and is expected to have almost one billion unique mobile subscribers by 2020 Source: Telecom Regulatory Authority of India, TechSci Research Notes: CAGR - Compound Annual Growth Rate CAGR: 22.94% Wireless Subscription (in Million) 165 261 392 584 812 919 868 943.9 969.8 1058.9 FY07 FY08 FY09 FY10 FY11 FY12 FY13 FY14 FY15 FY16
  • 12. 1212JANUARY 2017 For updated information, please visit www.ibef.org WIRELESS TELEDENSITY GROWS OVER THE YEARS The mobile segmentā€™s teledensity surged 6 times from 14.6 per cent in FY07 to 81.38 per cent, in FY16 GSM services continue to dominate the wireless market with a 95.73 per cent share (as of March 2016); while CDMA services accounted for the remaining 4.27 per cent share TELECOMMUNICATION Source: Telecom Regulatory Authority of India, TechSci Research Notes: Teledensity - The number of telephone lines for every 100 people in a country, GSM - Global System for Mobile Communications, CDMA - Code Division Multiple Access Growth in wireless teledensity 81.38% 77.27% 75.43% 70.90% 76% 68% 49.70% 33.70% 22.80% 14.60% FY16 FY15 FY14 FY13 FY12 FY11 FY10 FY9 FY8 FY7
  • 13. 1313JANUARY 2017 For updated information, please visit www.ibef.org WHILE BHARTI AIRTEL DOMINATES WIRELESS SEGMENTā€¦ TELECOMMUNICATION As of March 2016, Bharti Airtel was the market leader, with a 24.31 per cent share in the total subscription, followed by Vodafone (19.15 per cent share) The top five players in the sector include - Bharti Airtel, Vodafone, Idea, Reliance, and BSNL ā€“ accounting for 78.74 per cent of the total subscribers in the country Source: Telecom Regulatory Authority of India, TechSci Research Notes: BSNL - Bharat Sanchar Nigam Limited Wireless market share in terms of total subscribers (FY16) 24.31% 19.15% 16.94% 9.91% 8.43% 8.35% 5.81% 5.07% 0.74% 0.64% 0.34% 0.31% Bharti Airtel Vodafone Idea Reliance Aircel BSNL Tata Telewings Sistema Videocon MTNL Quadrant Telenor
  • 14. 1414JANUARY 2017 For updated information, please visit www.ibef.org BSNL DOMINATES FIXED-LINE SEGMENT TELECOMMUNICATION Fixed-line segment subscription and teledensity (FY16) Total fixed-line subscription stood at 25.95 million, while teledensity reached 2.06 per cent due to wide usability of the wireless segment in FY16 BSNL is the market leader with a 60.28 per cent share, followed by MTNL (13.60 per cent) BSNL, MTNL, and Bharti together account for 87.46 per cent of the total fixed-line market Fixed-line market share (FY16) 41 39 38 37 35 32 30 28 27 25.95 0 0.5 1 1.5 2 2.5 3 3.5 4 0 5 10 15 20 25 30 35 40 45 FY07 FY08 FY09 FY10 FY11 FY12 FY13 FY14 FY15 FY16* Wireline subscription (in million) Wireline density- RHS Bharti 58.52% 14.52% 13.89% 6.83% 4.64% 1.00% 0.36% 0.23% BSNL MTNL Bharti Tata Reliance Quadrant Vodafone Sistema MTNL Bharti Source: Telecom Regulatory Authority of India, TechSci Research Notes: BSNL - Bharat Sanchar Nigam Limited FY16* - as on March 2016
  • 15. 1515JANUARY 2017 For updated information, please visit www.ibef.org NUMBER OF INTERNET SUBSCRIBERS INCREASING AT A FAST PACE TELECOMMUNICATION Internet subscriptions (in Million) The number of Internet subscribers in the country increased at a CAGR of 44.56 per cent, with the number reaching 342.65 million in March, 2016 from 8.6 million in 2006 By December 2015, the number of internet users is anticipated to reach 402 million. This is expected to reach 462 million by the end of June 2016 with the increasing number of subscribers coming online especially through mobile devices Source: Telecom Regulatory Authority of India, Business Monitor International, TechSci Research Including Internet Access by Wireless Phone Subscribers, CAGR - Compound Annual Growth Rate; BSNL - Bharat Sanchar Nigam Ltd, Internet live stats CAGR: 50.6% 8.6 10.4 12.9 15.2 18.7 22.4 25.3 239 267 302.4 342.65 2006 2007 2008 2009 2010 2011 2012 2013 2014 2015 2016
  • 16. 1616JANUARY 2017 STRONG GROWTH IN BROADBAND DRIVES INTERNET ACCESS REVENUES For updated information, please visit www.ibef.org TELECOMMUNICATION Broadband subscription in the country witnessed an increase at a CAGR of 23.31 per cent during FY07ā€“16 (till March 2016) Source: Telecom Regulatory Authority of India, TechSci Research Notes: CAGR - Compound Annual Growth Rate CAGR: 23.31% Wired broadband subscriptions (in million) 3.1 5.5 7.8 10.9 13.4 15 15.1 14.9 15.52 20.44 FY07 FY08 FY09 FY10 FY11 FY12 FY13 FY14 FY15 FY16ā½Ā¹ā¾
  • 17. 1717JANUARY 2017 For updated information, please visit www.ibef.org BHARTI ACCOUNTS FOR MAJOR SHARE IN BROADBAND SUBSCRIPTIONS As of March 2016, Bharti accounted for the largest share of 25.7 per cent in the total broadband market of India Vodafone accounted for the second-largest share of 18.54 per cent in the countryā€™s broadband market, during the same period TELECOMMUNICATION Source: Telecom Regulatory Authority of India, TechSci Research Notes: BSNL - Bharat Sanchar Nigam Ltd, Market break-up by broadband subscriptions (wired and wireless) (FY16) 25.69% 18.54% 15.31% 13.59% 10.40% 16.48% Bharti Vodafone Idea BSNL Reliance Others
  • 18. 1818JANUARY 2017 For updated information, please visit www.ibef.org KEY COMPANIES IN THE MARKET TELECOMMUNICATION Company Ownership Presence Mahanagar Telephone Nigam Ltd (MTNL) Government (56.3%), Life Insurance Corporation (18.8%) Fixed-line and mobile telephony (in Delhi and Mumbai), data and Internet Bharat Sanchar Nigam Ltd (BSNL) Government (100%) Fixed-line and mobile telephony (GSM ā€“ outside Delhi and Mumbai), data and Internet in 22 circles Reliance Communications ADAG Group (approximately 59.70%) Mobile (CDMA) and broadband Bharti Airtel Bharti Group (43.72%), Pastel Ltd (14.79%), Indian Continent Investment (6.65%) Broadband and mobile (GSM) in 22 circles Vodafone India Vodafone (84.5%), Piramal Enterprises (11.0%) Broadband and mobile (GSM) in 22 circles Source: Companiesā€™ websites, Bloomberg, TechSci Research
  • 19. 1919JANUARY 2017 For updated information, please visit www.ibef.org NOTABLE TRENDS IN THE INDIAN TELECOM SECTOR ā€¦ (1/2) TELECOMMUNICATION Green Telecom ā€¢ The green telecom concept is aimed at reducing carbon footprint of the telecom industry through lower energy consumption ā€¢ Tata has invested around USD16.38 million to convert its 10,000 base stations from indoor to outdoor to reduce energy consumption and carbon footprint across its 20 telecom circles in India so far Expansion to Rural Markets ā€¢ There are over 62,443 uncovered villages in India; these would be provided with village telephone facility with subsidy support from the governmentā€™s Universal Service Obligation Fund (thereby increasing rural teledensity) ā€¢ In March 2016, the rural subscriber base accounted for 42.42 per cent of the total subscriber base, thereby fuelling growth across the sector ā€¢ The most significant recent developments in wireless communication include BWA technologies such as WiMAX and LTE ā€¢ In 2015, Airtel launched its 4G services in 296 cities across the India ā€¢ In 2015, BSNL started its first 4G Wireless Broadband Internet Service- WiMax ā€¢ Reliance Jio, has launched 4G services across pan- India as on December 2015 Source: TechSci Research Notes: BWA - Broadband Wireless Access, TRAI - Telecom Regulatory Authority of India Emergence of BWA Technologies ā€¢ IoT is the concept of electronically interconnected and integrated machines, which can help in gathering and sharing data. The Indian Government is planning to develop 100 smart city projects and has earmarked USD1.09 billion in the current budget, where IoT would play a vital role in development of those cities. Internet Of Things (IOT)
  • 20. 2020JANUARY 2017 For updated information, please visit www.ibef.org TELECOMMUNICATION NOTABLE TRENDS IN THE INDIAN TELECOM SECTOR ā€¦ (2/2) Telecom Finance Commission ā€¢ Department of Telecommunication is planning to issue a global tender for inviting applications for setting up a Telecom Finance Corporation (TFC). The government has fixed a deadline according to which TFC is expected to be operational by March 31, 2017 Rising investments ā€¢ Vodafone one of the leading players in the telecom sector in India, has disclosed its plans to invest USD1310 million to upgrade and expand Vodafone India network coverage and USD655 million to upgrade its technology centre Outsourcing non-core activities ā€¢ As part of the recent outsourcing trend, operators have outsourced functions such as network maintenance, IT operations, and customer service Mobile banking ā€¢ Availability of affordable smartphones, along with a rise in the security level of mobile transactions, is expected to boost growth of transactions conducted via phones, with the overall transaction value being tripled in 2014. In December 2015, 39.5 million mobile banking transactions were done, as compared to 16.8 million in December 2015. ā€¢ In May 2016, about 37 lakh mobile banking transaction attempts were able to reach NPCIā€™s platform Source: ā€™Searching for New Frontiers of growth: Indian Banksā€™- PwC, TechSci Research, Reserve Bank of India Note: NPCI - National Payment Corporation of India
  • 21. 2121JANUARY 2017 For updated information, please visit www.ibef.org EMERGENCE OF TOWER INDUSTRY TELECOMMUNICATION A surge in the subscriber base has necessitated network expansion covering a wider area, thereby creating a need for significant investment in telecom infrastructure To curb costs and focus on core operations, telecom companies have been segregating their tower assets into separate companies. For example: Reliance Communications has decided to finalise a deal to sell its stake in Reliance Infratel. The value of the deal is around USD3.68 billion Creating separate tower companies has helped telecom companies lower operating cost and improve capital structure; this has also provided an additional revenue stream Inspired by the success seen by Indian players in towers business, most of the operators around the world are replicating the model To reduce the carbon footprint for telecom infrastructure, including mobile towers, on 1st January, 2017, TRAI (The Telecom Regulatory Authority of India), announced to bring consultation paper, that will review the issues related to carbon footprint. Emergence of tower industry Rising competition Higher operating cost and debt burden Focus on tower sharing to reduce costs Segregation of towers into separate companies Source: TechSci Research
  • 22. PORTER FIVE FORCES ANALYSIS TELECOMMUNICATION
  • 23. 2323JANUARY 2017 For updated information, please visit www.ibef.org PORTERā€™S FIVE FORCES ANALYSIS Source: TechSci Research Note: VoIP ā€“ Voice Over Internet Protocol TELECOMMUNICATION Competitive Rivalry ā€¢ Customersā€™ low switching cost and price sensitivity are increasing competition among players ā€¢ High exit barriers are also intensifying competition ā€¢ There are around 6 to 7 players in each region, leading to intense competition Threat of New Entrants Substitute Products Bargaining Power of Suppliers Bargaining Power of Customers ā€¢ Strict government regulations ā€¢ Extremely high infrastructure setup cost ā€¢ Difficulty in achieving economies of scale ā€¢ High bargaining power of suppliers as there are just a few suppliers in the sector ā€¢ High cost of switching suppliers ā€¢ Low switching cost and mobile number portability give customers high bargaining power ā€¢ Customers are price sensitive ā€¢ Hardly any threat of substitute products as there is no substitute available in the market Competitive Rivalry (High) Threat of New Entrants (Low) Threat of Substitute Products (Low) Bargaining Power of Customers (High) Bargaining Power of Suppliers (High)
  • 25. 2525JANUARY 2017 For updated information, please visit www.ibef.org STRATEGIES ADOPTED Source: Company websites, TechSci Research Notes: CDMA ā€“ Code Division Multiple Access, GSM - Global System for Mobile Communication TELECOMMUNICATION ā€¢ Players are using innovative marketing strategies to succeed in this sector. For example, ā€¢ In August 2015, Idea Cellular launched new campaign ā€œGet idea and danceā€ ā€¢ Airtel launched new ad campaign ā€œAirtel myPlan Familyā€ ā€¢ Players differentiate themselves by providing different services to customers. For example, ā€¢ In 2015, Airtel India launched a mobile app ā€œWynk Moviesā€, it is a library that includes videos and movies ā€¢ In November 2015, Vodafone launched ā€œChoose Your Numberā€ facility where pre paid and post paid customers get numbers of their own choice ā€¢ Players price their products very carefully due to the price sensitive nature of customers and high competition in the sector. Players generally go for price war. For example, ā€¢ In December 2016, Micromax launched low cost 4G Volte Smartphones, with a pre-activated Reliance Jio Sim offer of free voice calls and data. These smartphones are launched in the range of USD67.21 to USD114.57 ā€¢ To compete with Airtel 4G services, Vodafone launched ā€˜Double Dataā€™ scheme for its prepaid customers where users will get double data pack at the same price. ā€¢ Companies such as Reliance Jio, Airtel have already launched 4G technology at very competitive prices ā€¢ In September 2016, Reliance Jio 4G network plans have been launched by the companyā€™s chairman Mr. Mukesh Ambani. Free domestic voice calls have been offered by Jio. No charge or deduction of data would be done for making voice calls to any network across the country. Also, the company has offered cheaper data plans and tariff plans ranging from USD2.28 to USD76.37 per month. As of October 2016, the companyā€™s subscriber base had crossed 16 million customers Marketing strategy Differentiation Pricing strategy
  • 27. 2727JANUARY 2017 For updated information, please visit www.ibef.org SECTOR BENEFITS FROM RISING INCOME, GROWING YOUNG POPULATION TELECOMMUNICATION Growing demand Inviting Resulting in Growing demand Increasing investments Policy support Higher real income and changing lifestyles Growing young population Increasing MOU and data usage Reduction in license fee Relaxed FDI Norms Encourages firms to expand to rural areas Higher FDI inflows Increasing M&A activity Notes: FDI - Foreign Direct Investment, MOU - Minutes of Use per month and per subscriber, M&A - Mergers and Acquisitions
  • 28. 2828JANUARY 2017 For updated information, please visit www.ibef.org RISING INCOME FUELS DEMAND FOR TELECOM SERVICES Rising per capita income in India (USD)Incomes have risen at a brisk pace in India and will continue rising given the countryā€™s strong economic growth prospects. Nominal per capita income have recorded a CAGR of 8.87 per cent over 2000ā€“15 Increasing income has been a key determinant of demand growth in the telecommunication sector in India The IMF estimates nominal per capita income in India to expand at a CAGR of 4.94 per cent during FY10ā€“FY19 Per capita income in the country is expected to grow at a CAGR of 8.1 per cent during FY15-FY19 Per capita income in the country is estimated at USD1,747.5 in FY16 TELECOMMUNICATION Source: IMF, TechSci Research Notes: CAGR - Compound Annual Growth Rate, F ā€“ Forecast, E - Estimate 1430.2 1552.5 1514.8 1504.5 1600.9 1617.3 1747.5 1874.9 2026.7 2207.6 -4.0% -2.0% 0.0% 2.0% 4.0% 6.0% 8.0% 10.0% 0.0 500.0 1000.0 1500.0 2000.0 2500.0 GDP per capita, current prices Growth Rate
  • 29. 2929JANUARY 2017 For updated information, please visit www.ibef.org INCREASING INCOME AND GROWING RURAL MARKET ā€“ DEMAND DRIVERS Indian residents shifting from low to high income groups (%) The emergence of an affluent middle class is triggering demand for the mobile and internet segments A young, growing population is aiding this trend (especially demand for smart phones) TELECOMMUNICATION Source: McKinsey Quarterly Report, TechSci Research Note: Mobile Users Come of Ageā€™ February 2011 Million Household, 100% 273 322244 1% 3% 7%2% 6% 17%23% 25% 29% 43% 40% 32% 30% 26% 15% 2015 2020 2030 Globals(>22065.3) Strivers(11032.7-22065.3) Seekers(4413.1-11032.7) Aspirers(1985.9-4413.1) Deprived(<1985.9)
  • 30. 3030JANUARY 2017 For updated information, please visit www.ibef.org INCREASING INTERNET REVENUES AND SUBSCRIPTIONS MVAS revenues (in USD Billion)The Mobile Value Added Services (MVAS) industry has expanded at a CAGR of 30.93 per cent to USD9.5 billion by 2015 from USD1.1 billion in 2007 The share of non-voice revenues, which currently stands at around 10 per cent of telecom operatorsā€™ revenues, is estimated to rise to more than 30 per cent in the next five to seven years A decline in the prices of smartphones and data subscription rates is likely to drive demand for MVAS TELECOMMUNICATION Source: Wipro Technologies, The Internet and Mobile Association of India, TechSci Research Notes: CAGR - Compound Annual Growth Rate, MVAS - Mobile Value-Added Services, E - Estimate, F - Forecast CAGR: 30.93% 1.1 1.7 1.9 3.2 4.2 4.9 6.2 7.8 9.5 2007 2008 2009 2010 2011 2012 2013 2014 2015E
  • 31. 3131JANUARY 2017 For updated information, please visit www.ibef.org STRONG POLICY SUPPORT CRUCIAL TO THE SECTORā€™S DEVELOPMENT ā€¦ (1/3) To compensate the consumers in case of call drop ā€¢ In October 2015, Telecom Regulatory Authority of India announced an amendment for Telecom Consumer Protection Regulations 2012 according to which mobile service operators have to provide compensation to the users in case of call drop. ā€¢ The formulated regulation would be effective from January, 2016. Standards of quality wireline and wireless services ā€¢ In 2015, Telecom Regulatory Authority of India made regulations to amend the Standards of quality of wireline (telephone service) and cellular mobile telephone services. These regulations has been laid down to ensure better and effective compliance with the quality of service regulations and to protect the interest of the customers Relaxed FDI norms ā€¢ FDI cap in the telecom sector has been increased to 100 per cent from 74 per cent; out of 100 per cent, 49 per cent will be done through automatic route and the rest will be done through the FIPB approval route ā€¢ FDI of up to 100 per cent is permitted for infrastructure providers offering dark fibre, electronic mail and voice mail Notes: FDI - Foreign Direct Investment, FIPB - Foreign Investment Promotion Board Source: TRAI, TechSci Research TELECOMMUNICATION
  • 32. 3232JANUARY 2017 For updated information, please visit www.ibef.org TELECOMMUNICATION Telecommunication Tariff Order ā€¢ In 2015, TRAI passed the telecommunication tariff (16th amendment) order, according to which, every service provider should offer a special roaming tariff plan to its prepaid and post-paid customers and on payment of fixed charge for special roaming tariff plan national roaming should be free Set up internet connections ā€¢ The Department of Information Technology intends to set up over 1 million internet- enabled common service centres across India as per the National e-Governance Plan ā€¢ On 8th August 2016, the Telecom Regulatory Authority of India (Trai) made the 10th amendment to the TCPR (Telecom Consumers Protection Regulations) permitting telecom companies to offer data packs having maximum validity of 365 days Reduction in license fees ā€¢ In January 2015, the Government of India recommended reduction in license fees of telecom operators by 6 per cent, telecom operators currently pay 8 per cent of adjusted gross revenue as licence fee ā€¢ The issuance of several international and national long-distance licenses has created opportunities and attracted new companies into the market Notes: USOF - Universal Service Obligation Fund; OFC - Optical Fibre Cable, WiMAX - Worldwide Interoperability for Microwave Access Telecommunications Source: TRAI, TechSci Research STRONG POLICY SUPPORT CRUCIAL TO THE SECTORā€™S DEVELOPMENT ā€¦ (2/3)
  • 33. 3333JANUARY 2017 For updated information, please visit www.ibef.org TELECOMMUNICATION Financial support ā€¢ The USOF is expected to extend ļ¬nancial support to operators providing services in rural areas and encourage active infrastructure sharing among operators ā€¢ TRAI has recommended that USO levy component to be reduced from 5 per cent to 3 per cent of annual revenues for all the licenses from April 2015 Enhanced spectrum limit ā€¢ The prescribed limit on spectrum would be increased from 6.2MHz to 2x8 MHz (paired spectrum) for GSM technology in all areas other than Delhi and Mumbai, where it will be 2x10MHz (paired spectrum) ā€¢ Telecom players can, however, obtain additional frequency; there will be an auction of spectrum subject to the limits prescribed for the merger of licenses ā€¢ As of October 2016, telecom operators like Vodafone and Tata Teleservices purchased spectrum worth USD 1.51 billion and USD 0.34 billion, respectively, from the government Telecommunication amendment order for broadcasting and cable services ā€¢ In 2015, telecom authority issued this order mandating every DTH operator to specify the tariff for supply and installation of the customer premises equipment. DTH operator should specify the refundable security deposit, installation charges, monthly rental charge and activation Source: TRAI, TechSci Research Notes: USOF - Universal Service Obligation Fund; OFC - Optical Fibre Cable STRONG POLICY SUPPORT CRUCIAL TO THE SECTORā€™S DEVELOPMENT ā€¦ (3/3)
  • 34. 3434JANUARY 2017 For updated information, please visit www.ibef.org NATIONAL TELECOM POLICY - 2012 Source: Digital Dawn, KPMG Report 2013, TechSci Research TELECOMMUNICATION ā€˜Broadband for allā€™ with a minimum download speed of 2Mbps Unified licensing, delinking of spectrum from license, online real-time submission and processing Aims at a ā€˜One Nation- One licenseā€™ regime with no roaming charges and nation wide number portability Increase rural teledensity from 39 to 70% by 2017, and 100% by 2020 Liberalisation of spectrum, and convergence of network, services and devices National Telecom Policy - 2012
  • 35. 3535JANUARY 2017 For updated information, please visit www.ibef.org Process of M2M Roadmap Formulation Source: Digital Dawn, KPMG Report 2013, TechSci Research TELECOMMUNICATION Policy & Regulatory Committee Draft roadmap and open consultation through web Consultation with Industry bodies (COAL, FICCI, AUSPI, ASSOCHAM) /Other Stakeholders Firming up of issues & viewpoints through Questionnaire to Stakeholders Seminars & Workshops on M2M Input from consultative committee & working groups Input from various TEC committees on different issues Inputs from DeitY and Industry stakeholders on draft documents National Telecom M2M Roadmap
  • 36. 3636JANUARY 2017 For updated information, please visit www.ibef.org FOREIGN INVESTMENTS FLOWING IN ā€¦ (1/2) Cumulative FDI inflows into the telecom sector over April 2000ā€“March 2016, totalled to USD18.38 billion During this period, FDI into the sector accounted for a share of 6.4 per cent of total FDI inflows into the country, till March 2016 Between April 2014 to March 2016, Telecommunication sector attracted FDI inflows of around USD 6.97 billion. TELECOMMUNICATION Source: Department of Industrial Policy & Promotion, TechSci Research Note: FY16 - Data mentioned is from April 2000 ā€“ September 2016 Cumulative FDI inflows into telecommunication (USD million) 9872.49 10,589.27 12,552.19 12,856.06 14,163.01 17,058.03 21,169.00 FY10 FY11 FY12 FY13 FY14 FY15 FY16
  • 37. 3737JANUARY 2017 Source: Thomson Banker, Deal Tracker, Grant Thornton, TechSci Research Notes: M&A - Merger and Acquisition, PE - Private Equity TELECOMMUNICATION FOREIGN INVESTMENTS FLOWING IN ā€¦ (2/2) Target Acquirer Acquisition price (USD million) Division acquired Videocon Telecommunications Ltd-1800 MHz spectrum in six circles Bharti Airtel (2016) 660 100% stake Bharti Airtel's operations in Burkina Faso and Sierra Leone Orange SA (2016) 900 100% stake MTS Reliance Communication (2015) 736.98 8 ā€“ 10% stake Augere Wireless Bharti Airtel (2015) 21.3 million 100% stake Bharti Airtel SingTel(2013) 302 Increases stakes to 32.34% Bharti Airtel Qatar Foundation Endowment(2014) 1,260 PE deal ā€“ 5% stake Vodafone India Ltd Vodafone International Holdings (2014) 1,641 Increases stakes to 100% Foreign investment in India For updated information, please visit www.ibef.org As on September 2016, Reliance Communications merged operations with telecom operator Aircel. The merged entity plans to dilute 25 per cent of its equity by selling stake to Russian company, Sistema.
  • 38. 3838JANUARY 2017 For updated information, please visit www.ibef.org EXPANSION AND GROWTH STRATEGIES OF LEADING PLAYERS TELECOMMUNICATION New Call Telecom Investment decision ā€¢ In 2015, New Call Telecom has announced to invest USD300 million in India within next 12-18 months. The company has decided to invest in India to increase its presence. Along with investments, New Call Telecom has already acquired Nimbuzz (global mobile technology brand) and New Delhi based Ozone networks Vodafone India 4G launch, Reliance Jio 4G launch ā€¢ In January 2016, Vodafone India launched its 4G network services in Kolkata and Kozhikode (Kerala) following its successful implementation in other parts of Kerala such as Kochi and Thiruvananthapuram ā€¢ In September 2016, Reliance Jio launched 4G services across India, at comparatively cheaper rates. The company has targeted to acquire 100 million customers by March 2017. In addition to the existing plan India 2300 MHz spectrum and 1800 MHz in 14 circles, during the auction in 2016, Jio invested over USD1,527.7 million to acquire 1800 MHz spectrum in 6 circles and 800 MHz spectrum in 10 circles Mobile wallet by Vodafone ā€¢ Vodafone India has entered into an agreement with Walmart India to make payments using M-Pesa mobile wallet services. Under this agreement, Vodafone M-Pesa will offer safe, secure and convenient transactions and on placing an order with Walmart India, Vodafone M-Pesa agent will reach out to customer and cash in into his M-Pesa account Source: Thomson Banker, Deal Tracker, TechSci Research Note: M&A - Merger and Acquisition New Entrant in the Smartphone Market ā€¢ China based companies such as Xiaomi, One Plus, OPPO, Huawei, etc. have launched their Smartphones in India. ā€¢ Domestic Players such as Micromax, Karbonn and Lava are the top three budget smartphone companies in India
  • 40. 4040JANUARY 2017 OPPORTUNITIES ACROSS SEGMENTS IN THE INDUSTRY ā€¦ (1/2) For updated information, please visit www.ibef.org TELECOMMUNICATION ā€¢ The number of wireless subscribers in India reached 1.033 billion, by March 2016 ā€¢ Of the total 1033.63 million subscribers in 2016, around 56.96 per cent subscribers are likely to be from urban areas and the rest (43.04 per cent), from rural areas ā€¢ By 2017, rural tele-density is expected to reach 70 per cent and 100 per cent by 2020, growing from 43.05 per cent as of March 2016 ā€¢ By March 2016, rural wireless tele-density in the country increased to 50.88, while, the urban wireless tele-density reached to 148.73 during the same period ā€¢ Internet penetration is expected to grow steadily and is likely to be bolstered by government policy ā€¢ Number of broadband subscribers reached 149.75 million at the end of March 2016 Increasing mobile subscribers Untapped rural markets Rising internet penetration Source: KPMG, TRAI, TechSci Research
  • 41. 4141JANUARY 2017 For updated information, please visit www.ibef.org TELECOMMUNICATION OPPORTUNITIES ACROSS SEGMENTS IN THE INDUSTRY ā€¦ (2/2) ā€¢ Telecom infrastructure was expected to increase at a CAGR of 20 per cent to 571,000 towers during 2008ā€“15 ā€¢ TRAI has made several recommendations for the development of telecom infrastructure, including tax benefits and recognising telecom infrastructure as essential infrastructure ā€¢ The Indian Mobile Value-Added Services (MVAS) industry is expected to reach USD9.5 billion by 2015 from USD4.9 billion in 2012 ā€¢ Public cloud services in India generated USD730 million by December 2015. Indian public cloud services market is expected to reach USD1.9 billion by 2019. ā€¢ Telecom equipment market was estimated to be USD20 billion in 2015-16 ā€¢ It is anticipated to reach USD30 billion by 2020 ā€¢ Under Digital India programme, ā€˜every Indian has a smartphone by 2019ā€™ programme implemented Development of telecom infrastructure Growth in MVAS and cloud computing Telecom equipment market Source: Press information bureau, Government of India, TechSci Research Notes: VAS - Value-Added Services, NTP - National Telecom Policy ā€¢ In order to overcome the cash related problems being faced by people, due to demonetisation, Paytm launched a service through which consumers and merchants can pay and receive money instantly, without an internet connection ā€¢ This has enabled non- smartphone users to go cashless Growing Cashless Transactions
  • 42. 4242JANUARY 2017 MOBILE APPLICATION MARKET: FAST GROWING SEGMENT For updated information, please visit www.ibef.org TELECOMMUNICATION The mobile application (app) market is expected to expand at a CAGR of 49.62 per cent to USD330 million during 2014ā€“16 The mobile app market is estimated around USD245.6 million in 2015 The segmentā€™s growth is expected to be driven by increasing mobile connections and availability of low-range smartphones Over 100 million apps are downloaded every month across different platforms such as iOS, Blackberry, Nokia, and Android Source: Gartner, Deloitte, Assorted News Articles, TechSci Research Notes: CAGR - Compounded Annual Growth Rate, *CAGR is calculated in USD million terms, F - Forecast CAGR: 49.62% Mobile App Market Size (USD million) 147.4 245.60 330 2014 2015 2016(F)
  • 44. 4444JANUARY 2017 For updated information, please visit www.ibef.org BHARTI AIRTEL: AN INSPIRING SUCCESS STORY ā€¦ (1/2) TELECOMMUNICATION Set up in 1995, Bharti Airtel is worldā€™s leading mobile operator with presence in 20 countries It is the countryā€™s leading mobile operator, with a customer base of 357.4 million as of March 2016, and the worldā€™s third- largest telecom operator Revenues increased at a CAGR of 11.2 per cent during FY08-FY16 from USD6.3 billion in FY08 to USD14.7 billion in FY16 CAGR: 11.2% Source: Company website, TechSci Research Notes: CAGR - Compound Annual Growth Rate Note: (1) - Revenue is including eliminations Revenues (in USD Billion)Major segments(1) (FY16) 6.3 7.6 8.3 12.3 14.3 14.2 14.2 15.1 14.7 FY08 FY09 FY10 FY11 FY12 FY13 FY14 FY15 FY16 58.10% 8.1% 5.8% 4.9% 3.0% 20.1% Mobile Services Airtel Business Tower Infrastructure Services Telemedia Services Digital TV Services Others
  • 45. 4545JANUARY 2017 For updated information, please visit www.ibef.org TELECOMMUNICATION Bharti Airtel had over 251.2 million subscribers, as of March 2016 The companyā€™s overall subscriber base in the country expanded at a CAGR of 19.11 per cent, reaching 251.2 million from 62 million over FY08ā€“FY16 Bharti Airtel has a mobile subscriber base of 200 million in India Bharti Airtel bought optical network gear from Ciena Communications Inc in 2014 to expand capacity of its i2i undersea cable network that connects India to Singapore The company had expansion plans in Africa to tap the huge growth potential It became the first Indian telecom company to offer 4G service on mobile phones On 8th April, 2016, Bharti Airtel Ltd acquired 4G TD spectrum for eight circles namely Bihar, J&K, Tamil Nadu, West Bengal, Assam, North East, Andhra Pradesh and Orissa from Aircel Limited Source: Company website, TechSci Research Notes: CAGR - Compounded Annual Growth Rate BHARTI AIRTEL: AN INSPIRING SUCCESS STORY ā€¦ (2/2) CAGR: 19.11% Total subscribers (Million) 62 95 131 221 252 271 220 226 251 FY08 FY09 FY10 FY11 FY12 FY13 FY14 FY15 FY16 As of November 2016, the company signed a USD 60 million deal with Finnish gear maker ā€˜Nokiaā€™ to implement voice-over-LTE (VoLTE) calling technology
  • 46. 4646JANUARY 2017 For updated information, please visit www.ibef.org VODAFONE: INDIAā€™S THIRD-LARGEST MOBILE OPERATOR ā€¦ (1/2) TELECOMMUNICATION Established in 1994, Vodafone is one of Indiaā€™s leading mobile operators, with more than 188.2 million customers as of September 2015 Vodafone's revenues from India increased at a CAGR of 8.44 per cent to USD6.7 billion during FY08ā€“15 Source: Company website, TechSci Research Notes: CAGR - Compounded Annual Growth Rate CAGR: 8.44% Revenues (USD billion) 3.9 4.4 4.9 5.9 6.7 7.4 6.2 6.7 3.8 FY08 FY09 FY10 FY11 FY12 FY13 FY14 FY15 FY16* 5.9
  • 47. 4747JANUARY 2017 VODAFONE: INDIAā€™S THIRD-LARGEST MOBILE OPERATOR ā€¦ (2/2) For updated information, please visit www.ibef.org TELECOMMUNICATION Vodafoneā€™s customer subscription increased at a CAGR of 15.12 per cent to 188.2 million during FY08ā€“FY16(1) In September 2015, Vodafoneā€™s subscriber base stood at 188.2 million Vodafone has announced to launch its 4G services in Mumbai, Delhi, Kolkata, Kerala and Karnataka by December 2015 Gujarat, Uttar Pradesh, Maharashtra, and West Bengal together account for over 45 per cent of the total customer base Vodafone Group plans to invest heavily in the establishment of a fibre-optic network in India Vodafone has launched 4G services in Delhi, Kolkata, Karnataka and Kerala in February 2016. In May 2016, the company also planned to cover four circles of Gujarat, Haryana, UP (East) and West Bengal Source: Company website, TechSci Research Notes: FY16(1) represents data till Sep 2015, CAGR - Compounded Annual Growth Rate CAGR: 15.12% Total subscribers (million) 61 91 124 148 147 153 167 183 188.2 FY08 FY09 FY10 FY11 FY12 FY13 FY14 FY15 FY16*FY16
  • 48. 4848JANUARY 2017 MOBILE NUMBER PORTABILITY: A PARADIGM SHIFT IN INDIAN TELECOM For updated information, please visit www.ibef.org TELECOMMUNICATION Mobile Number Portability (MNP) in India was introduced in November 2010 MNP allows subscribers to change their mobile service provider while retaining their old mobile number The portability service was made available for both postpaid and prepaid customers as well as on both GSM and CDMA platforms The implementation of MNP has brought a slew of benefits for customers in terms of better plans and offers MNP requests in India increased to 209.13 million at the end of March, 2016 Source: TRAI Report, TechSci Research Number of MNP requests (in million) 117.01 153.85 209.13 FY14 FY15 FY16
  • 50. 5050JANUARY 2017 INDUSTRY ASSOCIATIONS Association of Unified Telecom Service Providers of India (AUSPI) B-601, Gauri Sadan 5, Hailey Road, New Delhi ā€“ 110 001, India Tel: 91 11 23358585 Fax: 91 11 23327397 Website: http://www.auspi.in/ Association of Competitive Telecom Operators (ACTO) 601, Nirmal Tower, 26, Barakhamba Road, Connaught Place, New Delhi ā€“ 110 001, India Tel.: 91 11 43565353 / 43575353 Fax: 91 11 43515353 E-mail: info@acto.in Website: www.acto.in Internet & Mobile Association of India (IAMAI) F-36, Basement, East of Kailash, New Delhi ā€“ 110 065, India Tel: 91 11 46570328 E-mail: kalyan@iamai.in Website: www.iwww.iamai.in For updated information, please visit www.ibef.org TELECOMMUNICATION
  • 51. 5151JANUARY 2017 APPENDIX For updated information, please visit www.ibef.org BMI telecoms business environment ratings Industry rewards: it considers average revenue per users, number of subscribers, subscriber growth, and number of operators Country rewards: it considers urban/rural split, age range, GDP per capita, USD Industry risks: it considers regulatory independence Country risk: it rates the country on short-term external risk, policy continuity, legal framework corruption Telecom ratings: overall rating of the above indicators TELECOMMUNICATION
  • 52. 5252JANUARY 2017 GLOSSARY ā€¦ (1/2) BWA: Broadband Wireless Access CAGR: Compound Annual growth rate DoT: Department of Telecommunication FDI: Foreign Direct Investment FTTH: Fibre To The Home FY: Indian Financial Year (April to March) IMF: International Monetary Fund INR: Indian Rupee IPTV: Internet Protocol Television M&A: Mergers and Acquisitions MoU: Minutes of Use per month and per subscriber MPEG: Moving Picture Experts Group For updated information, please visit www.ibef.org TELECOMMUNICATION
  • 53. 5353JANUARY 2017 For updated information, please visit www.ibef.org OFC: Optical Fibre Cable TRAI: Telecom Regulatory Authority of India USOF: Universal Service Obligation Fund USD: US Dollar VAS: Value-Added Services WiMAX: Worldwide Interoperability for Microwave access telecommunications Wherever applicable, numbers have been rounded off to the nearest whole number TELECOMMUNICATION GLOSSARY ā€¦ (2/2)
  • 54. 5454JANUARY 2017 Exchange rates (Fiscal Year) For updated information, please visit www.ibef.org EXCHANGE RATES Exchange rates (Calendar Year) TELECOMMUNICATION Year INR equivalent of one USD 2004ā€“05 44.81 2005ā€“06 44.14 2006ā€“07 45.14 2007ā€“08 40.27 2008ā€“09 46.14 2009ā€“10 47.42 2010ā€“11 45.62 2011ā€“12 46.88 2012ā€“13 54.31 2013ā€“14 60.28 2014-15 61.06 2015-16 65.46 2016-2017E 66.95 Source: Reserve bank of India, Average for the year Year INR equivalent of one USD 2005 43.98 2006 45.18 2007 41.34 2008 43.62 2009 48.42 2010 45.72 2011 46.85 2012 53.46 2013 58.44 2014 61.03 2015 64.15 2016 (Expected) 67.22
  • 55. 5555JANUARY 2017 India Brand Equity Foundation (ā€œIBEFā€) engaged TechSci to prepare this presentation and the same has been prepared by TechSci in consultation with IBEF. All rights reserved. All copyright in this presentation and related works is solely and exclusively owned by IBEF. The same may not be reproduced, wholly or in part in any material form (including photocopying or storing it in any medium by electronic means and whether or not transiently or incidentally to some other use of this presentation), modified or in any manner communicated to any third party except with the written approval of IBEF. This presentation is for information purposes only. While due care has been taken during the compilation of this presentation to ensure that the information is accurate to the best of TechSci and IBEFā€™s knowledge and belief, the content is not to be construed in any manner whatsoever as a substitute for professional advice. TechSci and IBEF neither recommend nor endorse any specific products or services that may have been mentioned in this presentation and nor do they assume any liability or responsibility for the outcome of decisions taken as a result of any reliance placed on this presentation. Neither TechSci nor IBEF shall be liable for any direct or indirect damages that may arise due to any act or omission on the part of the user due to any reliance placed or guidance taken from any portion of this presentation. For updated information, please visit www.ibef.org DISCLAIMER TELECOMMUNICATION