Download to read offline

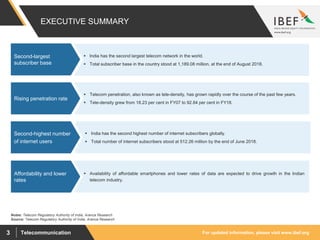

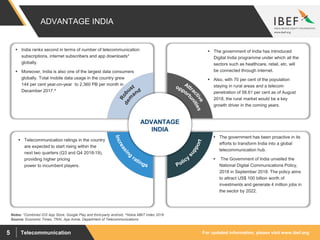

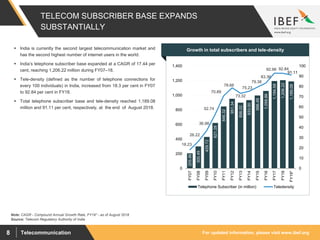
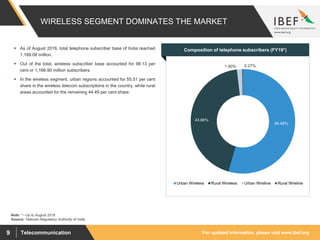
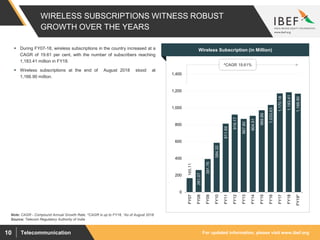
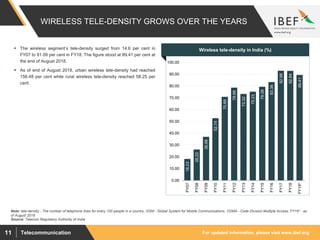
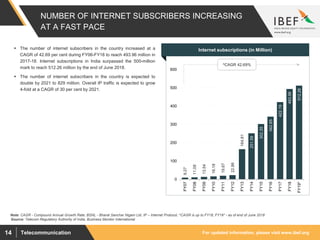
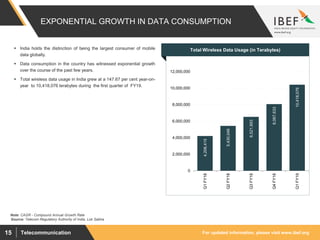


The telecommunications sector in India is growing rapidly with total telephone subscribers reaching over 1.1 billion. Wireless subscriptions account for the vast majority at over 1.1 billion, growing at a CAGR of 19.61% between FY07-18. Tele-density has also increased sharply from 18.23% in FY07 to over 92% in FY18. Internet penetration is also rising fast with over 500 million subscribers as of June 2018. Data consumption is growing exponentially driven by affordable smartphones and lower data rates. Emerging trends include expansion to rural areas, adoption of green technologies, and growth of technologies like IoT and 5G.


