
Download to read offline
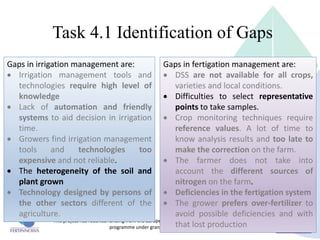


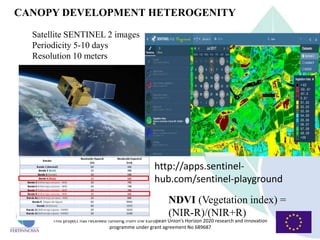


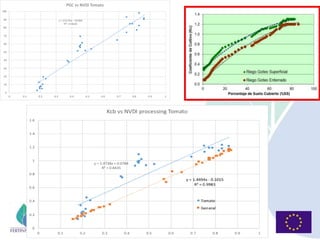


The document outlines the findings of the Fertinnowa project funded by the EU's Horizon 2020 program, which focuses on improving fertigation technologies for crop management. It identifies key gaps in current irrigation and fertigation practices, such as the need for better tools, automation, and understanding of spatial variability. The project demonstrates that satellite imagery can effectively monitor crop development and inform targeted irrigation and fertilization strategies, enhancing overall yield and management efficiency.


![Human Reproduction [ Reproductive System ] Notes @irfanullah_mehar Irfanullah...](https://cdn.slidesharecdn.com/ss_thumbnails/humanreproductionreproductivesystemnotesirfanullahmeharirfanullahmeharjanantantra-260111172350-56e85778-thumbnail.jpg?width=640&height=640&fit=bounds)


