SlideShare a Scribd company logo
1 | P a g e
EGR 1100 Spring 2015 – Team 2
College of Southern Maryland
Microcontroller-based Robotic Car
4/29/2015
Team Members:
George Jenkins, Patrick Smith, Deonte Hicks,
& Trevin Reaves
2 | P a g e
Table of Contents
TitlePage………………………………………………………………………………………………………………………………………1
TableofContents………………………………………………………………………………………………………………………….2
Introduction……………………………………………………………………………………………………………………….……......3
TheRequiredDesign,Criteria,andConstraints…..............................................................................................4-5
EvolutionoftheDesign……………………………………………………………………………………………………………….5-9
FinalDesignandTestResults……………………………………………………………………………………………………..9-12
AppendixA–IdeaBank…………………………………………………………………………………………………………..13-14
AppendixB–PreliminaryDesigns………….………………………………………………………………………………...15-16
AppendixC–WorkingModel………………………………………………………………………………………………….16-17
AppendixD–CircuitDesign………………………………………………………………………………………………………….17
AppendixE–Program………………………………………………………………………………………………………….…18-19
AppendixF–AutoCAD………………………………………………………………………………………………………………...20
AppendixG–BillofMaterials………………………………………………………………………………………………..……..21
AppendixH–TestingResults………………………………………………………………………………………………………..21
3 | P a g e
I Introduction
Engineering is a branch of science and technology concerned with the design,
building, and use of engines, machines, and structures. The usage of engineering is to
invent or also to innovate to create a solution to a problem. The products produced by
engineers are then utilized as assets to society by simplifying or bettering the lives of
humanity. For this class, teams were faced with the Microcontroller-based design project.
The purpose of the project was to design, build, and test a mechanically/electrically driven
robotic car, controlled by a microcontroller, which can autonomously navigate a black-line
track to the end of a course.
In order to complete this project in thorough, teams had to go through the entire
design process. The project had stages of defining the problem, brainstorming, product
development, build, and testing and revisions. The basic concept of a car is what drove
our design. The need was to have some type of chassis with a motor and wheels that
moved the body. To integrate the concept of a car with the project, other elements had to
be added like the line tracking sensors, breadboards, circuits, and the usage of Arduino
software to develop some sort of control logic for the maneuvering the car around a
course. By members having some prior experience in engineering from high school, the
team knew the project was plausible, but still challenging since none of the members had
any programming experience with Arduino.
Through the design process, collectively the team gained a lot of knowledge and
experience in many areas including circuits, programming, problem solving, and logic. The
great thing about the course is that the teams make what they have out of the project. A
lot of research and independent learning was necessary to be successful. Since this was
the first time any of the members had dealings with Arduino, members went through a
learning process to complete the project. Learning Arduino and applying the knowledge
gained from the research was by far the most challenging portion of the project. The end
product produced was the result of a lot of time and mistakes, but mostly from the
growth of the members as students. This makes the value of the work and the results so
much more significant since this was an original design that evolved and transitioned
through the design process.
The project was much like a real life situation where an engineer would get a
problem and have to create the solution. The solution is never what is initially thought.
Through research and product development, one can have some idea of what the product
may be. Then after having a preliminary design and through testing and revisions, the idea
evolves into the solution that meets all criteria. Engineering is a developmental processes
and the project not only developed the final car product, but also team members as
engineering students. The team work necessary, along with the actual learning portions
behind this made the members better students than when started this course in January.
In the rest of the paper, topics discussed will include the specified design criteria,
the evolution of the design, and a discussion of the final product.
4 | P a g e
II The Required Design, Criteria, and Constraints
The project overview listed serval design criteria in which the project had to meet. The
microcontroller-based robotic car had to autonomously follow a one inch wide black tape
track along a white surface. The total length of the black tape track was specified to be
approximately 15 feet. The time constraint for the car to complete the length of the
course was set at less than one minute. This track would consist of straight and turn
components, of which the turns were specified to be generally under 45 degrees, but did
not exclude turns over this dimension. The track had a six inch border resulting from both
sides of the black line and the car had to stay within this margin.
All teams were supplied an Arduino-UNO microcontroller and it was specified teams
had to use this in order to autonomously drive and steer the robotic car. The Arduino-
UNO microprocessor would be utilized by running the code, or control logic, developed on
Arduino software. Every team had to develop the control for the microcontroller-based
robotic car within the Arduino software. The control logic consisted of the registered
information from the line tracking sensors to steer and ultimately drive the
microcontroller-based robotic car through the track. The control logic had to take the
input from the sensors and from the input, produce an output via the motors in the
design.
Along with the Arduino-UNO microcontroller, teams were to be given two servo
motors to drive and steer the car, and two line tracking sensors. All additional parts must
be supplied by the team. The college would reimburse each team for up to seventy
dollars, but the project did not have an official cost constraint, just that the maximum
teams could spend and not have personal loses would be the seventy dollars.
Several size requirements were specified. The car was to weigh less than six pounds.
The car’s length and width when multiplied should give an area no greater than 100
square inches. Also the maximum volume for the car when multiplying length, width, and
height should be less than six hundred cubic inches. These size requirements in reality
were the milestones for meeting the other criteria. With a car over six pounds, without a
tremendous amount of torque from the motors, would not meet the time criteria. A car
with a larger area or volume would not have a chance in staying in the six inch border.
The design was to be safe to operate, self-contained, one assembly, and compact that
would autonomously operate when placed on the track and switched on. Our chassis was
to be of our own design, and not pulled from off of the store shelf, in other words not
bought offline or taken from a toy or other source. Teams were not supposed to just go
and buy a kit or use a car already built. The design process cannot be followed if there is
nothing to do. Our designed chassis was to be able to carry the microcontroller, the car’s
power source, and it’s wiring all within itself, without a sloppy design.
Our finished car design was to look professional and orderly. Items such as glue, tape,
rubber bands, paperclips, staples, etc., were not to be used in the finished product.
5 | P a g e
Hardware parts such as screws and brackets were to be considered to mount all of our
fixtures onto our robotic car’s chassis, with all parts reflecting fabricated parts designed
on AutoCAD. With all of the previous information considered, we were to make sure that
our Arduino and provided materials are easily removable since they were to be used in
future classes. These guidelines were the basis of the design and everything the team did.
In the end, the design would be evaluated on this criteria so the whole point of the project
is to meet the needs of the presented problem, which is conformed to this set of
constraints.
III Evolution of the Design
After defining the problem by going through the design criteria, the team moved
into the design portion. Our team’s strategy was that everyone take the knowledge of the
constraints and come up with preliminary ideas. So each individual went home and
sketched up an idea. These ideas were brought together and the ones that made the most
sense and seemed plausible were put into what was called the “idea bank” (Appendix A).
This idea bank is the basis for all of our design choices since this represents the best ideas
the team could come up with that would be able to fit the needs of the task.
The first idea, appendix A figure 1, was a four motor rectangle design with the
sensors in the front and a series of LED’s so underneath the car would be bright enough so
the sensors could take accurate readings. The second idea, appendix A figure 2, had two
motors in the back with the front having two wheels without motors connected by an axil
and the sensors in the front with LED’s. This design had a square shaped chassis. The third
idea, appendix A figure 3, was the triangular design. This consisted of two motors in the
back with a tapered chassis leading to a pivot wheel in the front surrounded by the
sensors on either side.
The fourth idea, appendix A figure 4, had two motors in the back and had two
pivot wheels in the front with the sensors in between the two pivot wheels. The fifth idea,
Appendix A figure 5, had two motors in the back and only had one sensor in the front with
the intentions of using advanced programming techniques to only use the one. The last
idea, appendix A figure 6, had one motor in the back controlling two back wheels and one
servo motor in the front that would be used for steering control.
After gathering these ideas, we noticed trends within the designs. Ideas two, three,
four, and five all were very similar. All of these designs consisted of two motors in the
back, and the front had no motor with the wheels either pivoting or of free motion by axil.
So in order to simplify the decision process, we combined all these ideas into a singularity
and grouped the ideas into preliminary design one (Appendix B, Figure 1). The other trend
in the designs was with idea one and idea six. Similar logic between the two of control
motors in the front and speed motors in the back. Again to simplify the decision process
and allowing our team to have two preliminary designs, these ideas were grouped in
preliminary design 2(Appendix B, Figure 2).
6 | P a g e
After simplifying the idea bank into two preliminary designs, the team was faced
with deciding which concept to go with. In order to pick which design to go with,
feasibility studies were conducted on both preliminary designs. The first thing the team
did was to make a projected parts and cost list for both designs. Preliminary idea one had
a projected cost of $73.82 and would cost the team $40.73, see appendix B figure 3, due
to the exemption of materials provided or members already had. Preliminary idea two had
a projected cost of $84.65, which was projected to cost the team $47.73, see appendix B
figure 4.
Other factors had to then be considered under the feasibility study. For
preliminary idea two, with four motors, the car would be fast. Overall it was expensive
and to program four motors and have the power supply to run them would be a challenge.
Preliminary idea one was a cheaper and more simplistic option. The consequence would
be that the car would not go as fast as in preliminary idea two. The decision came down to
speed verses simplicity. After considering both options, the team decided to go with
preliminary idea one since this was a more feasible option all around knowing some speed
would be sacrificed. Speed however was not that big of a factor considering the two
motors should still be able to move the car fifteen feet in under a minute.
Now having an initial design to work off of, the team found it necessary to get a
clear concise image of exactly what the design would be. From this meeting, the team
gathered that two DC motors would be connected to the back of a surface, which we
preferred to be Plexiglass. From the point the motors attached on either side of the
chassis, the team wanted the surface to be tapered to two inches. On the front edge, two
sensors would be mounted at the end of the tapered edge. Also in the front the team
wanted to place a pivot wheel in the center of the front edge. On top of the chassis
secured would be the Arduino UNO board, motor shield, and battery. From this collective
vision, the team would then obtain the needed parts.
Before actually building the car, a working model simulation had to be created
reflecting the design. Since this software is only in two dimensions, to reflect the actual
project within the software is impossible. The only actual uses of the software is to create
a straight line track and have an imported car go along that plane. The team was able to
give the car a projected 0.5 feet per second velocity and 1.5 pound weight to make the
simulation more realistic. 0.5 feet per second was the goal for speed and 1.5 pounds was a
rough estimate of how much the car was going to weigh. With these values, the working
model simulation was made with output meters indicating time, displacement, force, and
torque (See appendix C figure 1). Also from working model, these output meters could be
exported to excel to make charts. These charts could be found in the team journal pages
13 through 19.
As an engineer, the idea is to build your product as cheap as possible so that the
product can earn more profits for the company. When acquiring the parts for the car, the
team wanted to spend as little as possible in order for the team to theoretically “make
more profits” from the design. So the team used as many free materials as possible, and
7 | P a g e
as engineers, put these together to make the desired product. Doing so however changed
up our design. While in class, Professor Gopinath brought in boxes of parts that teams
could use potentially for designs. In this box, the team collected a chassis, wires, as well as
two continuous servo motors and two mounting brackets for the motors. The chassis was
not the shape we had in mind. It was rectangular with a curved front and rear side. So by
using this and the continuous servo motors, the design had changed just from getting
parts that altered the design.
Other than the chassis, motors, wires, and brackets, the team already was
provided with the Arduino and circuit boards along with the sensors. The only parts the
team needed to build the car was two wheels for the motors and the pivot wheel along
with the motor shield and battery. The wheels for the motors were found in an unused
mechanics construction kit and members had fasteners so the only actual parts ordered
were the pivot wheel and motor shield, and the battery was bought. These parts came in
and the construction of the car was started.
The first part of construction was to mount the motors. Each motor was connected
to a single bracket and connected to the chassis. After doing this, the team noticed that
each motor was not properly secured with only one bracket. To fix this, two brackets were
made using a piece of malleable metal a member had. Each motor was then connected to
a second bracket and were properly secured. The sensors were secured as well as the
Arduino board, of which the motor shield was placed, and the breadboard was secured
next to the Arduino board. Lastly the pivot wheel was attached. This is where we faced
another problem. The pivot wheel was too short. If fastened to the chassis, the front of
the car with the pivot wheel would have been much too low so a half inch board was
placed between the chassis and pivot wheel to accommodate for this difference in height.
At this point, the team had the envisioned design built with a few changes.
Through testing the team was sure more changes were to come. In order to test, first the
team had to wire the electrical portions and write a program. For the circuit (Appendix D),
power and ground was taken from the motor shield to the breadboard. All electrical
components were then connected to the breadboard. The team connected the power and
ground to both motors and sensors and then took the output wires of each component to
the motor shield. What was soon noticed was that the motor shield actually served no
function in the design since everything could be connected direct to and from the Arduino
board. The cause of this was because the motor shield would be necessary DC motors
were a part of the design, but with the continuous servos, the motor shield was
unnecessary.
The program needed to perform four basic functions. The car needed to go
straight if both sensors were in the white, turn left if the left sensor was in black, turn right
if the right sensor was in black, and to stop at the end of the track. The teams approach to
the program was structured in the analog read function. After writing an analog read
program, the program could take the input of the sensor and provide a value. Testing
found that when in white, the sensor typically had values around nine hundred while in
8 | P a g e
the black had values above one thousand. So in a very simple program using if else
statements, based on the testing data value range that the sensors should be in, the car
could perform each of the functions (See appendix E figure 1).
The program was written so that with a sensor value under 950, the sensor would
be considered on a white surface and above would be black. If both were in white, both
motors should go forward. If the left sensor was in black but the right was in white, turn
the left motor off and keep the right forward to turn left. If the left sensor was in white
but the right was in black, keep the left motor forward and turn the right off to turn right.
Lastly if the left sensor was in black and the right was in black, turn the left and right
motors off since this would be the end of the track.
After completing this, the car was ready to be tested. When placed on the track,
the car started to move forward but trouble came at the first turn. At that point, the
sensors were too close together and both read black so the car stopped. The team also
noticed because the pivot wheel was in front, the car kept twitching from the left and
right and overall there was very little horizontal stability within the motion. Based on the
test, the changes that needed to be made were to move the pivot wheel to the back of
the car and to increase the distance between the sensors. Doing so would result in a faster
and more efficient car, and the car would not be able to navigate turns without the
increase in sensor distance.
The motors and wheels were moved to the front, the sensors were placed a
quarter inch further apart, and the pivot wheel was then secured to the back. When
tested again, the car actually was able to make it completely through the course in about
forty seconds. The team was very satisfied with this time considering it was about twenty
seconds under the time criteria. With a completed build, the only changes that would be
needed would be possible modifications to the circuit and program to have a faster car.
First the team looked at possible circuit modifications. The initial idea was to
connect the battery into the power and ground in the breadboard. From that, connect
power and ground to the Arduino board and also have all components feeding off the
same line in parallel. When doing this, the motors did go a little faster. Research was done
on the Arduino board and the information suggested that doing the circuit like this was
not good for the Arduino board. The reason of this was since the 9 volt was supplying 9
volts and this was leading into the 5 volt power supply of the board. The maximum value
going into 5 volt supply was meant to be less than 7 volts. With a 2 volt surplus, this could
cause damage to the board, so the circuit was changed back the original one made.
The program was then looked at to be modified. The original program worked, but
could most likely be improved upon. The team focused on alternate methods of turning
the car. The current method of keeping one motor on and turning the other motor off
seemed like an inefficient approach. The new approach tried was a counter-steering
approach, see Appendix E figure 2. To go forward as in the original, both motors were full
speed forward. To turn right, the left motor was full speed forward and the right motor
was full speed backwards. To turn left, the right motor was full speed forward and the left
9 | P a g e
motor was full speed backwards. The last function, to stop, was held constant by turning
both motors off. When tested, this program was able to complete the course much more
effectively.
When testing however, the car failed several times to complete the course. When
the car was trying to maneuver a sharp corner, often times it would stop. Based on the
program, the car would stop if both sensors were registering black, meaning the end of
the course, but obviously there was a fault somewhere. The initial solution was to increase
the distance between the sensors once again. Doing so would allow the car to definitely
have enough room on either side of the black line and resulting in not registering both
sensors in black. When testing however, the car still failed. By doing so, the team moved
the sensors back to the original location. The next approach was to measure new values of
the track utilizing the analog read program once again. When reevaluating these values, it
was found that the program value should be 975. Initially the program had a value of 950
for the sensor values, but changing this to 975 was needed. The value had to be 975 since
at 950, sometimes the sensor was reading a value in the 960 range when on white. Since
this 960 was above the 950 mark, the program read the senor as on black and would then
stop the motors.
Testing indicated that changing the value to 975 solved the problem of the car
stopping in the middle of the track. From the point the value was changed, the car was
able to complete the course every time and at this point, the team had a finalized design.
IV Final Design and Testing
Through the design process, the product had evolved very much. Once defining the
problem, the team brainstormed and created the two preliminary designs. From that
point, feasibility studies were conducted and an idea was chosen. At that moment, the
team had a general idea of what the end result of the project would be. The vision all of
the members had steadily evolved as parts were acquired, flaws were exposed, and
through testing. From all the work, change, and the basis from an evolved vision, the final
car product was derived. This car, meeting all design criteria specified, was the result of
the design process.
This is the team 2 car:
10 | P a g e
The previous pictures show the final design, reflecting all the mentioned changes
in the evolution of the design section. As is shown, the sensors are in the front along with
the two continuous servo motors. The back of the design has the pivot wheel which is
attached to the needed piece of wood to make a level surface. On top rests the secured
Arduino board along with the breadboard and the battery. Breadboard cables are used to
connect the motors to the breadboard and also the wires of the sensors and motors to the
Arduino board. From the pictures, the brackets connecting the motor to the chassis is not
clear, but on either side of the motor is secured to the chassis with a bracket.
This complete design exclusive of common fasteners was reflected in an AutoCAD
drawing (See appendix E). All dimensions are exact from the actual car and all components
are included. The AutoCAD drawing provides the left side, top, and rear views. The most
difficult part of constructing the AutoCAD drawing was the pivot wheel. Since the pivot
wheel was at an angle and slightly offset from the wood based on orientation, to make
these properties conform to the AutoCAD drawing was a challenge, but the actual
orientation of the wheel is reflected after some difficulty in the drawing.
Once having the AutoCAD complete, the car was weighed at 1.4 pounds and was
measured to have an area of 44 in2 and a volume of 132 in3. The team was able to make a
bill of materials based on the finished design (See Appendix F). To create the bill of
materials, the team very simple put down every part in the excel file. The parts included: 1
chassis, 1 Arduino UNO, 1 breadboard, 2 optical sensors, 2 continuous servo motors, 12
breadboard cables, 2 wheels, 4 mounting brackets, 1 pivot wheel, 12 fasteners (including
nuts and bolts), 1 - 9 volt battery, 1- 9 volt battery adapter, and the wood block. All of
these simplistic materials serving function in the design.
After listing all parts, the team looked up the price of each part using the internet
for parts we did not buy, which was the majority of the parts. The two parts that were
bought online had the price recorded based off of the receipt. Every part has value, the
difference with the car is the team only bought two parts for the final design. Also for the
bill of materials, the quantity of the part was recorded. This saved the team from having
to record the same part on multiple lines. Other than the price and quantity, the total cost
11 | P a g e
and the cost to the team were recorded and also the source of the part. The source is just
where the team acquired the part. Most of the parts were from Professor Gopinath
bringing the supplies he had to class, others were from team members homes, the rest
were ordered online.
After all of the parts were documented, looked up for price, and then recorded,
the team had the total cost of the design and also the cost to the team. In total, the car
cost $69.29 for all of the parts. In reality, the car only cost the team $4.74 since the only
parts the team bought were the pivot wheel and also the battery. The total cost of the car
was very cheap. The cost to the team was basically a minimum. By the team utilizing the
parts already available from the college, the parts needed to buy independently was
minimized. The most the college would reimburse teams was $70.00 so our team only
spending a little under $8.00 is much under this constraint. The only discrepancy of the
team cost is the motor shield which was bought for the original design but then not
utilized in the final design so the motor shield was not included in the bill of materials.
With the final design came the testing and evaluation portion of the design
process. The testing procedure the team used to measure performance was quite basic.
The team utilized the track provided in the class. With the car, the car was turned on and
started the car at the beginning of the track. Once the car stared to move, a member
would start the clock. The only performance aspect the car had to meet was to complete
the course in under a minute so timing the car to complete the course would measure the
time constraint. Once the car traveled completely through the track, the time was stopped
and then recorded. Fifteen trials were conducted and the average time was taken of these
trials.
The testing results, see Appendix G, indicated that the car meets the time
constraint by having an average time under 1 minute. When testing, the first two trials
failed. The failure was a result of the sensors being too close together as mentioned in the
evolution of the design. The next two trials were a success. Then the following two were
fails again, which was discussed in the evolution of the design as the team needed to
modify the sensor values to 975. After changing the sensors, the rest of the trials were
successful, having times in the 45-46 second range. The average time for the car to
complete the track was 45.82 seconds, being a little over 14 seconds under the one
minute criteria. When reducing this to speed, the car on average goes 0.3274 feet per
second. Based on the testing data and the weight measured previously, the working
model simulation was then updated to reflect these new values (Appendix C, Figure 2).
Once having the car meeting the time criteria, the project was then officially
completed. The only remaining parts was the presentation and this paper. Before being
able to do either of the deliverables, an evaluation would have to be done on the design
to see how the car meets all the listed criteria. For performance, the car did meet the time
criteria by being under one minute. The speed of the car was 0.3274 feet per second. Early
on in the project when doing the initial working model, the team set the speed for 0.5 feet
per second so the car did not end up as fast as projected. This is mainly a result of using
12 | P a g e
the continuous servo motors instead of the DC motors. The team knew all along by using
the servo motors, speed would be sacrificed, but since these motors were available and
since the car still meets the time, it can be concluded that using these motors did not
affect performance to an extent.
Based on testing, the car also met the criteria for staying within the 6 inch
boundaries. The car at no point during testing left the track and for the most part stayed
centered so based on this, the car meets the criteria. Other criteria the car met was
utilizing Arduino, being safe to operate, being portable, and being self-contained. The car
also meets all size criteria. The car weighed 1.4 pounds and the maximum specified by the
project overview was 6 pounds. The car had a total area of 44 in2 and a volume of 132 in3,
both of which were well under the designated constraint. Overall, the car meets all of the
listed criteria and based off of that, the team was able to conclude the project was a
success.
During the course of the project, the team worked effectively. The work of the
project was split up using the strengths of the members. Team leader George Jenkins had
a lot of experience from high school in circuits and in programming so his role for the car
was those. Team member Patrick Smith had experience in construction, so he led the
build portion of the project. Trevin Reaves was the best of the team at AutoCAD so he was
designated to do the AutoCAD drawing for the car. Team member Deonte Hicks was the
visionary as the team utilized his sketching abilities to get a clear picture of the design and
he also obtained most of the materials.
The working model of the project was a collective effort of the team. The journal
of the project was kept by team leader George Jenkins, with the help of the rest of the
team members. The presentation and report was a collective effort of all of the members.
Each member was able to provide key insight on each individual’s expertise within the
project. This enabled the deliverables to have accurate and precise information on every
aspect of the design process.
By utilizing the strengths and weaknesses of the members, the work load was able
to be evenly distributed among the team. This allowed members to focus on strengths
and let members that are better in other areas to do what they are best at. Overall by
doing work in this fashion, it allows for a more effective and productive team. Also by
doing the project in this manner, this reflects the real world greatly. In the real world as an
engineer, one will be a part of a team of people who have expertise outside of yours. The
success of the project depends on each individual to do their own part. Without a part,
the project cannot be complete. Members rely on one another for the success of the
project. Trust is big, but as long as every member does their part, the project will be a
success. In team 2’s case, every member did their role and in the end, the car worked by
meeting all criteria and every portion of the project was completed on time. Much was
learned from this experience and if it was not for every member doing their role, the
project would have never been the success it turned out to be.
13 | P a g e
Appendix A – Idea Bank – Journal Page 4-5
Figure 1: 4 motor rectangle design
Figure 2: 2 motor square design
Figure 3: 2 motor triangular design
14 | P a g e
Figure 4: 2 motor rectangular design
Figure 5: 2 motor rectangle design
Figure 6: 2 motor rectangle design
15 | P a g e
Appendix B – Preliminary Designs – Journal Page 10-11, 37-38
Figure 1: Preliminary Idea 1 Figure 2: Preliminary Idea 2
Figure 3: Idea 1 Cost
Part Retail Price Quantity Used Total Cost Team Cost
Plexiglass Sheet $20.00 (1/8) $2.50 $2.50
Battery $3.50 1 $3.50 0
Arduino $6.25 1 $6.25 0
Optical Sensor $10.00 2 $26.67 0
Motor $5.00 2 $10.00 $10.00
Wheels $2.50 3 $7.50 $7.50
LED $0.50 1 $0.50 0
Nuts $4.99 (12/50) $1.20 $1.20
Screws $4.99 (12/50) $1.20 $1.20
Piviting Bracket $2.50 1 $2.50 $2.50
Motor Shield $12.00 1 $12.00 $12.00
$73.82
$40.35
Total Cost
Bill of Materials - (2 Motor Design)
Cost to Team
16 | P a g e
Figure 4: Idea 2 Cost
Appendix C – Working Model – Journal Page 13, 36
Figure 1: Original Working Model, see charts journal pages 13-19
Part Retail Price Quantity Used Total Cost Team Cost
Plexiglass Sheet $20.00 (1/6) $3.33 $3.33
Battery $3.50 1 $3.50 0
Arduino $6.25 1 $6.25 0
Optical Sensor $40.00 2 $26.67 0
Motor $5.00 4 $20.00 $20.00
Wheels $2.50 4 $10.00 $10.00
LED $0.50 1 $0.50 0
Nuts $4.99 (12/50) $1.20 $1.20
Screws $4.99 (12/50) $1.20 $1.20
Motor Shield $12.00 1 $12.00 $12.00
84.65
$47.73
Bill of Materials - (4 Motor Design)
Total Cost
Cost to Team
17 | P a g e
Figure 2: Final Working Model
Appendix D – Circuit Design – Journal Page 24
18 | P a g e
Appendix E – The Program – Journal Page 27-28, 32-33
Figure 1: Original Program
19 | P a g e
Figure 2: Revised Program
20 | P a g e
Appendix F – AutoCAD – Journal Page 34
21 | P a g e
Appendix G – Bill of Materials – Journal Page 39
Appendix H – Testing Results – Journal Page 35
Part Retail Price Quantity Used Total Cost Team Cost Source
Chassis $2.50 1 $2.50 $0.00 CSM
Arduino UNO $6.25 1 $6.25 $0.00 CSM
Breadboard $3.59 1 $3.59 $0.00 CSM
Optical Sensor $13.33 2 $26.66 $0.00 CSM
Continuous Servo Motor $8.59 2 $17.18 $0.00 CSM
Breadboard Cables $0.06 12 $0.72 $0.00 CSM
Wheel $1.25 2 $2.50 $0.00 George
Mounting Bracket $0.30 4 $1.20 $0.00 Deonte
Pivot Wheel $1.25 1 $1.25 $1.25 Amazon.com
Fasteners $0.24 12 $2.88 $0.00 Deonte
9 Volt Battery $3.49 1 $3.49 $3.49 Walmart.com
9 Volt Battery Adapter $0.60 1 $0.60 $0.00 CSM
Wood Block $1.89 (1/4) $0.47 $0.00 George
$69.29
$4.74
Bill of Materials
Total Cost
Total Cost to Team
Trial Time (Seconds)
1 Fail
2 Fail
3 44.74
4 43.89
5 Fail
6 Fail
7 46.51
8 45.54
9 46.02
10 46.48
11 45.89
12 45.63
13 46.38
14 46.46
15 46.52
Average 45.82
Testing Results

More Related Content

What's hot

VOICE OPERATED ROBOT DOCUMENTATION
VOICE OPERATED ROBOT DOCUMENTATIONVOICE OPERATED ROBOT DOCUMENTATION
VOICE OPERATED ROBOT DOCUMENTATION
Sree Harini Dunnala
 
Pic & Place - Thesis poster-template@AIUB
Pic & Place - Thesis poster-template@AIUBPic & Place - Thesis poster-template@AIUB
Pic & Place - Thesis poster-template@AIUB
Nusrat Mary
 
Robotic Surgery Project Report
Robotic Surgery Project ReportRobotic Surgery Project Report
Robotic Surgery Project Report
Sai Charan
 

What's hot (20)

Robot applications
Robot applicationsRobot applications
Robot applications
 
VOICE OPERATED ROBOT DOCUMENTATION
VOICE OPERATED ROBOT DOCUMENTATIONVOICE OPERATED ROBOT DOCUMENTATION
VOICE OPERATED ROBOT DOCUMENTATION
 
MARK ROBOTIC ARM.ppt
MARK ROBOTIC ARM.pptMARK ROBOTIC ARM.ppt
MARK ROBOTIC ARM.ppt
 
Voice and touchscreen operated wheelchair ppt
Voice and touchscreen operated wheelchair pptVoice and touchscreen operated wheelchair ppt
Voice and touchscreen operated wheelchair ppt
 
wireless pick and place robotic arm
wireless pick and place robotic armwireless pick and place robotic arm
wireless pick and place robotic arm
 
Robotics in Medical Science
Robotics in Medical ScienceRobotics in Medical Science
Robotics in Medical Science
 
Pic & Place - Thesis poster-template@AIUB
Pic & Place - Thesis poster-template@AIUBPic & Place - Thesis poster-template@AIUB
Pic & Place - Thesis poster-template@AIUB
 
Iot operated wheel chair / smart wheelchair
Iot operated wheel chair / smart wheelchair Iot operated wheel chair / smart wheelchair
Iot operated wheel chair / smart wheelchair
 
Line follower Robot using PID algorithm
Line follower Robot using PID algorithmLine follower Robot using PID algorithm
Line follower Robot using PID algorithm
 
VTU final year project report
VTU final year project reportVTU final year project report
VTU final year project report
 
Smart Management of EV Charging Station
Smart Management of EV Charging StationSmart Management of EV Charging Station
Smart Management of EV Charging Station
 
Biped presentationslides
Biped presentationslidesBiped presentationslides
Biped presentationslides
 
Robotic Surgery Project Report
Robotic Surgery Project ReportRobotic Surgery Project Report
Robotic Surgery Project Report
 
Comparison of the parts of the robot and human
Comparison of the parts of the robot and humanComparison of the parts of the robot and human
Comparison of the parts of the robot and human
 
Automatic seeder and fertilizer bluetooth seed sowing sun robo
Automatic seeder and fertilizer bluetooth seed sowing sun roboAutomatic seeder and fertilizer bluetooth seed sowing sun robo
Automatic seeder and fertilizer bluetooth seed sowing sun robo
 
Tree climbing robot 2014 edit
Tree climbing robot 2014 edit Tree climbing robot 2014 edit
Tree climbing robot 2014 edit
 
Self driving car
Self driving carSelf driving car
Self driving car
 
Virtual reality
Virtual realityVirtual reality
Virtual reality
 
Autonomous or self driving cars
Autonomous or self driving carsAutonomous or self driving cars
Autonomous or self driving cars
 
Robotics
RoboticsRobotics
Robotics
 

Viewers also liked (13)

Team 2 Presentation
Team 2 PresentationTeam 2 Presentation
Team 2 Presentation
 
Bella durmiente
Bella durmienteBella durmiente
Bella durmiente
 
STEM Demand speech
STEM Demand speechSTEM Demand speech
STEM Demand speech
 
STEM Demand Presentation
STEM Demand PresentationSTEM Demand Presentation
STEM Demand Presentation
 
Eamon McCarthy Earls_Independent Publications
Eamon McCarthy Earls_Independent PublicationsEamon McCarthy Earls_Independent Publications
Eamon McCarthy Earls_Independent Publications
 
GAM FDR pres
GAM FDR presGAM FDR pres
GAM FDR pres
 
It's Just Trash: The Devastating Consequences of Littering
It's Just Trash: The Devastating Consequences of LitteringIt's Just Trash: The Devastating Consequences of Littering
It's Just Trash: The Devastating Consequences of Littering
 
PRACTICA #1
PRACTICA #1PRACTICA #1
PRACTICA #1
 
Lackey_Prosthetic_Arm_Report_Nationals
Lackey_Prosthetic_Arm_Report_NationalsLackey_Prosthetic_Arm_Report_Nationals
Lackey_Prosthetic_Arm_Report_Nationals
 
nxt remote control
nxt remote control nxt remote control
nxt remote control
 
Python Trifold2014
Python Trifold2014Python Trifold2014
Python Trifold2014
 
Lackey_Cyber_Robot_Challenge_Report
Lackey_Cyber_Robot_Challenge_ReportLackey_Cyber_Robot_Challenge_Report
Lackey_Cyber_Robot_Challenge_Report
 
Prosthetic Arm
Prosthetic ArmProsthetic Arm
Prosthetic Arm
 

Similar to Arduino Line Following Robot Technical Report

Emgineering Design Portfolio
Emgineering Design PortfolioEmgineering Design Portfolio
Emgineering Design Portfolio
Tsuyoshi Yokoyama
 
EffiCycle report_LUMINIOUS_2014
EffiCycle report_LUMINIOUS_2014EffiCycle report_LUMINIOUS_2014
EffiCycle report_LUMINIOUS_2014
Raj Kadecha
 
Capstone ProjectProposalFinal.docx
Capstone ProjectProposalFinal.docxCapstone ProjectProposalFinal.docx
Capstone ProjectProposalFinal.docx
Mohammad Molani
 
Arduino 2 Final Report (final)
Arduino 2 Final Report (final)Arduino 2 Final Report (final)
Arduino 2 Final Report (final)
Mohammad Molani
 
15_CoOp Report Out - Angelo Stekardis
15_CoOp Report Out - Angelo Stekardis15_CoOp Report Out - Angelo Stekardis
15_CoOp Report Out - Angelo Stekardis
Angelo Stekardis
 
SRIJITH PARAKKAT UMAKANTH (Research Experience)
SRIJITH PARAKKAT UMAKANTH (Research Experience)SRIJITH PARAKKAT UMAKANTH (Research Experience)
SRIJITH PARAKKAT UMAKANTH (Research Experience)
SRIJITH MENON
 
Car Game - Final Year Project
Car Game - Final Year ProjectCar Game - Final Year Project
Car Game - Final Year Project
Vivek Naskar
 

Similar to Arduino Line Following Robot Technical Report (20)

Portfolio
PortfolioPortfolio
Portfolio
 
Accelerometer Controller Robot
Accelerometer Controller RobotAccelerometer Controller Robot
Accelerometer Controller Robot
 
Emgineering Design Portfolio
Emgineering Design PortfolioEmgineering Design Portfolio
Emgineering Design Portfolio
 
Design and Fabrication of Human Powered Cycle
Design and Fabrication of Human Powered CycleDesign and Fabrication of Human Powered Cycle
Design and Fabrication of Human Powered Cycle
 
ANIn Pune July 2023 |Prompt Engineering and AI first SDLC by Abhijit Shah
ANIn Pune July 2023 |Prompt Engineering and AI first SDLC by Abhijit ShahANIn Pune July 2023 |Prompt Engineering and AI first SDLC by Abhijit Shah
ANIn Pune July 2023 |Prompt Engineering and AI first SDLC by Abhijit Shah
 
EffiCycle report_LUMINIOUS_2014
EffiCycle report_LUMINIOUS_2014EffiCycle report_LUMINIOUS_2014
EffiCycle report_LUMINIOUS_2014
 
Project 2 - Final Report
Project 2 - Final ReportProject 2 - Final Report
Project 2 - Final Report
 
Capstone ProjectProposalFinal.docx
Capstone ProjectProposalFinal.docxCapstone ProjectProposalFinal.docx
Capstone ProjectProposalFinal.docx
 
Arduino 2 Final Report (final)
Arduino 2 Final Report (final)Arduino 2 Final Report (final)
Arduino 2 Final Report (final)
 
J_Senior Project
J_Senior ProjectJ_Senior Project
J_Senior Project
 
Industrial training report
Industrial training report Industrial training report
Industrial training report
 
Introduction to Agile Hardware
Introduction to Agile Hardware Introduction to Agile Hardware
Introduction to Agile Hardware
 
15_CoOp Report Out - Angelo Stekardis
15_CoOp Report Out - Angelo Stekardis15_CoOp Report Out - Angelo Stekardis
15_CoOp Report Out - Angelo Stekardis
 
SRIJITH PARAKKAT UMAKANTH (Research Experience)
SRIJITH PARAKKAT UMAKANTH (Research Experience)SRIJITH PARAKKAT UMAKANTH (Research Experience)
SRIJITH PARAKKAT UMAKANTH (Research Experience)
 
“DESIGN AND DEVELOPMENT OF FIXTURE FOR FIXING BEARING IN CRANK-CASE
“DESIGN AND DEVELOPMENT OF FIXTURE FOR  FIXING BEARING IN CRANK-CASE“DESIGN AND DEVELOPMENT OF FIXTURE FOR  FIXING BEARING IN CRANK-CASE
“DESIGN AND DEVELOPMENT OF FIXTURE FOR FIXING BEARING IN CRANK-CASE
 
Helmet Detection using Machine Learning
Helmet Detection using Machine LearningHelmet Detection using Machine Learning
Helmet Detection using Machine Learning
 
Group 4 UCD Final
Group 4 UCD FinalGroup 4 UCD Final
Group 4 UCD Final
 
IRJET- Quality Inspection of Tire using Deep Learning based Computer Vision
IRJET-  	  Quality Inspection of Tire using Deep Learning based Computer VisionIRJET-  	  Quality Inspection of Tire using Deep Learning based Computer Vision
IRJET- Quality Inspection of Tire using Deep Learning based Computer Vision
 
Gearless Power Transmission Report
Gearless Power Transmission ReportGearless Power Transmission Report
Gearless Power Transmission Report
 
Car Game - Final Year Project
Car Game - Final Year ProjectCar Game - Final Year Project
Car Game - Final Year Project
 

Recently uploaded

Laundry management system project report.pdf
Laundry management system project report.pdfLaundry management system project report.pdf
Laundry management system project report.pdf
Kamal Acharya
 
Automobile Management System Project Report.pdf
Automobile Management System Project Report.pdfAutomobile Management System Project Report.pdf
Automobile Management System Project Report.pdf
Kamal Acharya
 
Online blood donation management system project.pdf
Online blood donation management system project.pdfOnline blood donation management system project.pdf
Online blood donation management system project.pdf
Kamal Acharya
 
CFD Simulation of By-pass Flow in a HRSG module by R&R Consult.pptx
CFD Simulation of By-pass Flow in a HRSG module by R&R Consult.pptxCFD Simulation of By-pass Flow in a HRSG module by R&R Consult.pptx
CFD Simulation of By-pass Flow in a HRSG module by R&R Consult.pptx
R&R Consult
 
Fruit shop management system project report.pdf
Fruit shop management system project report.pdfFruit shop management system project report.pdf
Fruit shop management system project report.pdf
Kamal Acharya
 
RS Khurmi Machine Design Clutch and Brake Exercise Numerical Solutions
RS Khurmi Machine Design Clutch and Brake Exercise Numerical SolutionsRS Khurmi Machine Design Clutch and Brake Exercise Numerical Solutions
RS Khurmi Machine Design Clutch and Brake Exercise Numerical Solutions
Atif Razi
 
Hall booking system project report .pdf
Hall booking system project report  .pdfHall booking system project report  .pdf
Hall booking system project report .pdf
Kamal Acharya
 

Recently uploaded (20)

fundamentals of drawing and isometric and orthographic projection
fundamentals of drawing and isometric and orthographic projectionfundamentals of drawing and isometric and orthographic projection
fundamentals of drawing and isometric and orthographic projection
 
Laundry management system project report.pdf
Laundry management system project report.pdfLaundry management system project report.pdf
Laundry management system project report.pdf
 
Automobile Management System Project Report.pdf
Automobile Management System Project Report.pdfAutomobile Management System Project Report.pdf
Automobile Management System Project Report.pdf
 
Natalia Rutkowska - BIM School Course in Kraków
Natalia Rutkowska - BIM School Course in KrakówNatalia Rutkowska - BIM School Course in Kraków
Natalia Rutkowska - BIM School Course in Kraków
 
Democratizing Fuzzing at Scale by Abhishek Arya
Democratizing Fuzzing at Scale by Abhishek AryaDemocratizing Fuzzing at Scale by Abhishek Arya
Democratizing Fuzzing at Scale by Abhishek Arya
 
Online blood donation management system project.pdf
Online blood donation management system project.pdfOnline blood donation management system project.pdf
Online blood donation management system project.pdf
 
Toll tax management system project report..pdf
Toll tax management system project report..pdfToll tax management system project report..pdf
Toll tax management system project report..pdf
 
Quality defects in TMT Bars, Possible causes and Potential Solutions.
Quality defects in TMT Bars, Possible causes and Potential Solutions.Quality defects in TMT Bars, Possible causes and Potential Solutions.
Quality defects in TMT Bars, Possible causes and Potential Solutions.
 
RESORT MANAGEMENT AND RESERVATION SYSTEM PROJECT REPORT.pdf
RESORT MANAGEMENT AND RESERVATION SYSTEM PROJECT REPORT.pdfRESORT MANAGEMENT AND RESERVATION SYSTEM PROJECT REPORT.pdf
RESORT MANAGEMENT AND RESERVATION SYSTEM PROJECT REPORT.pdf
 
Furniture showroom management system project.pdf
Furniture showroom management system project.pdfFurniture showroom management system project.pdf
Furniture showroom management system project.pdf
 
CFD Simulation of By-pass Flow in a HRSG module by R&R Consult.pptx
CFD Simulation of By-pass Flow in a HRSG module by R&R Consult.pptxCFD Simulation of By-pass Flow in a HRSG module by R&R Consult.pptx
CFD Simulation of By-pass Flow in a HRSG module by R&R Consult.pptx
 
Fruit shop management system project report.pdf
Fruit shop management system project report.pdfFruit shop management system project report.pdf
Fruit shop management system project report.pdf
 
RS Khurmi Machine Design Clutch and Brake Exercise Numerical Solutions
RS Khurmi Machine Design Clutch and Brake Exercise Numerical SolutionsRS Khurmi Machine Design Clutch and Brake Exercise Numerical Solutions
RS Khurmi Machine Design Clutch and Brake Exercise Numerical Solutions
 
Event Management System Vb Net Project Report.pdf
Event Management System Vb Net  Project Report.pdfEvent Management System Vb Net  Project Report.pdf
Event Management System Vb Net Project Report.pdf
 
Construction method of steel structure space frame .pptx
Construction method of steel structure space frame .pptxConstruction method of steel structure space frame .pptx
Construction method of steel structure space frame .pptx
 
Introduction to Machine Learning Unit-5 Notes for II-II Mechanical Engineering
Introduction to Machine Learning Unit-5 Notes for II-II Mechanical EngineeringIntroduction to Machine Learning Unit-5 Notes for II-II Mechanical Engineering
Introduction to Machine Learning Unit-5 Notes for II-II Mechanical Engineering
 
BRAKING SYSTEM IN INDIAN RAILWAY AutoCAD DRAWING
BRAKING SYSTEM IN INDIAN RAILWAY AutoCAD DRAWINGBRAKING SYSTEM IN INDIAN RAILWAY AutoCAD DRAWING
BRAKING SYSTEM IN INDIAN RAILWAY AutoCAD DRAWING
 
Online resume builder management system project report.pdf
Online resume builder management system project report.pdfOnline resume builder management system project report.pdf
Online resume builder management system project report.pdf
 
Arduino based vehicle speed tracker project
Arduino based vehicle speed tracker projectArduino based vehicle speed tracker project
Arduino based vehicle speed tracker project
 
Hall booking system project report .pdf
Hall booking system project report  .pdfHall booking system project report  .pdf
Hall booking system project report .pdf
 

Arduino Line Following Robot Technical Report

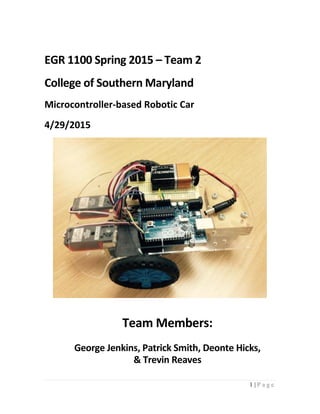
  • 1. 1 | P a g e EGR 1100 Spring 2015 – Team 2 College of Southern Maryland Microcontroller-based Robotic Car 4/29/2015 Team Members: George Jenkins, Patrick Smith, Deonte Hicks, & Trevin Reaves
  • 2. 2 | P a g e Table of Contents TitlePage………………………………………………………………………………………………………………………………………1 TableofContents………………………………………………………………………………………………………………………….2 Introduction……………………………………………………………………………………………………………………….……......3 TheRequiredDesign,Criteria,andConstraints…..............................................................................................4-5 EvolutionoftheDesign……………………………………………………………………………………………………………….5-9 FinalDesignandTestResults……………………………………………………………………………………………………..9-12 AppendixA–IdeaBank…………………………………………………………………………………………………………..13-14 AppendixB–PreliminaryDesigns………….………………………………………………………………………………...15-16 AppendixC–WorkingModel………………………………………………………………………………………………….16-17 AppendixD–CircuitDesign………………………………………………………………………………………………………….17 AppendixE–Program………………………………………………………………………………………………………….…18-19 AppendixF–AutoCAD………………………………………………………………………………………………………………...20 AppendixG–BillofMaterials………………………………………………………………………………………………..……..21 AppendixH–TestingResults………………………………………………………………………………………………………..21
  • 3. 3 | P a g e I Introduction Engineering is a branch of science and technology concerned with the design, building, and use of engines, machines, and structures. The usage of engineering is to invent or also to innovate to create a solution to a problem. The products produced by engineers are then utilized as assets to society by simplifying or bettering the lives of humanity. For this class, teams were faced with the Microcontroller-based design project. The purpose of the project was to design, build, and test a mechanically/electrically driven robotic car, controlled by a microcontroller, which can autonomously navigate a black-line track to the end of a course. In order to complete this project in thorough, teams had to go through the entire design process. The project had stages of defining the problem, brainstorming, product development, build, and testing and revisions. The basic concept of a car is what drove our design. The need was to have some type of chassis with a motor and wheels that moved the body. To integrate the concept of a car with the project, other elements had to be added like the line tracking sensors, breadboards, circuits, and the usage of Arduino software to develop some sort of control logic for the maneuvering the car around a course. By members having some prior experience in engineering from high school, the team knew the project was plausible, but still challenging since none of the members had any programming experience with Arduino. Through the design process, collectively the team gained a lot of knowledge and experience in many areas including circuits, programming, problem solving, and logic. The great thing about the course is that the teams make what they have out of the project. A lot of research and independent learning was necessary to be successful. Since this was the first time any of the members had dealings with Arduino, members went through a learning process to complete the project. Learning Arduino and applying the knowledge gained from the research was by far the most challenging portion of the project. The end product produced was the result of a lot of time and mistakes, but mostly from the growth of the members as students. This makes the value of the work and the results so much more significant since this was an original design that evolved and transitioned through the design process. The project was much like a real life situation where an engineer would get a problem and have to create the solution. The solution is never what is initially thought. Through research and product development, one can have some idea of what the product may be. Then after having a preliminary design and through testing and revisions, the idea evolves into the solution that meets all criteria. Engineering is a developmental processes and the project not only developed the final car product, but also team members as engineering students. The team work necessary, along with the actual learning portions behind this made the members better students than when started this course in January. In the rest of the paper, topics discussed will include the specified design criteria, the evolution of the design, and a discussion of the final product.
  • 4. 4 | P a g e II The Required Design, Criteria, and Constraints The project overview listed serval design criteria in which the project had to meet. The microcontroller-based robotic car had to autonomously follow a one inch wide black tape track along a white surface. The total length of the black tape track was specified to be approximately 15 feet. The time constraint for the car to complete the length of the course was set at less than one minute. This track would consist of straight and turn components, of which the turns were specified to be generally under 45 degrees, but did not exclude turns over this dimension. The track had a six inch border resulting from both sides of the black line and the car had to stay within this margin. All teams were supplied an Arduino-UNO microcontroller and it was specified teams had to use this in order to autonomously drive and steer the robotic car. The Arduino- UNO microprocessor would be utilized by running the code, or control logic, developed on Arduino software. Every team had to develop the control for the microcontroller-based robotic car within the Arduino software. The control logic consisted of the registered information from the line tracking sensors to steer and ultimately drive the microcontroller-based robotic car through the track. The control logic had to take the input from the sensors and from the input, produce an output via the motors in the design. Along with the Arduino-UNO microcontroller, teams were to be given two servo motors to drive and steer the car, and two line tracking sensors. All additional parts must be supplied by the team. The college would reimburse each team for up to seventy dollars, but the project did not have an official cost constraint, just that the maximum teams could spend and not have personal loses would be the seventy dollars. Several size requirements were specified. The car was to weigh less than six pounds. The car’s length and width when multiplied should give an area no greater than 100 square inches. Also the maximum volume for the car when multiplying length, width, and height should be less than six hundred cubic inches. These size requirements in reality were the milestones for meeting the other criteria. With a car over six pounds, without a tremendous amount of torque from the motors, would not meet the time criteria. A car with a larger area or volume would not have a chance in staying in the six inch border. The design was to be safe to operate, self-contained, one assembly, and compact that would autonomously operate when placed on the track and switched on. Our chassis was to be of our own design, and not pulled from off of the store shelf, in other words not bought offline or taken from a toy or other source. Teams were not supposed to just go and buy a kit or use a car already built. The design process cannot be followed if there is nothing to do. Our designed chassis was to be able to carry the microcontroller, the car’s power source, and it’s wiring all within itself, without a sloppy design. Our finished car design was to look professional and orderly. Items such as glue, tape, rubber bands, paperclips, staples, etc., were not to be used in the finished product.
  • 5. 5 | P a g e Hardware parts such as screws and brackets were to be considered to mount all of our fixtures onto our robotic car’s chassis, with all parts reflecting fabricated parts designed on AutoCAD. With all of the previous information considered, we were to make sure that our Arduino and provided materials are easily removable since they were to be used in future classes. These guidelines were the basis of the design and everything the team did. In the end, the design would be evaluated on this criteria so the whole point of the project is to meet the needs of the presented problem, which is conformed to this set of constraints. III Evolution of the Design After defining the problem by going through the design criteria, the team moved into the design portion. Our team’s strategy was that everyone take the knowledge of the constraints and come up with preliminary ideas. So each individual went home and sketched up an idea. These ideas were brought together and the ones that made the most sense and seemed plausible were put into what was called the “idea bank” (Appendix A). This idea bank is the basis for all of our design choices since this represents the best ideas the team could come up with that would be able to fit the needs of the task. The first idea, appendix A figure 1, was a four motor rectangle design with the sensors in the front and a series of LED’s so underneath the car would be bright enough so the sensors could take accurate readings. The second idea, appendix A figure 2, had two motors in the back with the front having two wheels without motors connected by an axil and the sensors in the front with LED’s. This design had a square shaped chassis. The third idea, appendix A figure 3, was the triangular design. This consisted of two motors in the back with a tapered chassis leading to a pivot wheel in the front surrounded by the sensors on either side. The fourth idea, appendix A figure 4, had two motors in the back and had two pivot wheels in the front with the sensors in between the two pivot wheels. The fifth idea, Appendix A figure 5, had two motors in the back and only had one sensor in the front with the intentions of using advanced programming techniques to only use the one. The last idea, appendix A figure 6, had one motor in the back controlling two back wheels and one servo motor in the front that would be used for steering control. After gathering these ideas, we noticed trends within the designs. Ideas two, three, four, and five all were very similar. All of these designs consisted of two motors in the back, and the front had no motor with the wheels either pivoting or of free motion by axil. So in order to simplify the decision process, we combined all these ideas into a singularity and grouped the ideas into preliminary design one (Appendix B, Figure 1). The other trend in the designs was with idea one and idea six. Similar logic between the two of control motors in the front and speed motors in the back. Again to simplify the decision process and allowing our team to have two preliminary designs, these ideas were grouped in preliminary design 2(Appendix B, Figure 2).
  • 6. 6 | P a g e After simplifying the idea bank into two preliminary designs, the team was faced with deciding which concept to go with. In order to pick which design to go with, feasibility studies were conducted on both preliminary designs. The first thing the team did was to make a projected parts and cost list for both designs. Preliminary idea one had a projected cost of $73.82 and would cost the team $40.73, see appendix B figure 3, due to the exemption of materials provided or members already had. Preliminary idea two had a projected cost of $84.65, which was projected to cost the team $47.73, see appendix B figure 4. Other factors had to then be considered under the feasibility study. For preliminary idea two, with four motors, the car would be fast. Overall it was expensive and to program four motors and have the power supply to run them would be a challenge. Preliminary idea one was a cheaper and more simplistic option. The consequence would be that the car would not go as fast as in preliminary idea two. The decision came down to speed verses simplicity. After considering both options, the team decided to go with preliminary idea one since this was a more feasible option all around knowing some speed would be sacrificed. Speed however was not that big of a factor considering the two motors should still be able to move the car fifteen feet in under a minute. Now having an initial design to work off of, the team found it necessary to get a clear concise image of exactly what the design would be. From this meeting, the team gathered that two DC motors would be connected to the back of a surface, which we preferred to be Plexiglass. From the point the motors attached on either side of the chassis, the team wanted the surface to be tapered to two inches. On the front edge, two sensors would be mounted at the end of the tapered edge. Also in the front the team wanted to place a pivot wheel in the center of the front edge. On top of the chassis secured would be the Arduino UNO board, motor shield, and battery. From this collective vision, the team would then obtain the needed parts. Before actually building the car, a working model simulation had to be created reflecting the design. Since this software is only in two dimensions, to reflect the actual project within the software is impossible. The only actual uses of the software is to create a straight line track and have an imported car go along that plane. The team was able to give the car a projected 0.5 feet per second velocity and 1.5 pound weight to make the simulation more realistic. 0.5 feet per second was the goal for speed and 1.5 pounds was a rough estimate of how much the car was going to weigh. With these values, the working model simulation was made with output meters indicating time, displacement, force, and torque (See appendix C figure 1). Also from working model, these output meters could be exported to excel to make charts. These charts could be found in the team journal pages 13 through 19. As an engineer, the idea is to build your product as cheap as possible so that the product can earn more profits for the company. When acquiring the parts for the car, the team wanted to spend as little as possible in order for the team to theoretically “make more profits” from the design. So the team used as many free materials as possible, and
  • 7. 7 | P a g e as engineers, put these together to make the desired product. Doing so however changed up our design. While in class, Professor Gopinath brought in boxes of parts that teams could use potentially for designs. In this box, the team collected a chassis, wires, as well as two continuous servo motors and two mounting brackets for the motors. The chassis was not the shape we had in mind. It was rectangular with a curved front and rear side. So by using this and the continuous servo motors, the design had changed just from getting parts that altered the design. Other than the chassis, motors, wires, and brackets, the team already was provided with the Arduino and circuit boards along with the sensors. The only parts the team needed to build the car was two wheels for the motors and the pivot wheel along with the motor shield and battery. The wheels for the motors were found in an unused mechanics construction kit and members had fasteners so the only actual parts ordered were the pivot wheel and motor shield, and the battery was bought. These parts came in and the construction of the car was started. The first part of construction was to mount the motors. Each motor was connected to a single bracket and connected to the chassis. After doing this, the team noticed that each motor was not properly secured with only one bracket. To fix this, two brackets were made using a piece of malleable metal a member had. Each motor was then connected to a second bracket and were properly secured. The sensors were secured as well as the Arduino board, of which the motor shield was placed, and the breadboard was secured next to the Arduino board. Lastly the pivot wheel was attached. This is where we faced another problem. The pivot wheel was too short. If fastened to the chassis, the front of the car with the pivot wheel would have been much too low so a half inch board was placed between the chassis and pivot wheel to accommodate for this difference in height. At this point, the team had the envisioned design built with a few changes. Through testing the team was sure more changes were to come. In order to test, first the team had to wire the electrical portions and write a program. For the circuit (Appendix D), power and ground was taken from the motor shield to the breadboard. All electrical components were then connected to the breadboard. The team connected the power and ground to both motors and sensors and then took the output wires of each component to the motor shield. What was soon noticed was that the motor shield actually served no function in the design since everything could be connected direct to and from the Arduino board. The cause of this was because the motor shield would be necessary DC motors were a part of the design, but with the continuous servos, the motor shield was unnecessary. The program needed to perform four basic functions. The car needed to go straight if both sensors were in the white, turn left if the left sensor was in black, turn right if the right sensor was in black, and to stop at the end of the track. The teams approach to the program was structured in the analog read function. After writing an analog read program, the program could take the input of the sensor and provide a value. Testing found that when in white, the sensor typically had values around nine hundred while in
  • 8. 8 | P a g e the black had values above one thousand. So in a very simple program using if else statements, based on the testing data value range that the sensors should be in, the car could perform each of the functions (See appendix E figure 1). The program was written so that with a sensor value under 950, the sensor would be considered on a white surface and above would be black. If both were in white, both motors should go forward. If the left sensor was in black but the right was in white, turn the left motor off and keep the right forward to turn left. If the left sensor was in white but the right was in black, keep the left motor forward and turn the right off to turn right. Lastly if the left sensor was in black and the right was in black, turn the left and right motors off since this would be the end of the track. After completing this, the car was ready to be tested. When placed on the track, the car started to move forward but trouble came at the first turn. At that point, the sensors were too close together and both read black so the car stopped. The team also noticed because the pivot wheel was in front, the car kept twitching from the left and right and overall there was very little horizontal stability within the motion. Based on the test, the changes that needed to be made were to move the pivot wheel to the back of the car and to increase the distance between the sensors. Doing so would result in a faster and more efficient car, and the car would not be able to navigate turns without the increase in sensor distance. The motors and wheels were moved to the front, the sensors were placed a quarter inch further apart, and the pivot wheel was then secured to the back. When tested again, the car actually was able to make it completely through the course in about forty seconds. The team was very satisfied with this time considering it was about twenty seconds under the time criteria. With a completed build, the only changes that would be needed would be possible modifications to the circuit and program to have a faster car. First the team looked at possible circuit modifications. The initial idea was to connect the battery into the power and ground in the breadboard. From that, connect power and ground to the Arduino board and also have all components feeding off the same line in parallel. When doing this, the motors did go a little faster. Research was done on the Arduino board and the information suggested that doing the circuit like this was not good for the Arduino board. The reason of this was since the 9 volt was supplying 9 volts and this was leading into the 5 volt power supply of the board. The maximum value going into 5 volt supply was meant to be less than 7 volts. With a 2 volt surplus, this could cause damage to the board, so the circuit was changed back the original one made. The program was then looked at to be modified. The original program worked, but could most likely be improved upon. The team focused on alternate methods of turning the car. The current method of keeping one motor on and turning the other motor off seemed like an inefficient approach. The new approach tried was a counter-steering approach, see Appendix E figure 2. To go forward as in the original, both motors were full speed forward. To turn right, the left motor was full speed forward and the right motor was full speed backwards. To turn left, the right motor was full speed forward and the left
  • 9. 9 | P a g e motor was full speed backwards. The last function, to stop, was held constant by turning both motors off. When tested, this program was able to complete the course much more effectively. When testing however, the car failed several times to complete the course. When the car was trying to maneuver a sharp corner, often times it would stop. Based on the program, the car would stop if both sensors were registering black, meaning the end of the course, but obviously there was a fault somewhere. The initial solution was to increase the distance between the sensors once again. Doing so would allow the car to definitely have enough room on either side of the black line and resulting in not registering both sensors in black. When testing however, the car still failed. By doing so, the team moved the sensors back to the original location. The next approach was to measure new values of the track utilizing the analog read program once again. When reevaluating these values, it was found that the program value should be 975. Initially the program had a value of 950 for the sensor values, but changing this to 975 was needed. The value had to be 975 since at 950, sometimes the sensor was reading a value in the 960 range when on white. Since this 960 was above the 950 mark, the program read the senor as on black and would then stop the motors. Testing indicated that changing the value to 975 solved the problem of the car stopping in the middle of the track. From the point the value was changed, the car was able to complete the course every time and at this point, the team had a finalized design. IV Final Design and Testing Through the design process, the product had evolved very much. Once defining the problem, the team brainstormed and created the two preliminary designs. From that point, feasibility studies were conducted and an idea was chosen. At that moment, the team had a general idea of what the end result of the project would be. The vision all of the members had steadily evolved as parts were acquired, flaws were exposed, and through testing. From all the work, change, and the basis from an evolved vision, the final car product was derived. This car, meeting all design criteria specified, was the result of the design process. This is the team 2 car:
  • 10. 10 | P a g e The previous pictures show the final design, reflecting all the mentioned changes in the evolution of the design section. As is shown, the sensors are in the front along with the two continuous servo motors. The back of the design has the pivot wheel which is attached to the needed piece of wood to make a level surface. On top rests the secured Arduino board along with the breadboard and the battery. Breadboard cables are used to connect the motors to the breadboard and also the wires of the sensors and motors to the Arduino board. From the pictures, the brackets connecting the motor to the chassis is not clear, but on either side of the motor is secured to the chassis with a bracket. This complete design exclusive of common fasteners was reflected in an AutoCAD drawing (See appendix E). All dimensions are exact from the actual car and all components are included. The AutoCAD drawing provides the left side, top, and rear views. The most difficult part of constructing the AutoCAD drawing was the pivot wheel. Since the pivot wheel was at an angle and slightly offset from the wood based on orientation, to make these properties conform to the AutoCAD drawing was a challenge, but the actual orientation of the wheel is reflected after some difficulty in the drawing. Once having the AutoCAD complete, the car was weighed at 1.4 pounds and was measured to have an area of 44 in2 and a volume of 132 in3. The team was able to make a bill of materials based on the finished design (See Appendix F). To create the bill of materials, the team very simple put down every part in the excel file. The parts included: 1 chassis, 1 Arduino UNO, 1 breadboard, 2 optical sensors, 2 continuous servo motors, 12 breadboard cables, 2 wheels, 4 mounting brackets, 1 pivot wheel, 12 fasteners (including nuts and bolts), 1 - 9 volt battery, 1- 9 volt battery adapter, and the wood block. All of these simplistic materials serving function in the design. After listing all parts, the team looked up the price of each part using the internet for parts we did not buy, which was the majority of the parts. The two parts that were bought online had the price recorded based off of the receipt. Every part has value, the difference with the car is the team only bought two parts for the final design. Also for the bill of materials, the quantity of the part was recorded. This saved the team from having to record the same part on multiple lines. Other than the price and quantity, the total cost
  • 11. 11 | P a g e and the cost to the team were recorded and also the source of the part. The source is just where the team acquired the part. Most of the parts were from Professor Gopinath bringing the supplies he had to class, others were from team members homes, the rest were ordered online. After all of the parts were documented, looked up for price, and then recorded, the team had the total cost of the design and also the cost to the team. In total, the car cost $69.29 for all of the parts. In reality, the car only cost the team $4.74 since the only parts the team bought were the pivot wheel and also the battery. The total cost of the car was very cheap. The cost to the team was basically a minimum. By the team utilizing the parts already available from the college, the parts needed to buy independently was minimized. The most the college would reimburse teams was $70.00 so our team only spending a little under $8.00 is much under this constraint. The only discrepancy of the team cost is the motor shield which was bought for the original design but then not utilized in the final design so the motor shield was not included in the bill of materials. With the final design came the testing and evaluation portion of the design process. The testing procedure the team used to measure performance was quite basic. The team utilized the track provided in the class. With the car, the car was turned on and started the car at the beginning of the track. Once the car stared to move, a member would start the clock. The only performance aspect the car had to meet was to complete the course in under a minute so timing the car to complete the course would measure the time constraint. Once the car traveled completely through the track, the time was stopped and then recorded. Fifteen trials were conducted and the average time was taken of these trials. The testing results, see Appendix G, indicated that the car meets the time constraint by having an average time under 1 minute. When testing, the first two trials failed. The failure was a result of the sensors being too close together as mentioned in the evolution of the design. The next two trials were a success. Then the following two were fails again, which was discussed in the evolution of the design as the team needed to modify the sensor values to 975. After changing the sensors, the rest of the trials were successful, having times in the 45-46 second range. The average time for the car to complete the track was 45.82 seconds, being a little over 14 seconds under the one minute criteria. When reducing this to speed, the car on average goes 0.3274 feet per second. Based on the testing data and the weight measured previously, the working model simulation was then updated to reflect these new values (Appendix C, Figure 2). Once having the car meeting the time criteria, the project was then officially completed. The only remaining parts was the presentation and this paper. Before being able to do either of the deliverables, an evaluation would have to be done on the design to see how the car meets all the listed criteria. For performance, the car did meet the time criteria by being under one minute. The speed of the car was 0.3274 feet per second. Early on in the project when doing the initial working model, the team set the speed for 0.5 feet per second so the car did not end up as fast as projected. This is mainly a result of using
  • 12. 12 | P a g e the continuous servo motors instead of the DC motors. The team knew all along by using the servo motors, speed would be sacrificed, but since these motors were available and since the car still meets the time, it can be concluded that using these motors did not affect performance to an extent. Based on testing, the car also met the criteria for staying within the 6 inch boundaries. The car at no point during testing left the track and for the most part stayed centered so based on this, the car meets the criteria. Other criteria the car met was utilizing Arduino, being safe to operate, being portable, and being self-contained. The car also meets all size criteria. The car weighed 1.4 pounds and the maximum specified by the project overview was 6 pounds. The car had a total area of 44 in2 and a volume of 132 in3, both of which were well under the designated constraint. Overall, the car meets all of the listed criteria and based off of that, the team was able to conclude the project was a success. During the course of the project, the team worked effectively. The work of the project was split up using the strengths of the members. Team leader George Jenkins had a lot of experience from high school in circuits and in programming so his role for the car was those. Team member Patrick Smith had experience in construction, so he led the build portion of the project. Trevin Reaves was the best of the team at AutoCAD so he was designated to do the AutoCAD drawing for the car. Team member Deonte Hicks was the visionary as the team utilized his sketching abilities to get a clear picture of the design and he also obtained most of the materials. The working model of the project was a collective effort of the team. The journal of the project was kept by team leader George Jenkins, with the help of the rest of the team members. The presentation and report was a collective effort of all of the members. Each member was able to provide key insight on each individual’s expertise within the project. This enabled the deliverables to have accurate and precise information on every aspect of the design process. By utilizing the strengths and weaknesses of the members, the work load was able to be evenly distributed among the team. This allowed members to focus on strengths and let members that are better in other areas to do what they are best at. Overall by doing work in this fashion, it allows for a more effective and productive team. Also by doing the project in this manner, this reflects the real world greatly. In the real world as an engineer, one will be a part of a team of people who have expertise outside of yours. The success of the project depends on each individual to do their own part. Without a part, the project cannot be complete. Members rely on one another for the success of the project. Trust is big, but as long as every member does their part, the project will be a success. In team 2’s case, every member did their role and in the end, the car worked by meeting all criteria and every portion of the project was completed on time. Much was learned from this experience and if it was not for every member doing their role, the project would have never been the success it turned out to be.
  • 13. 13 | P a g e Appendix A – Idea Bank – Journal Page 4-5 Figure 1: 4 motor rectangle design Figure 2: 2 motor square design Figure 3: 2 motor triangular design
  • 14. 14 | P a g e Figure 4: 2 motor rectangular design Figure 5: 2 motor rectangle design Figure 6: 2 motor rectangle design
  • 15. 15 | P a g e Appendix B – Preliminary Designs – Journal Page 10-11, 37-38 Figure 1: Preliminary Idea 1 Figure 2: Preliminary Idea 2 Figure 3: Idea 1 Cost Part Retail Price Quantity Used Total Cost Team Cost Plexiglass Sheet $20.00 (1/8) $2.50 $2.50 Battery $3.50 1 $3.50 0 Arduino $6.25 1 $6.25 0 Optical Sensor $10.00 2 $26.67 0 Motor $5.00 2 $10.00 $10.00 Wheels $2.50 3 $7.50 $7.50 LED $0.50 1 $0.50 0 Nuts $4.99 (12/50) $1.20 $1.20 Screws $4.99 (12/50) $1.20 $1.20 Piviting Bracket $2.50 1 $2.50 $2.50 Motor Shield $12.00 1 $12.00 $12.00 $73.82 $40.35 Total Cost Bill of Materials - (2 Motor Design) Cost to Team
  • 16. 16 | P a g e Figure 4: Idea 2 Cost Appendix C – Working Model – Journal Page 13, 36 Figure 1: Original Working Model, see charts journal pages 13-19 Part Retail Price Quantity Used Total Cost Team Cost Plexiglass Sheet $20.00 (1/6) $3.33 $3.33 Battery $3.50 1 $3.50 0 Arduino $6.25 1 $6.25 0 Optical Sensor $40.00 2 $26.67 0 Motor $5.00 4 $20.00 $20.00 Wheels $2.50 4 $10.00 $10.00 LED $0.50 1 $0.50 0 Nuts $4.99 (12/50) $1.20 $1.20 Screws $4.99 (12/50) $1.20 $1.20 Motor Shield $12.00 1 $12.00 $12.00 84.65 $47.73 Bill of Materials - (4 Motor Design) Total Cost Cost to Team
  • 17. 17 | P a g e Figure 2: Final Working Model Appendix D – Circuit Design – Journal Page 24
  • 18. 18 | P a g e Appendix E – The Program – Journal Page 27-28, 32-33 Figure 1: Original Program
  • 19. 19 | P a g e Figure 2: Revised Program
  • 20. 20 | P a g e Appendix F – AutoCAD – Journal Page 34
  • 21. 21 | P a g e Appendix G – Bill of Materials – Journal Page 39 Appendix H – Testing Results – Journal Page 35 Part Retail Price Quantity Used Total Cost Team Cost Source Chassis $2.50 1 $2.50 $0.00 CSM Arduino UNO $6.25 1 $6.25 $0.00 CSM Breadboard $3.59 1 $3.59 $0.00 CSM Optical Sensor $13.33 2 $26.66 $0.00 CSM Continuous Servo Motor $8.59 2 $17.18 $0.00 CSM Breadboard Cables $0.06 12 $0.72 $0.00 CSM Wheel $1.25 2 $2.50 $0.00 George Mounting Bracket $0.30 4 $1.20 $0.00 Deonte Pivot Wheel $1.25 1 $1.25 $1.25 Amazon.com Fasteners $0.24 12 $2.88 $0.00 Deonte 9 Volt Battery $3.49 1 $3.49 $3.49 Walmart.com 9 Volt Battery Adapter $0.60 1 $0.60 $0.00 CSM Wood Block $1.89 (1/4) $0.47 $0.00 George $69.29 $4.74 Bill of Materials Total Cost Total Cost to Team Trial Time (Seconds) 1 Fail 2 Fail 3 44.74 4 43.89 5 Fail 6 Fail 7 46.51 8 45.54 9 46.02 10 46.48 11 45.89 12 45.63 13 46.38 14 46.46 15 46.52 Average 45.82 Testing Results