Downloaded 19 times


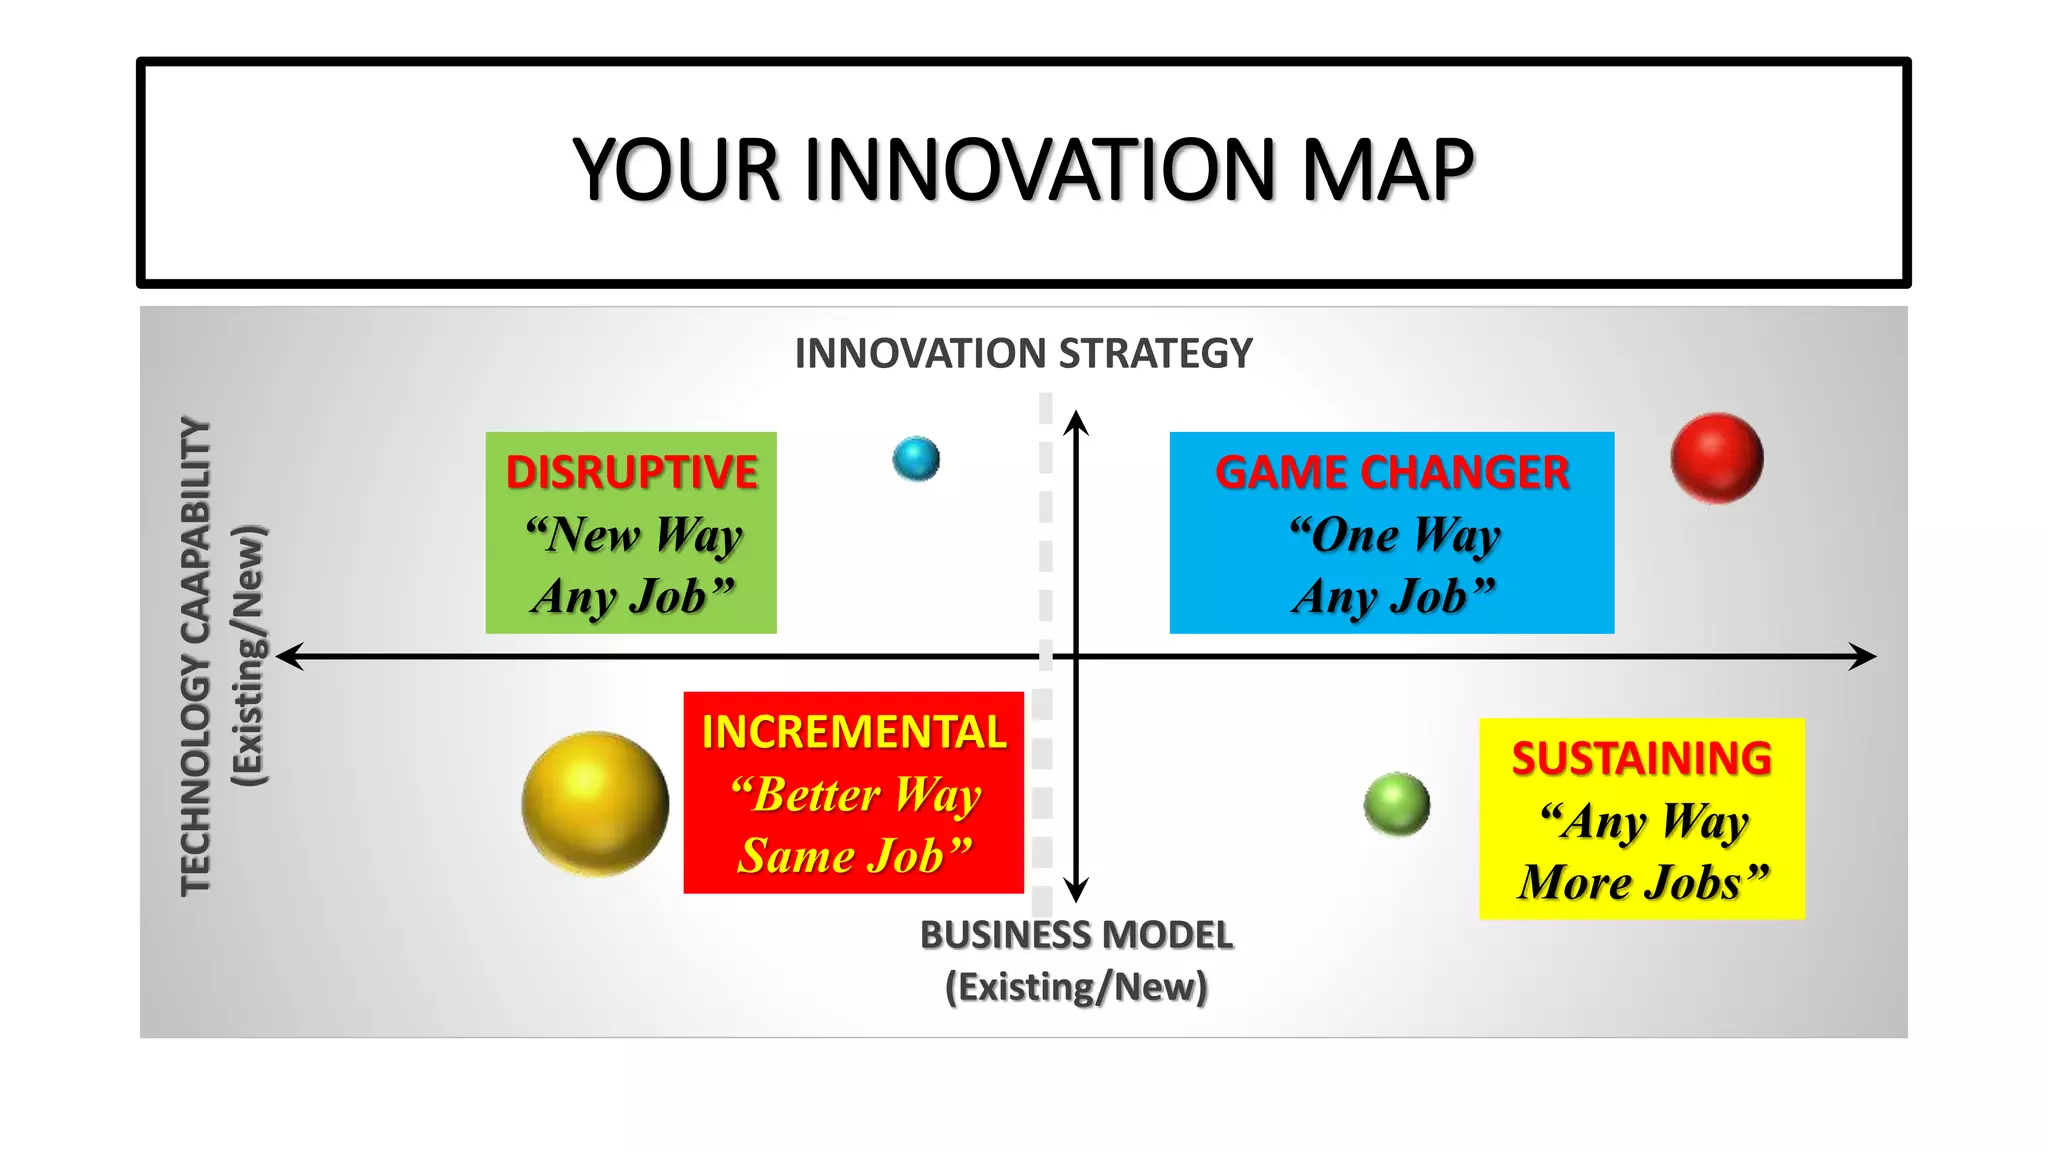
![INNOVATION MAP SCORECARD : CALCULATION
COMPETITOR
ATTRIBUTES
TECHNOLOGY
CAPABILITY
(X AXIS)
BUSINESS
MODEL
(Y AXIS)
MARKET SHARE
(SIZE)
TOTAL RAW
SCORE (s)
Maximum : 25
Minimum : 0
Maximum : 25
Minimum : 0
m%
XY PLOT
COORDINATES :
[ s*0.4 – 5 ]
Maximum : 5
Minimum : -5
Maximum : 5
Minimum : -5
[m%*10]](https://image.slidesharecdn.com/tcmstep1technologyanalysis-161229193652/75/Tcm-step-1-technology-analysis-30-2048.jpg)


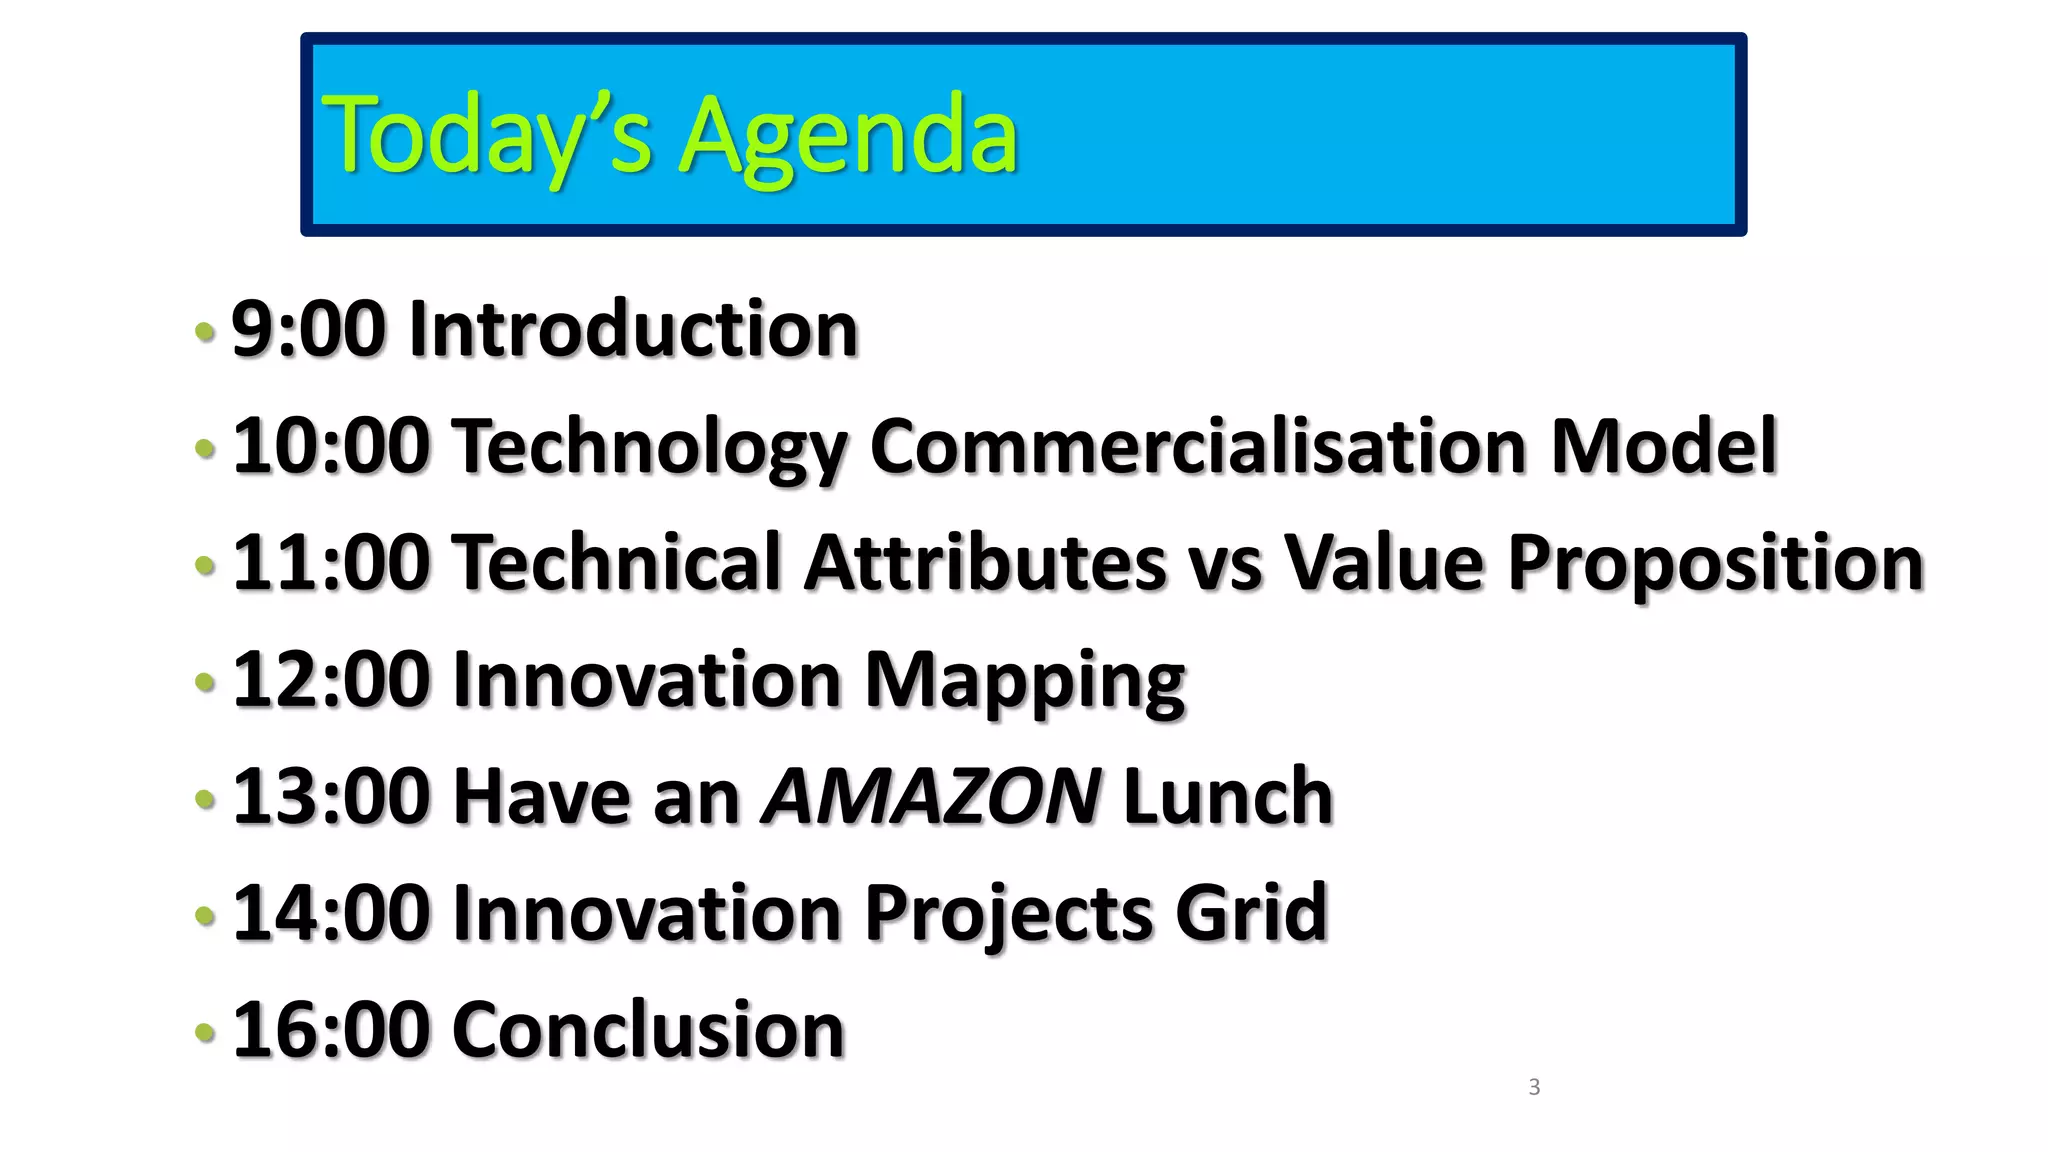
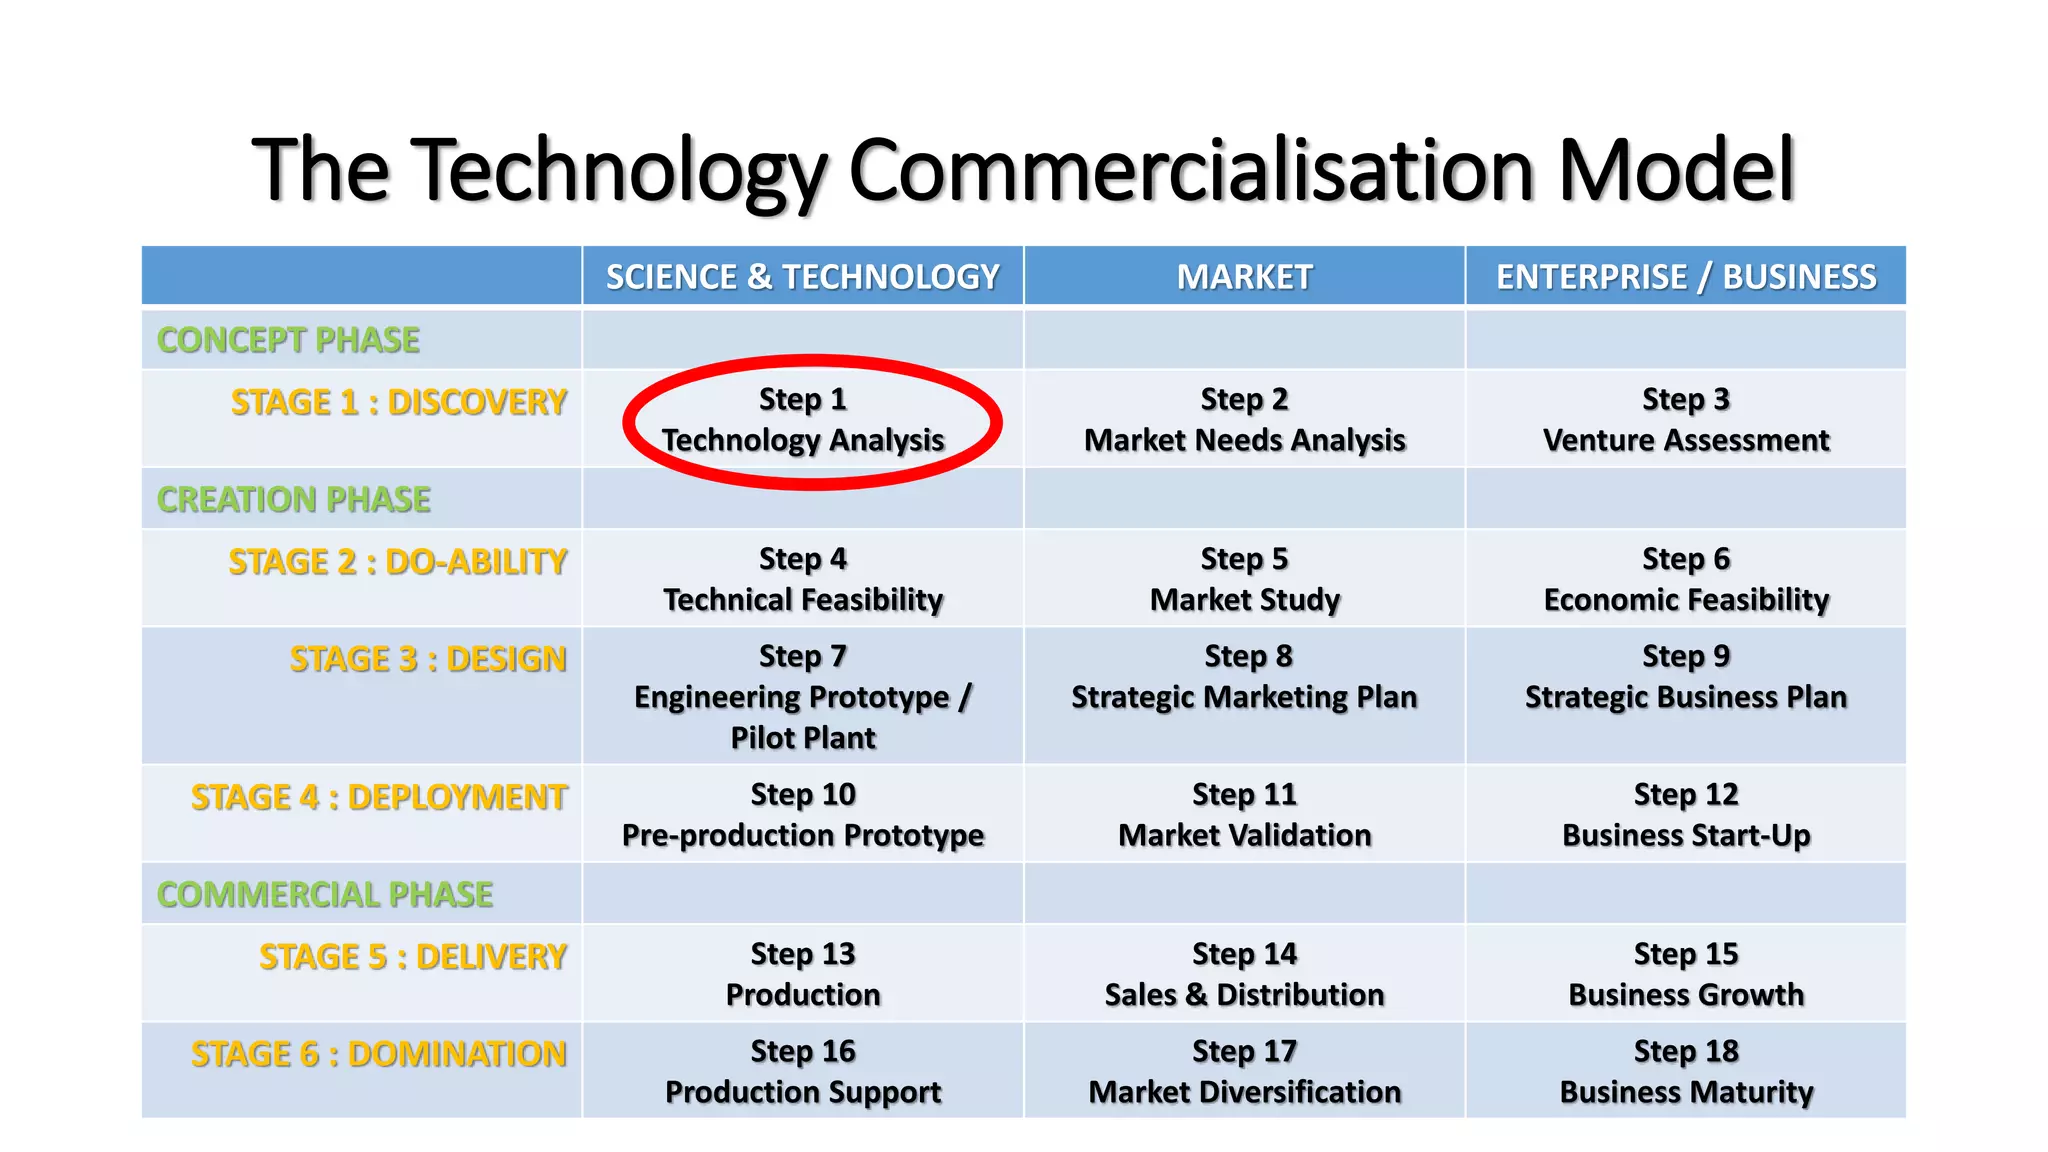
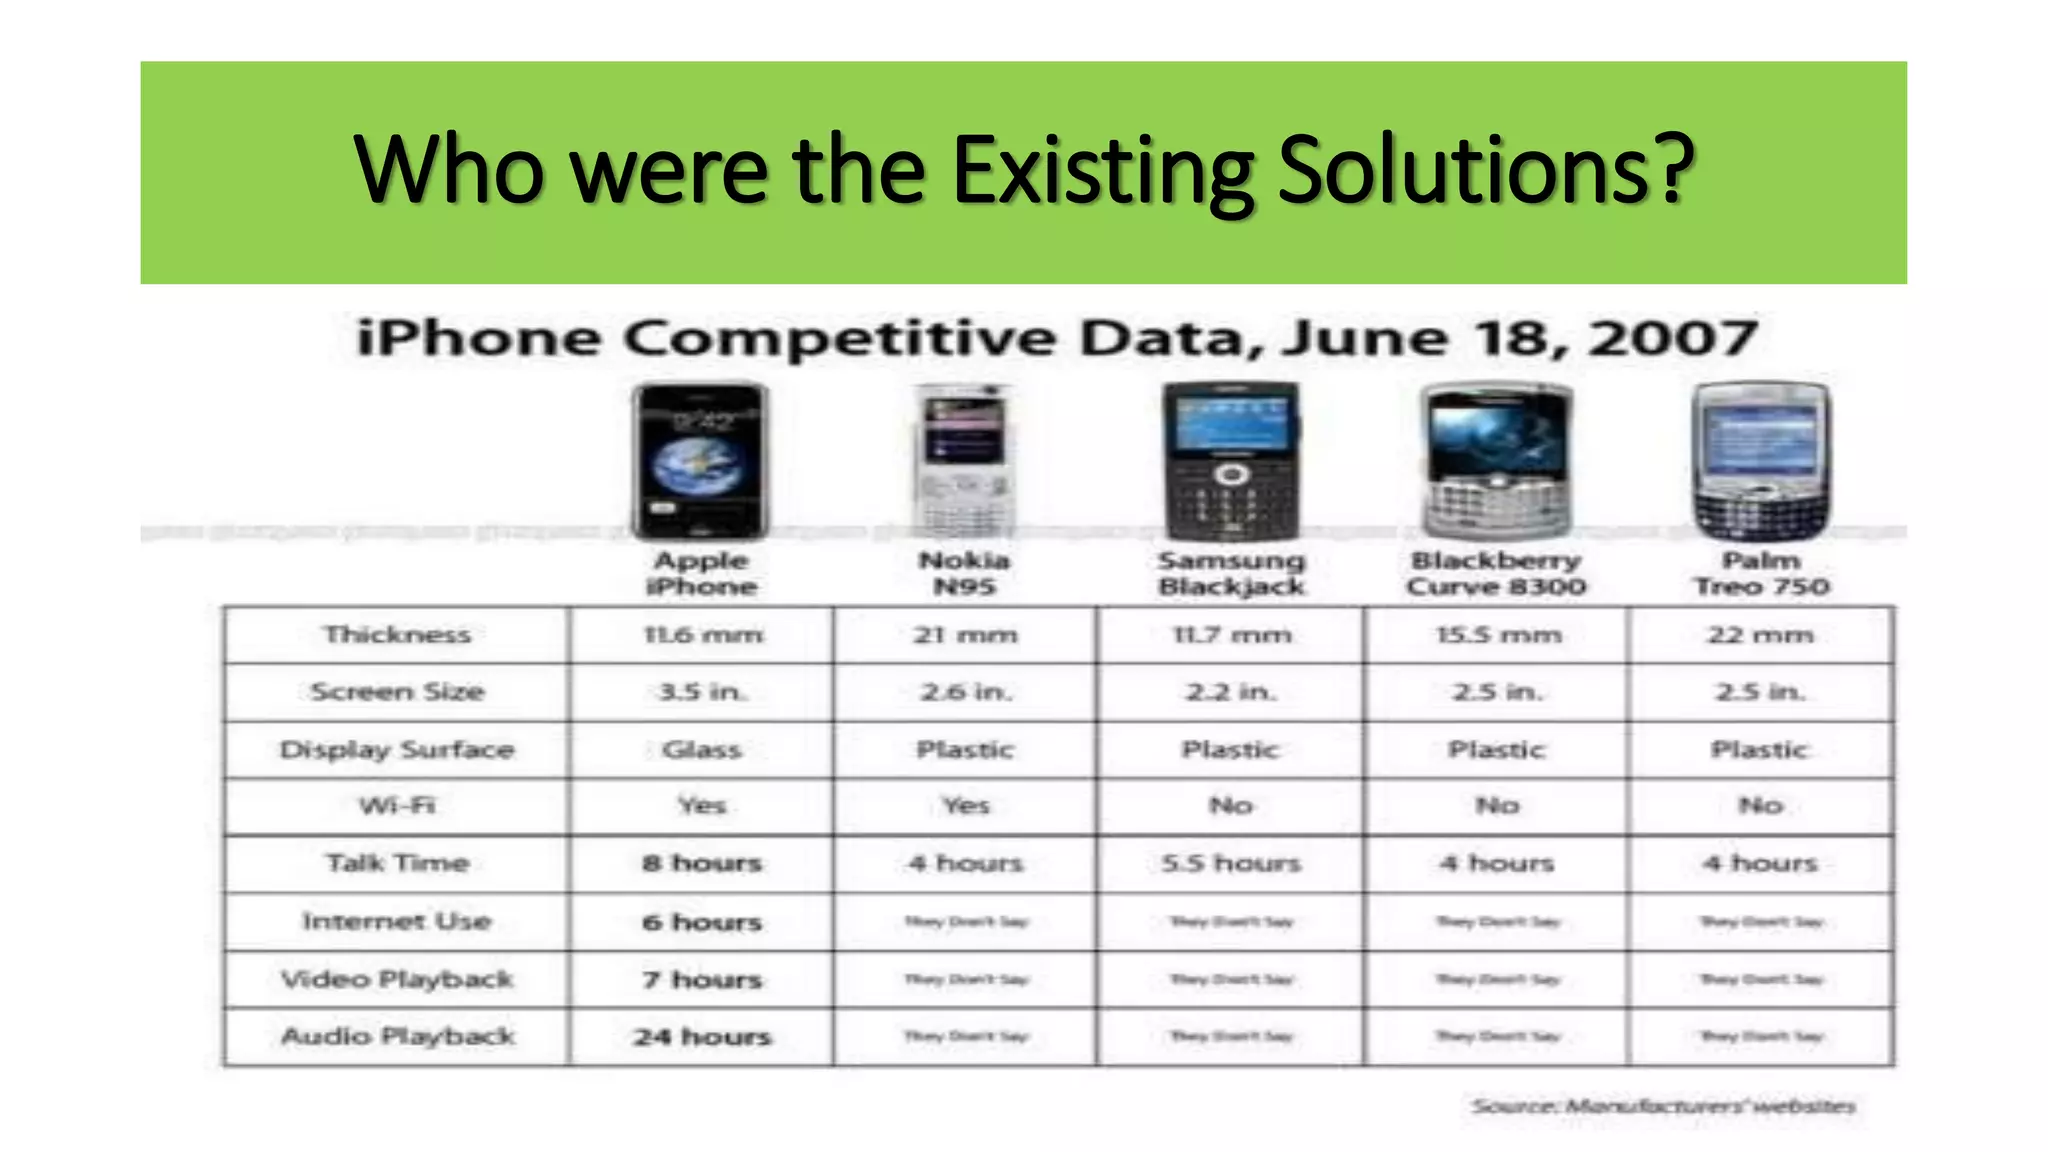
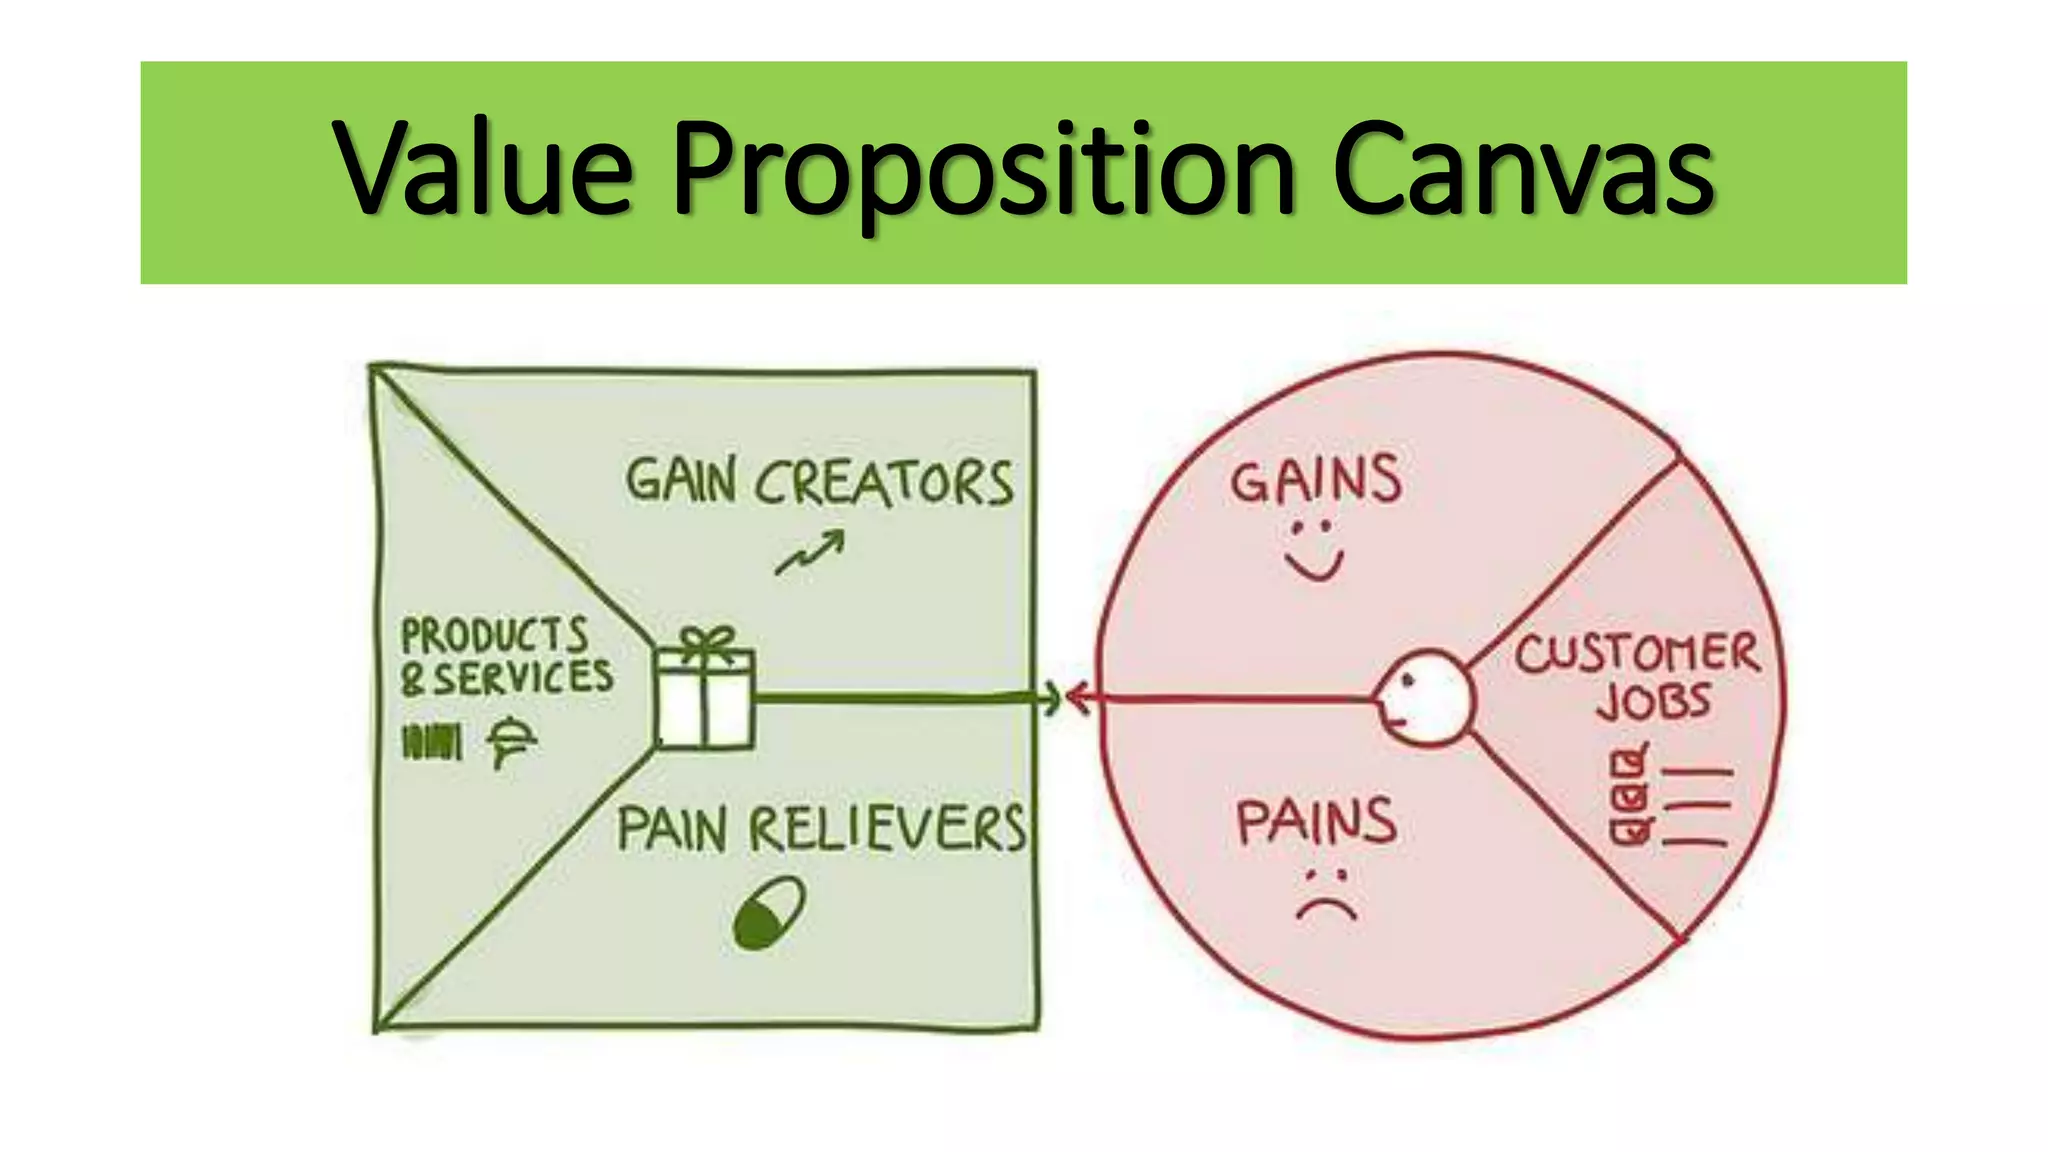
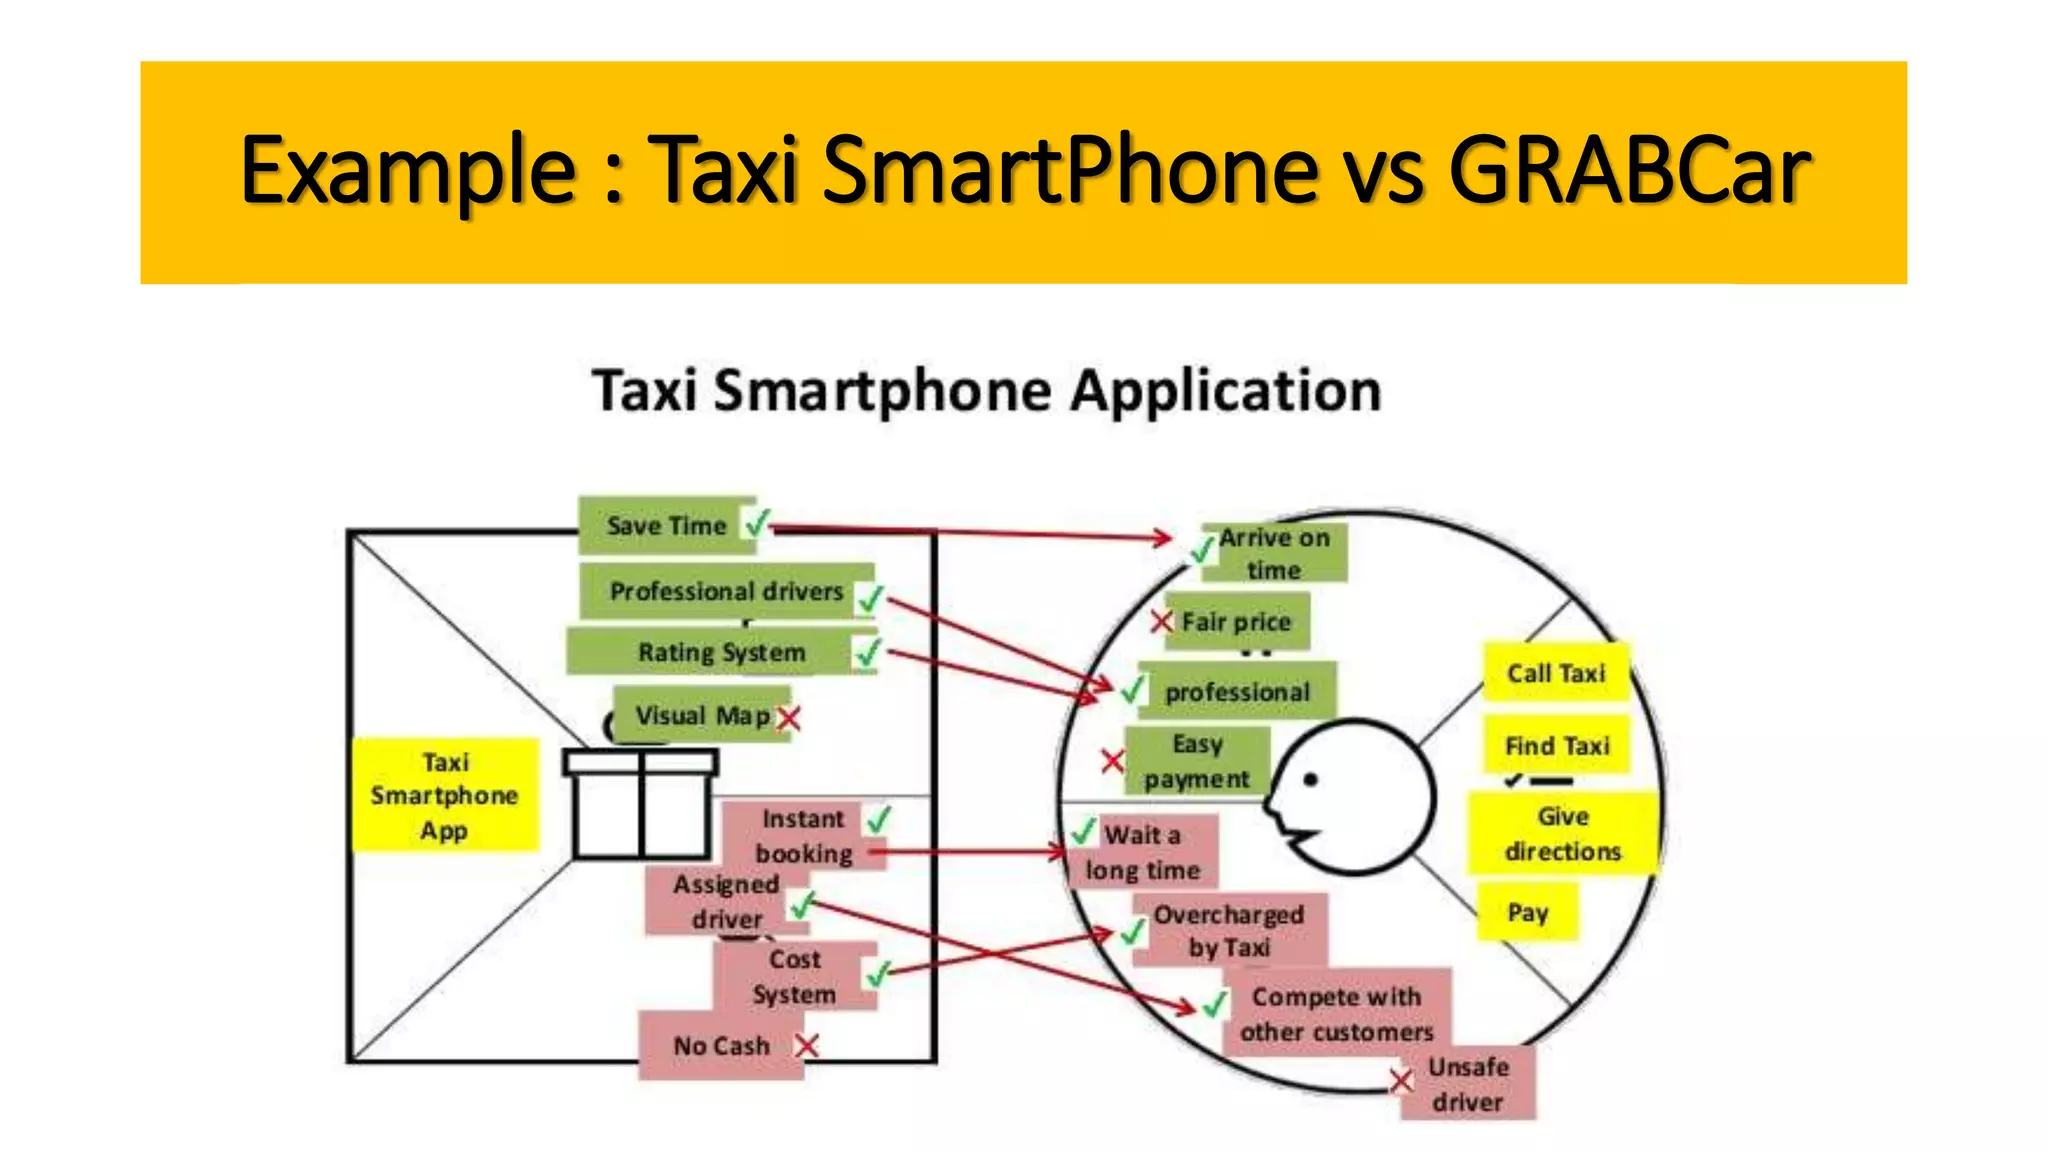
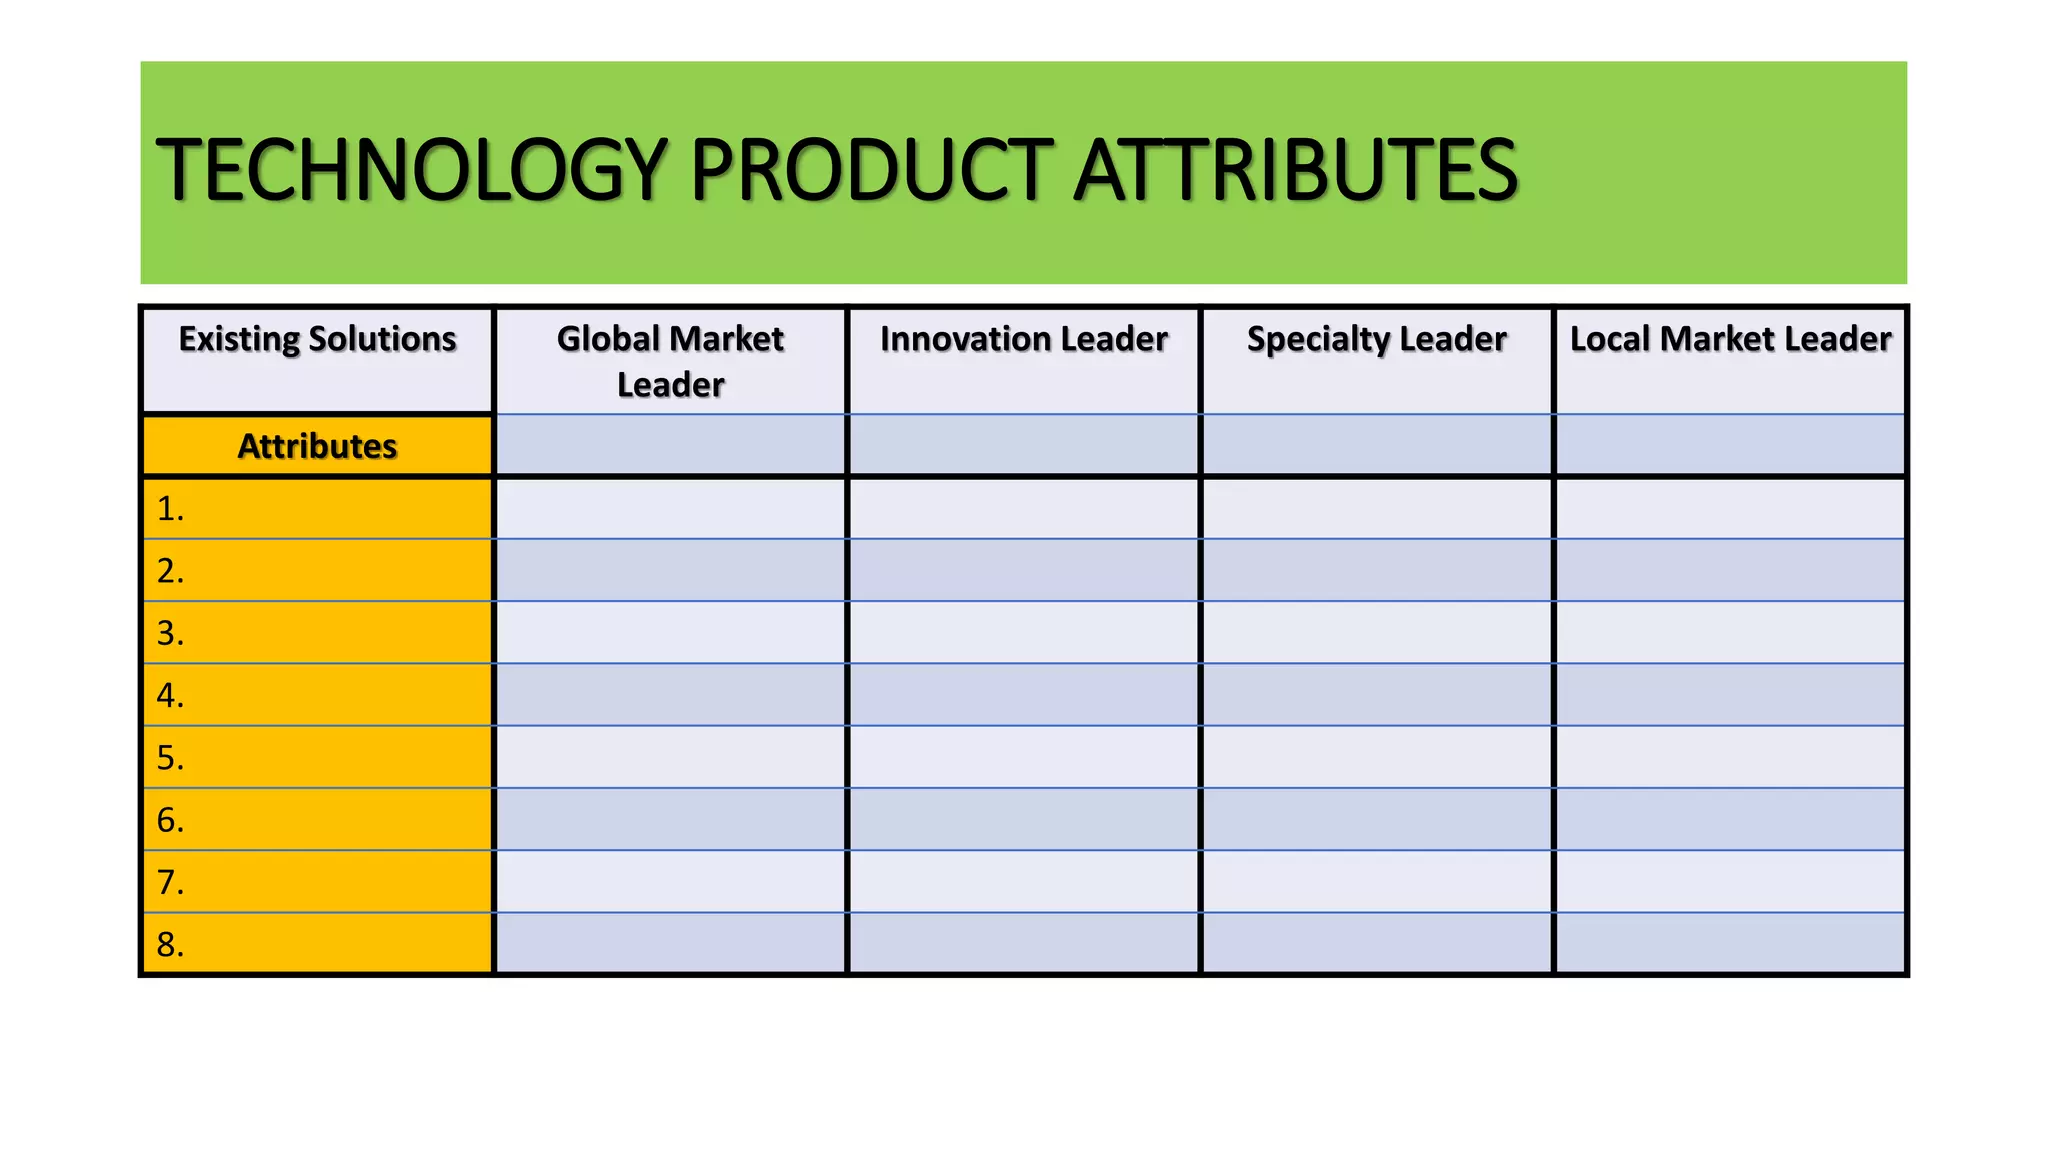
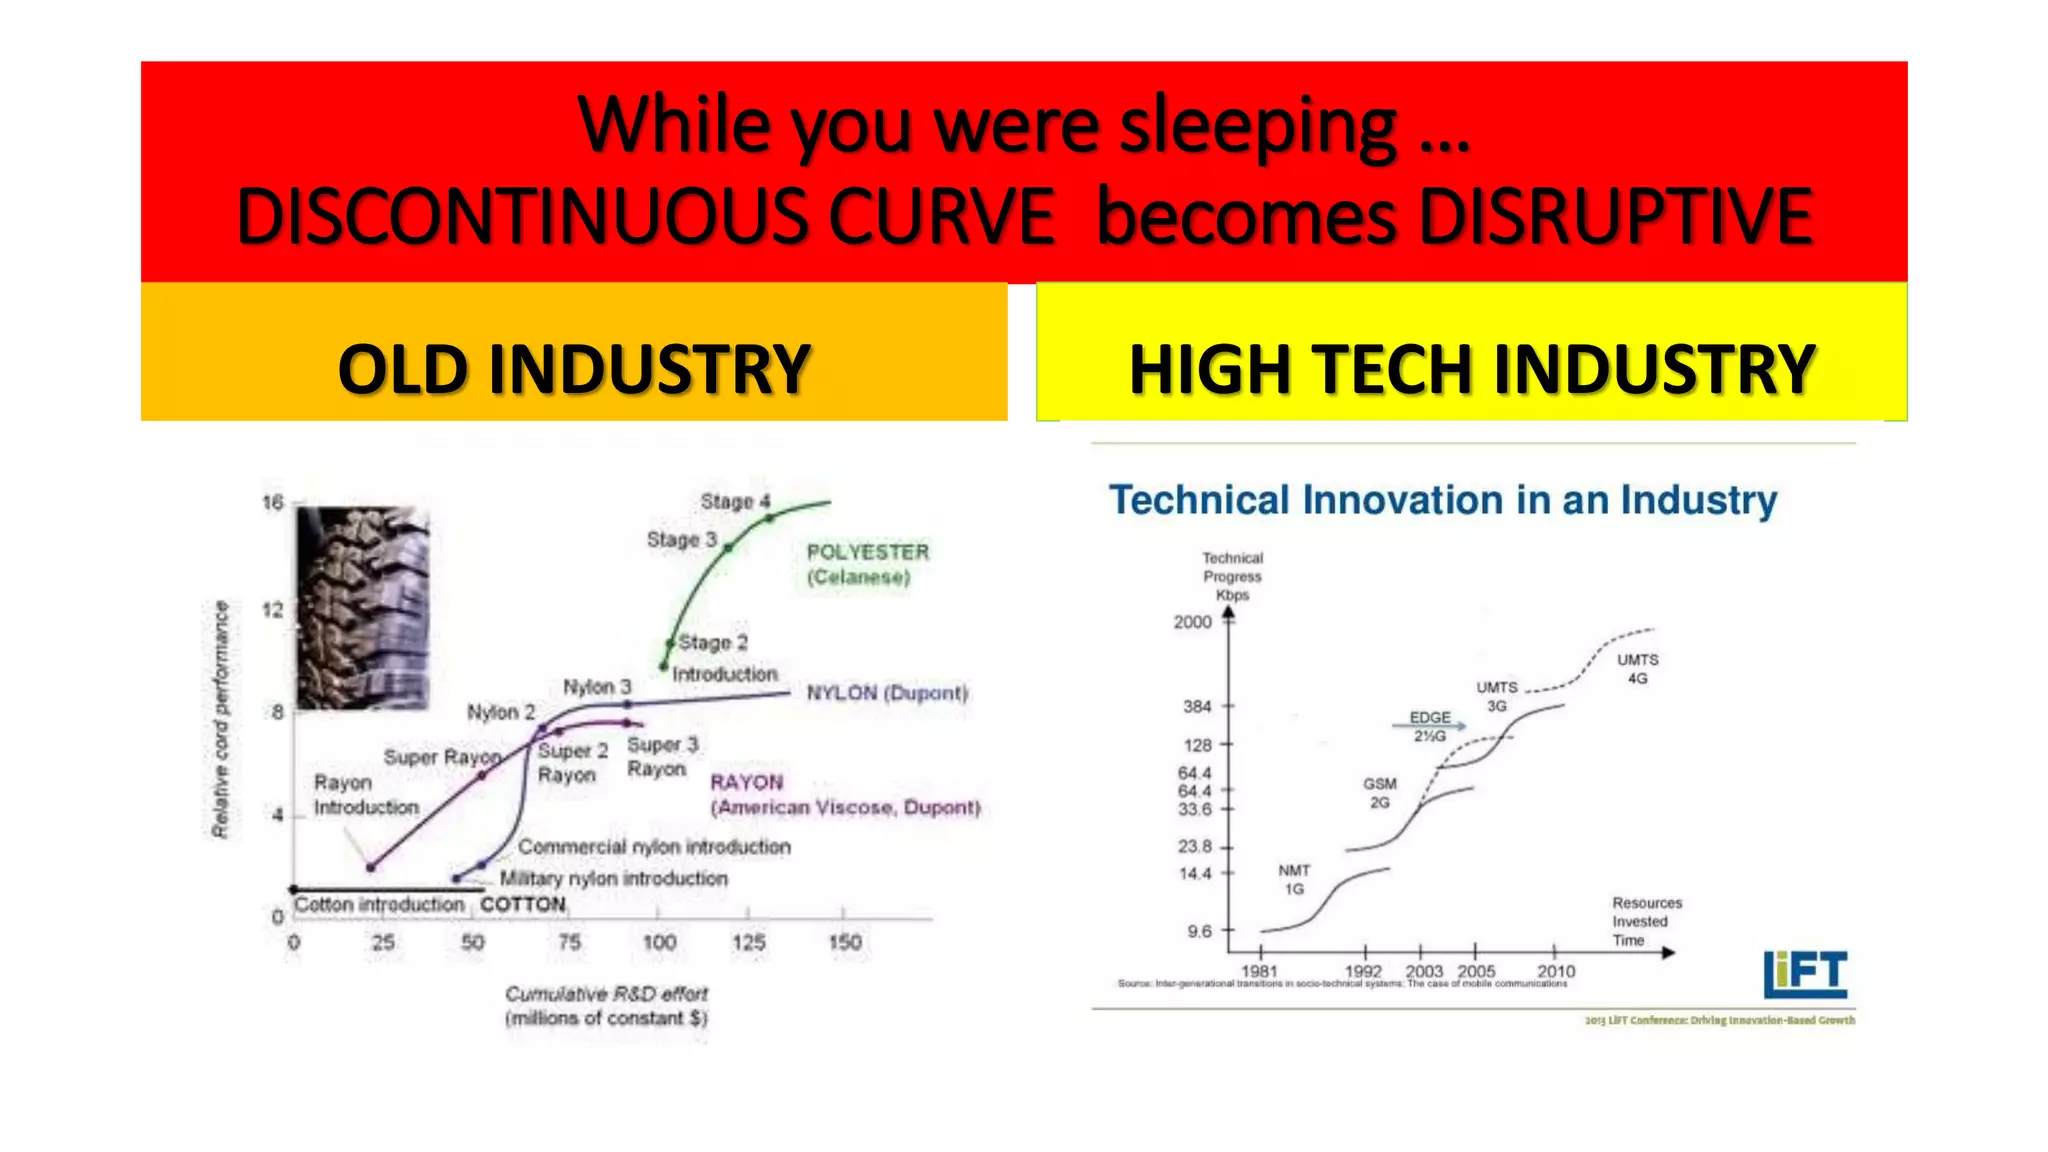
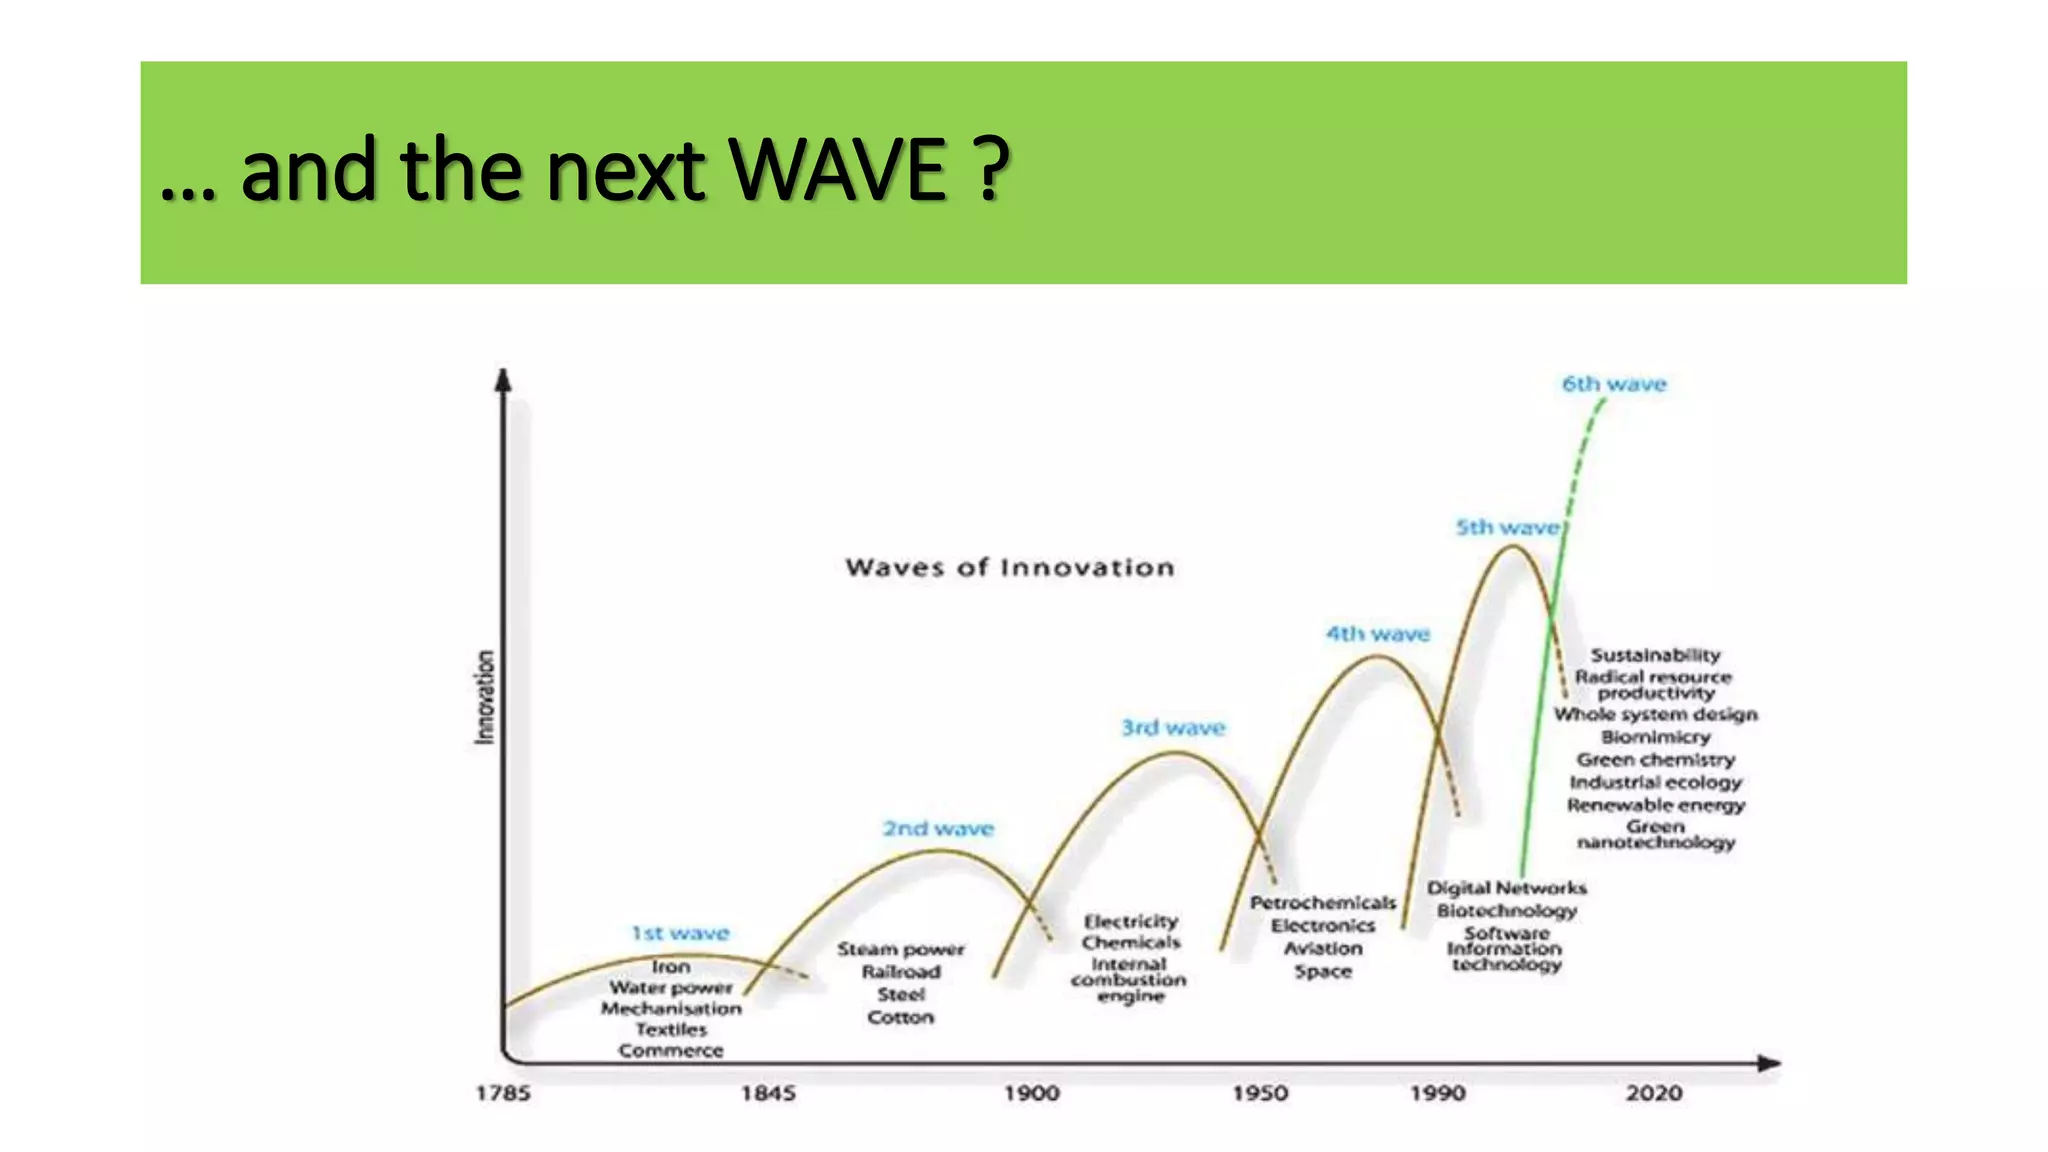
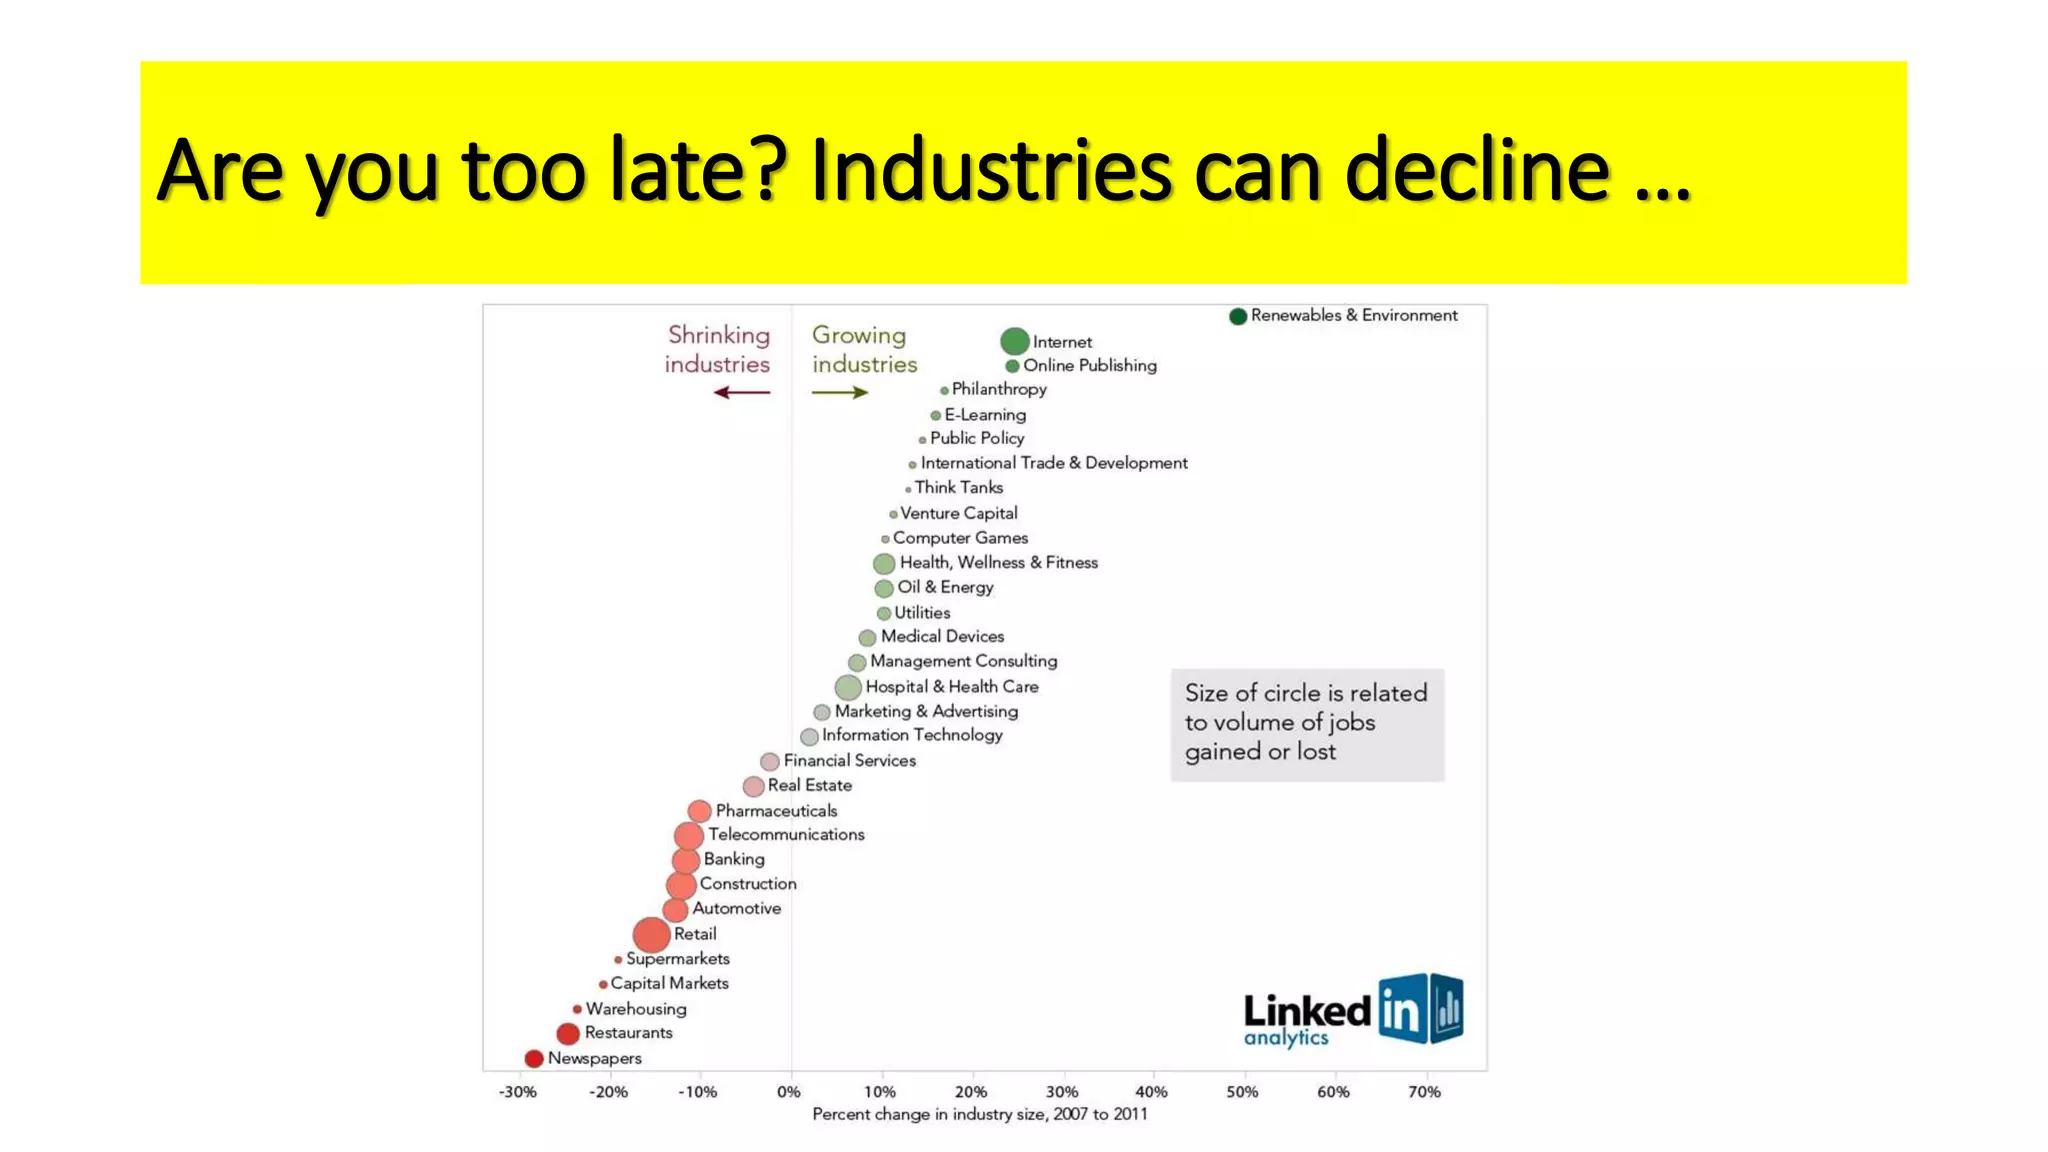
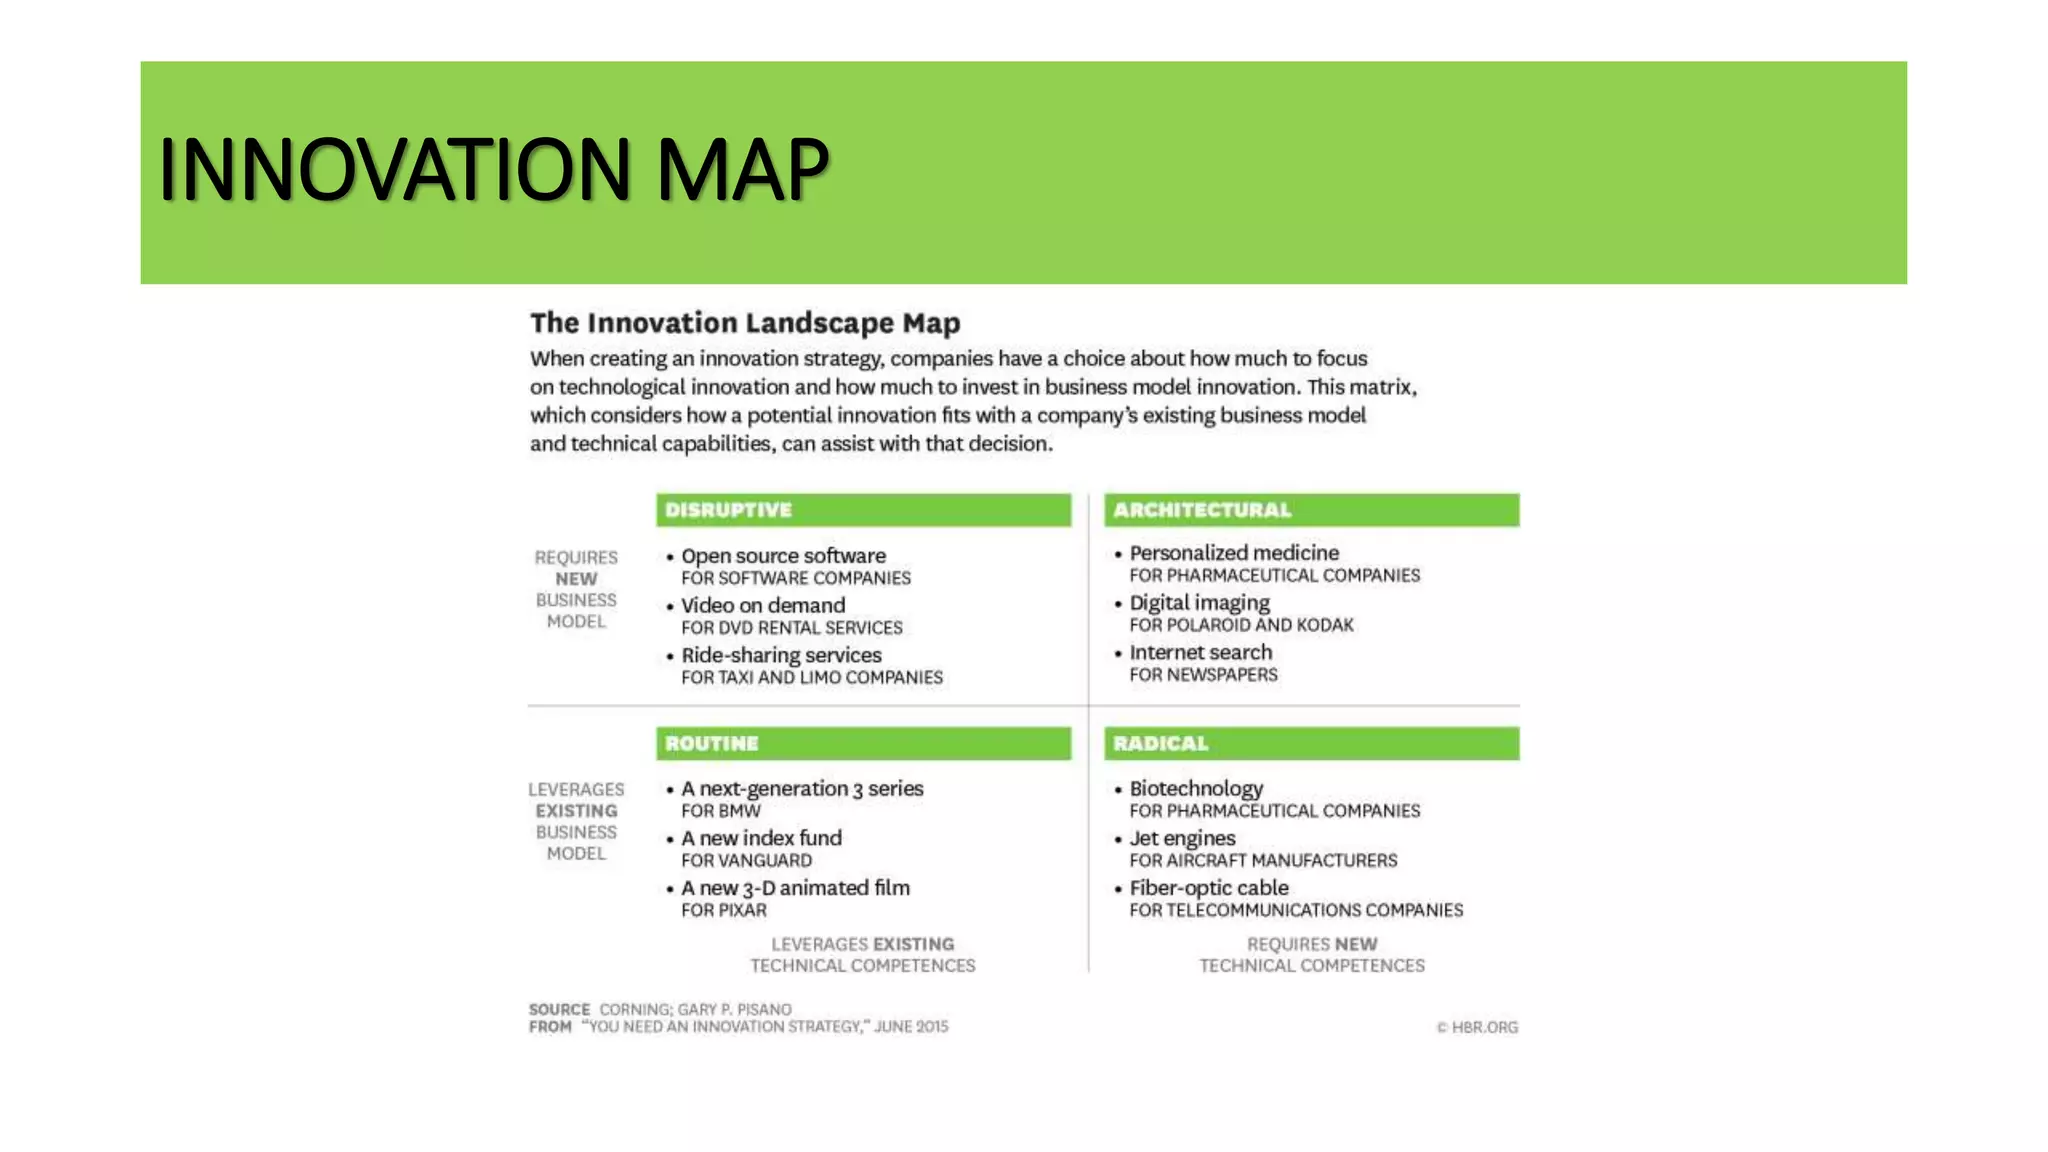
The document outlines the agenda and content for a workshop on technology analysis and commercialization. It introduces the Innovation SPACETM technology commercialization model, which involves 12 stages across 6 phases from concept to business maturity. The workshop will cover assessing the technical attributes of an innovation versus its value proposition, innovation mapping, and analyzing innovation projects based on attractiveness and effort required. It emphasizes that during the technology analysis stage, it is important to determine if a product is new, unique, technically feasible, and offers significant advantages over existing solutions by researching patents, literature, and speaking with experts.


