Downloaded 30 times


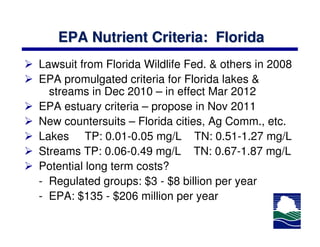

![Nutrient Criteria: Examples
Reservoir Chl a (µg/L) TP (mg/L) Transparency
Stand-alone Not adopted (meters)
Not adopted
Eagle Mtn 25.4 0.07 0.80
Cedar Creek 30.4 0.07 0.80
Livingston 23.0 0.16 0.67
Lewisville 18.5 0.06 0.60
[Houston – [12.4] 0.18 0.28
not adopted]
Travis 3.7 0.03 3.13](https://image.slidesharecdn.com/tceqhouston2-22-2011-110228170548-phpapp02/85/Water-Quality-Managements-Developments-Nutrients-and-Bacteria-6-320.jpg)


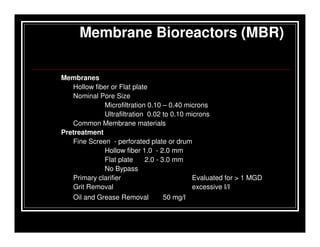
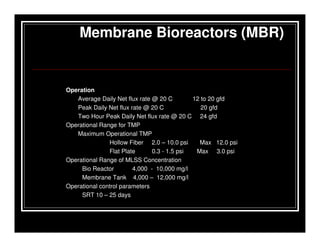


The document discusses membrane bioreactor (MBR) systems for wastewater treatment. It provides common ranges for key design parameters like membrane flux rates, mixed liquor suspended solids concentrations, and aeration requirements. The text indicates MBR systems require careful design to prevent fouling and ensure integrity. It also notes TCEQ may require a pilot study or 2-year performance bond for non-standard MBR proposals.
![[Guest Speaker] Yue Rong - GEOs Gas Thermal Remediation Workshop Series - Los...](https://cdn.slidesharecdn.com/ss_thumbnails/losangeles-wdryrpresentation2014nov-141120134923-conversion-gate01-thumbnail.jpg?width=640&height=640&fit=bounds)


