Download as PDF, PPTX
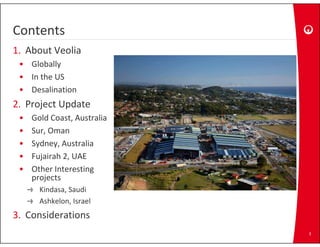
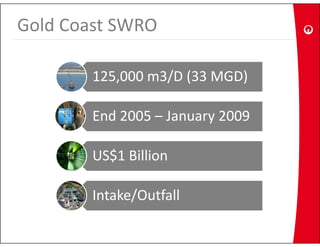
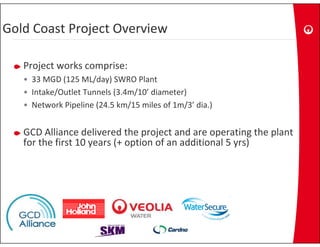

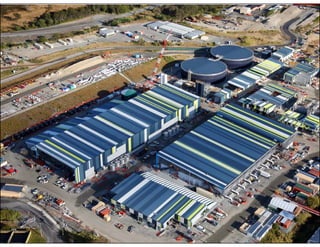
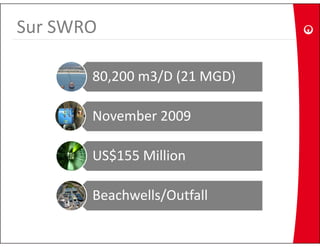
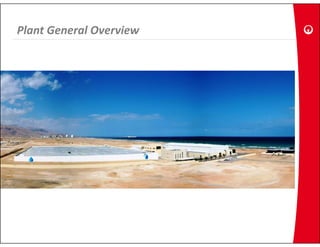
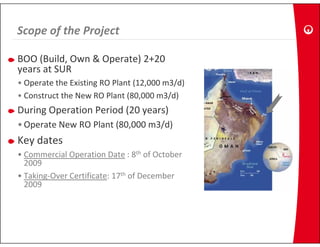

This document provides an update on large scale ocean desalination plants, including projects in Gold Coast, Australia, Sur Oman, and Sydney, Australia. It discusses Veolia's role in developing desalination technology and operating major desalination facilities globally. Project details are given for Gold Coast and Sur plants, including plant capacity and construction timelines. Environmental considerations and community involvement are also summarized.


![[Slidecast] Valuing Eco-System Services: Inside the Dow Chemicals/Nature Cons...](https://cdn.slidesharecdn.com/ss_thumbnails/judygundersonandmichellelapinski-111123205351-phpapp02-thumbnail.jpg?width=640&height=640&fit=bounds)


![5G Explained! A High Level Overview [Introduction]](https://cdn.slidesharecdn.com/ss_thumbnails/5gexplainedahighleveloverview-260119165306-cc137a3e-thumbnail.jpg?width=640&height=640&fit=bounds)


