Download as PDF, PPTX
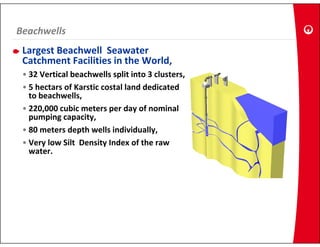

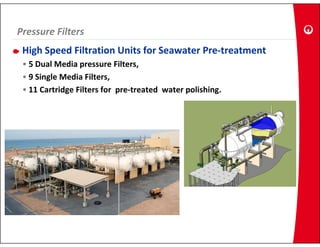
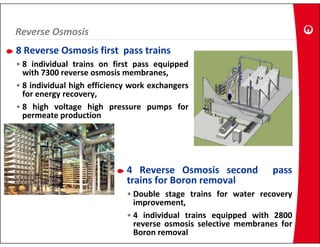
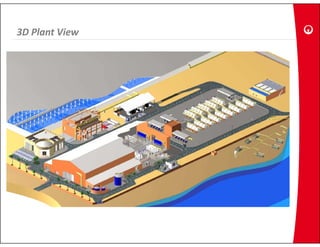
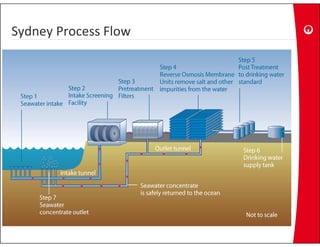
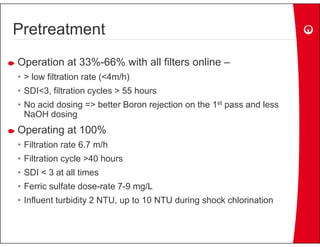
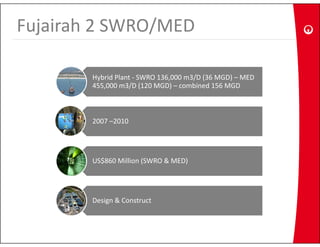

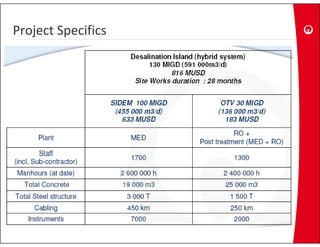
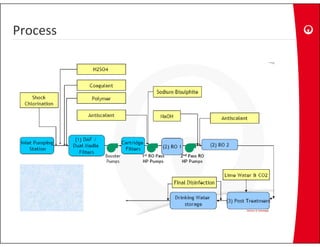
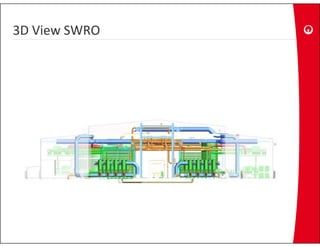
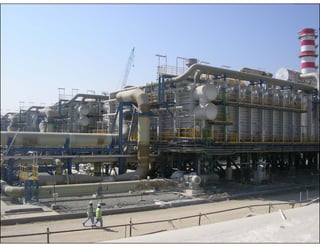
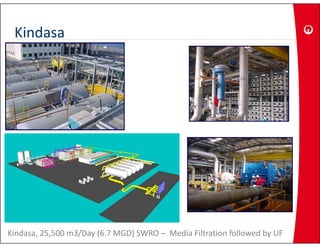
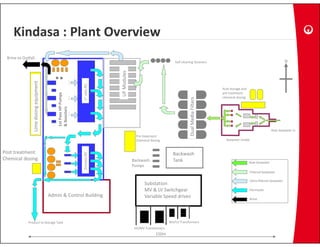
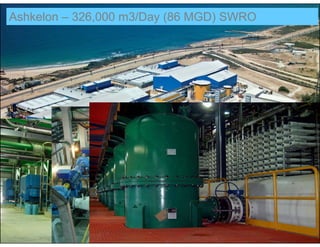
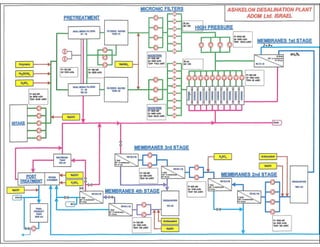
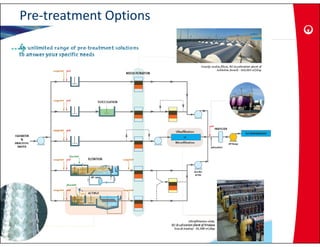

This document provides information on the largest beach well seawater catchment facilities and desalination plant in the world. It includes details such as 32 vertical beach wells split into 3 clusters that can pump 220,000 cubic meters per day. It also describes the pretreatment, reverse osmosis, and post-treatment processes including 5 dual media pressure filters, 8 reverse osmosis first pass trains equipped with 7300 membranes, and 4 reverse osmosis second pass trains for boron removal using 2800 selective membranes. Plant diagrams and a 3D view are also included.


