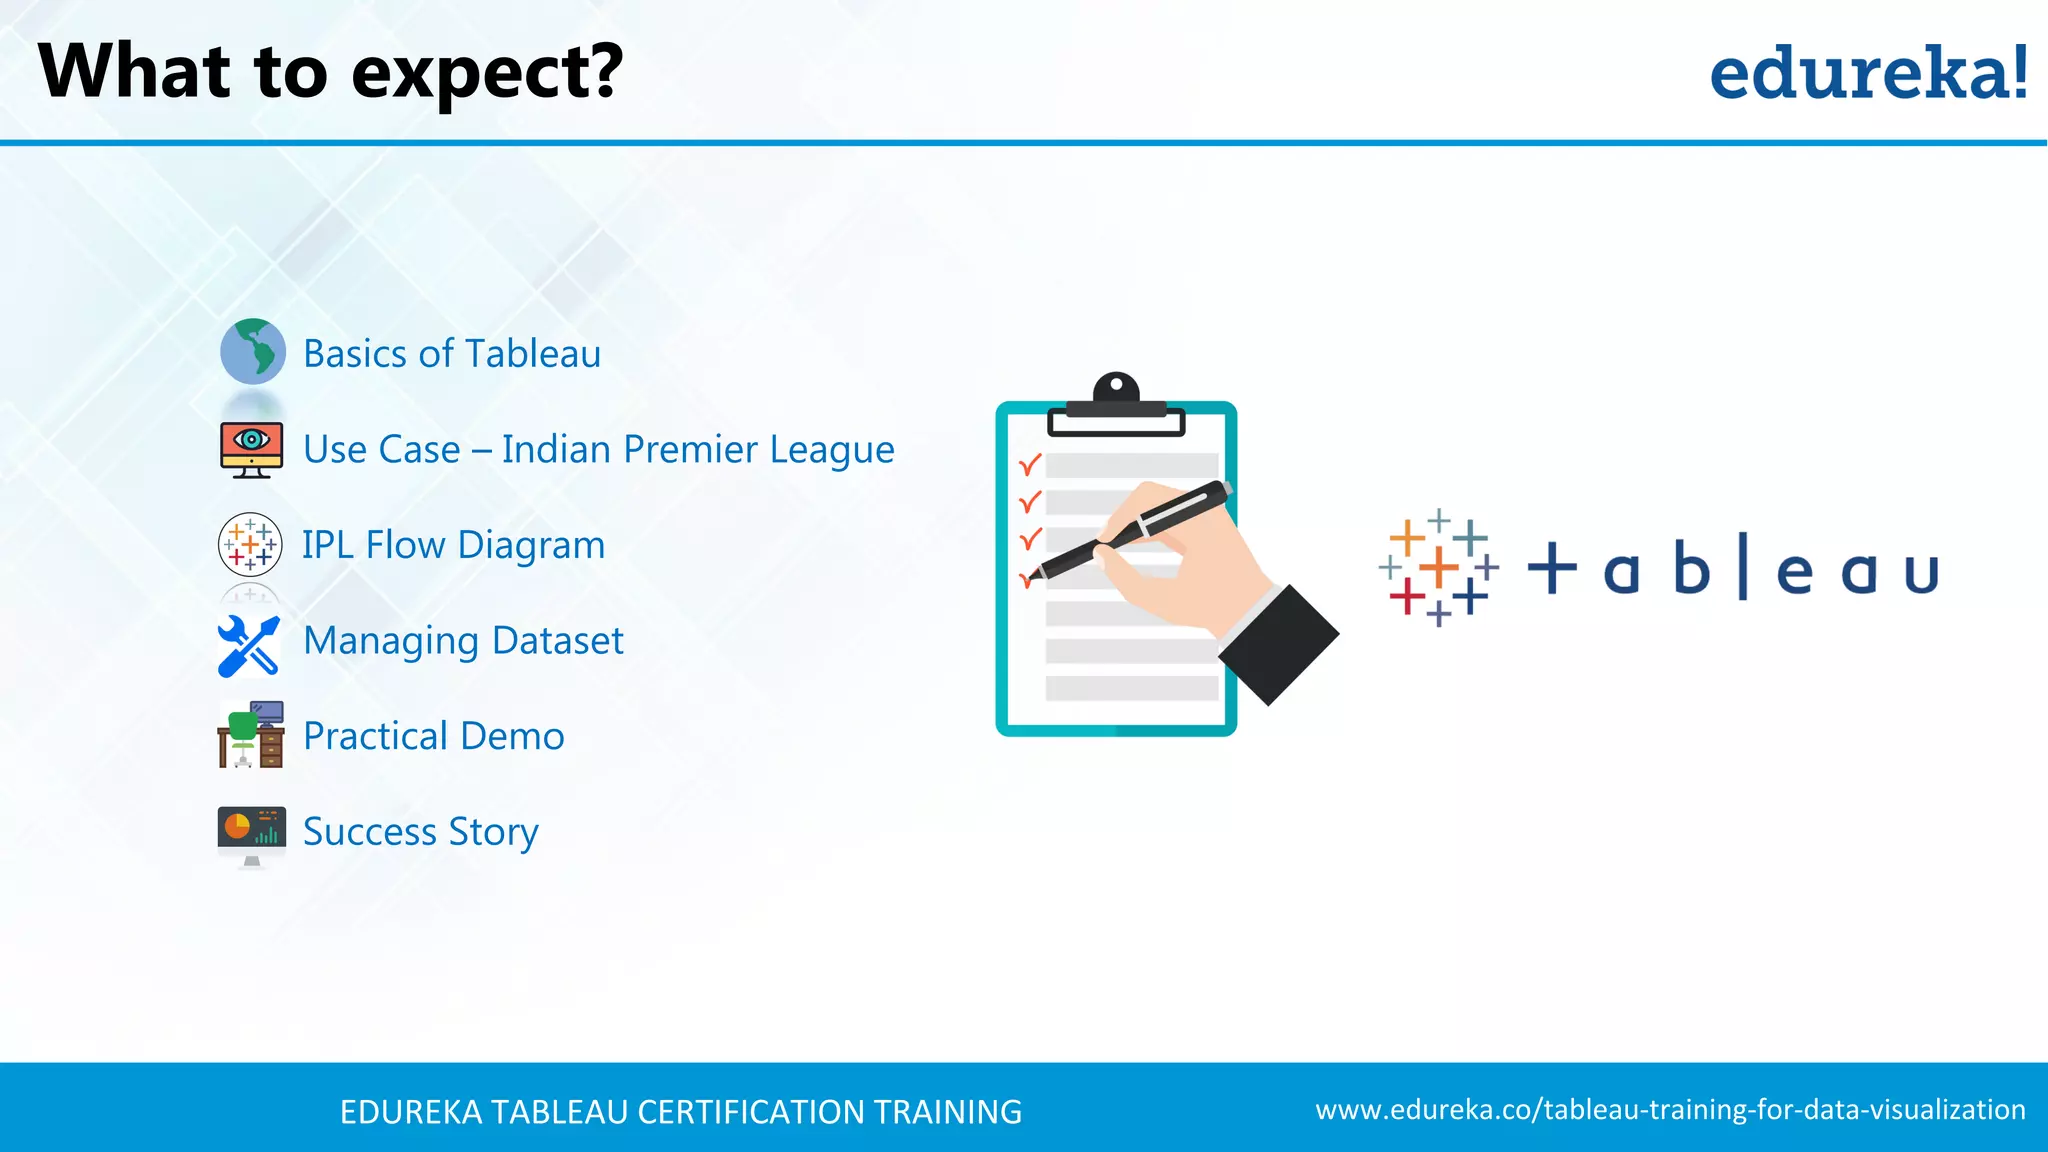
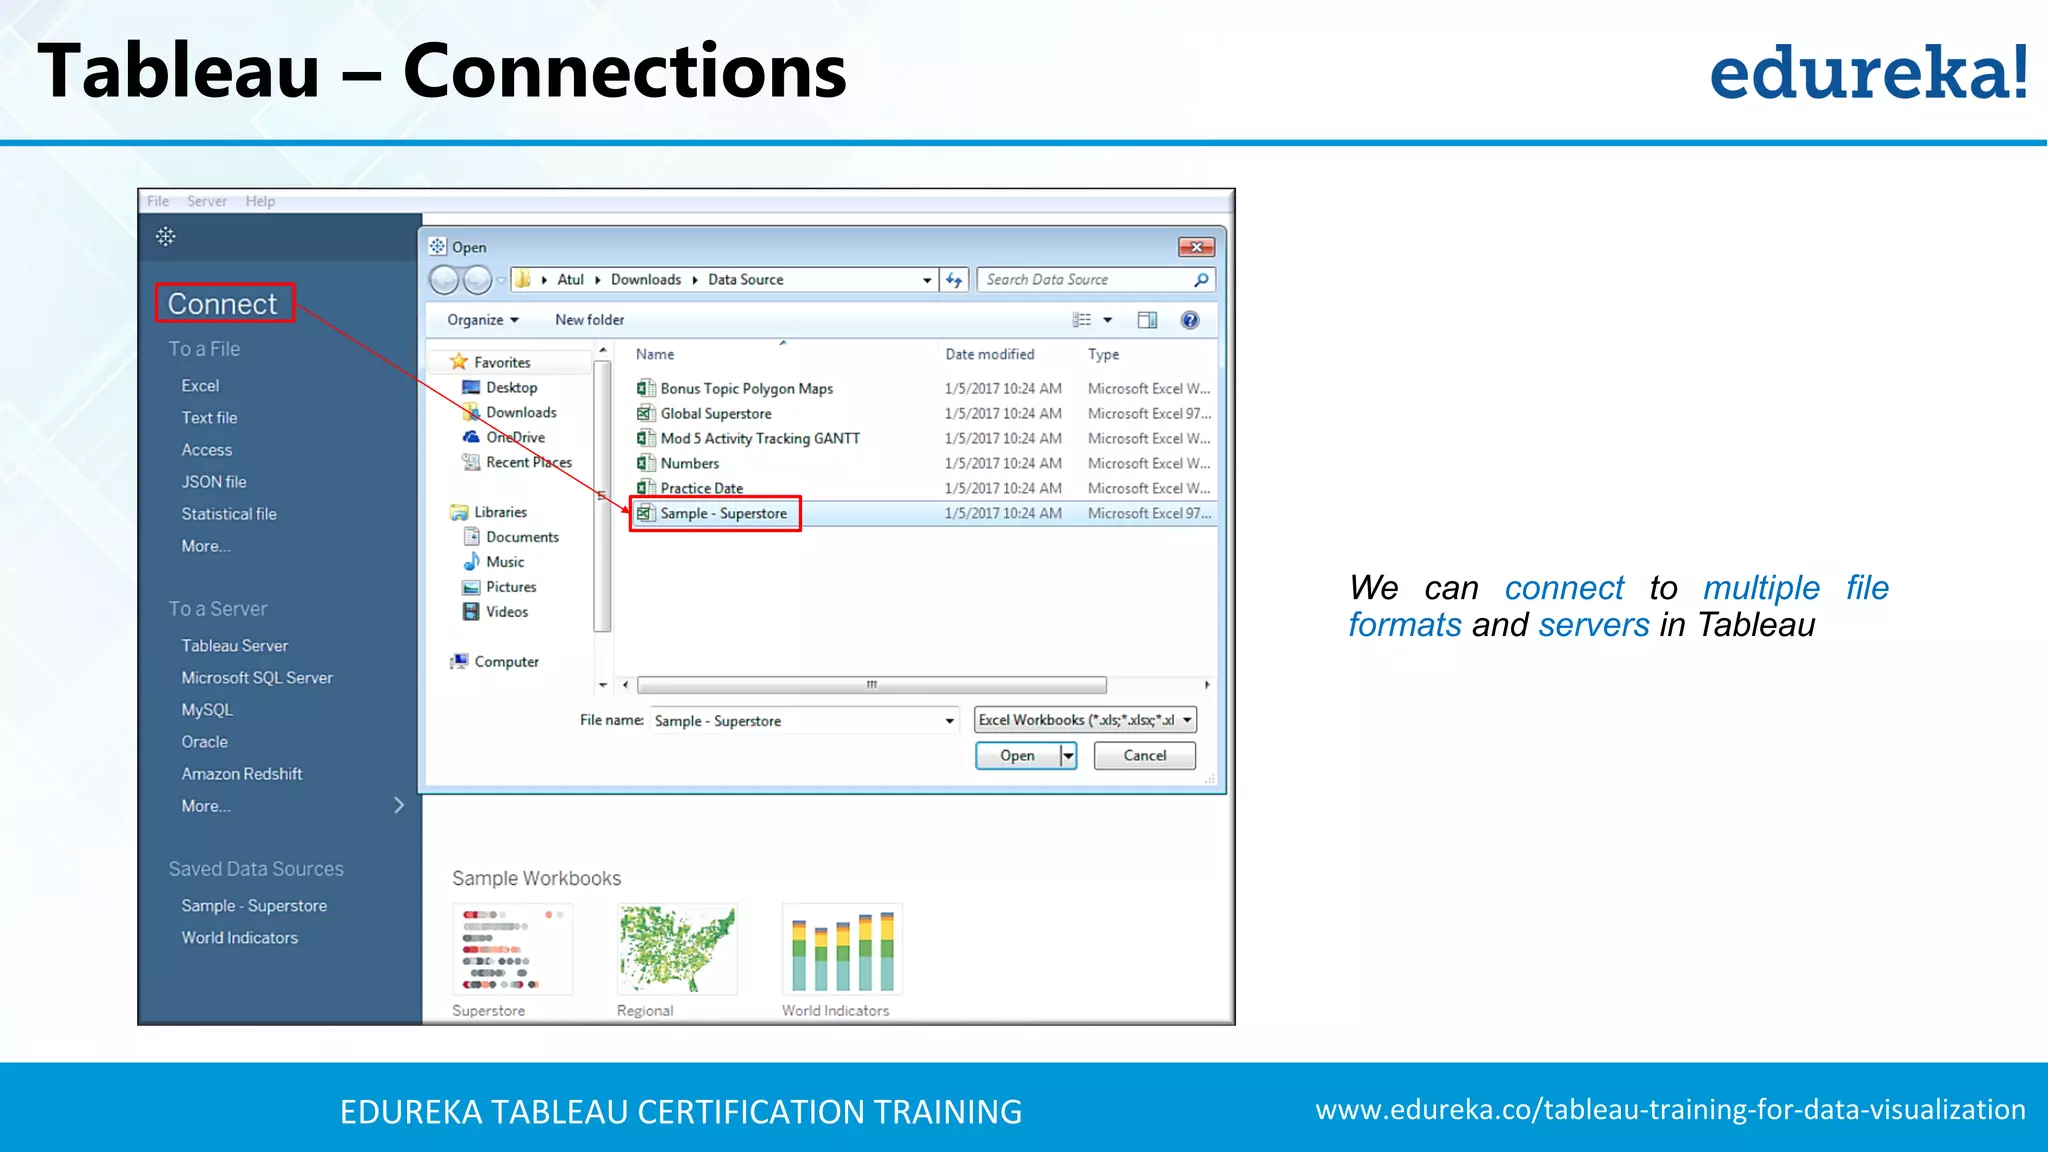
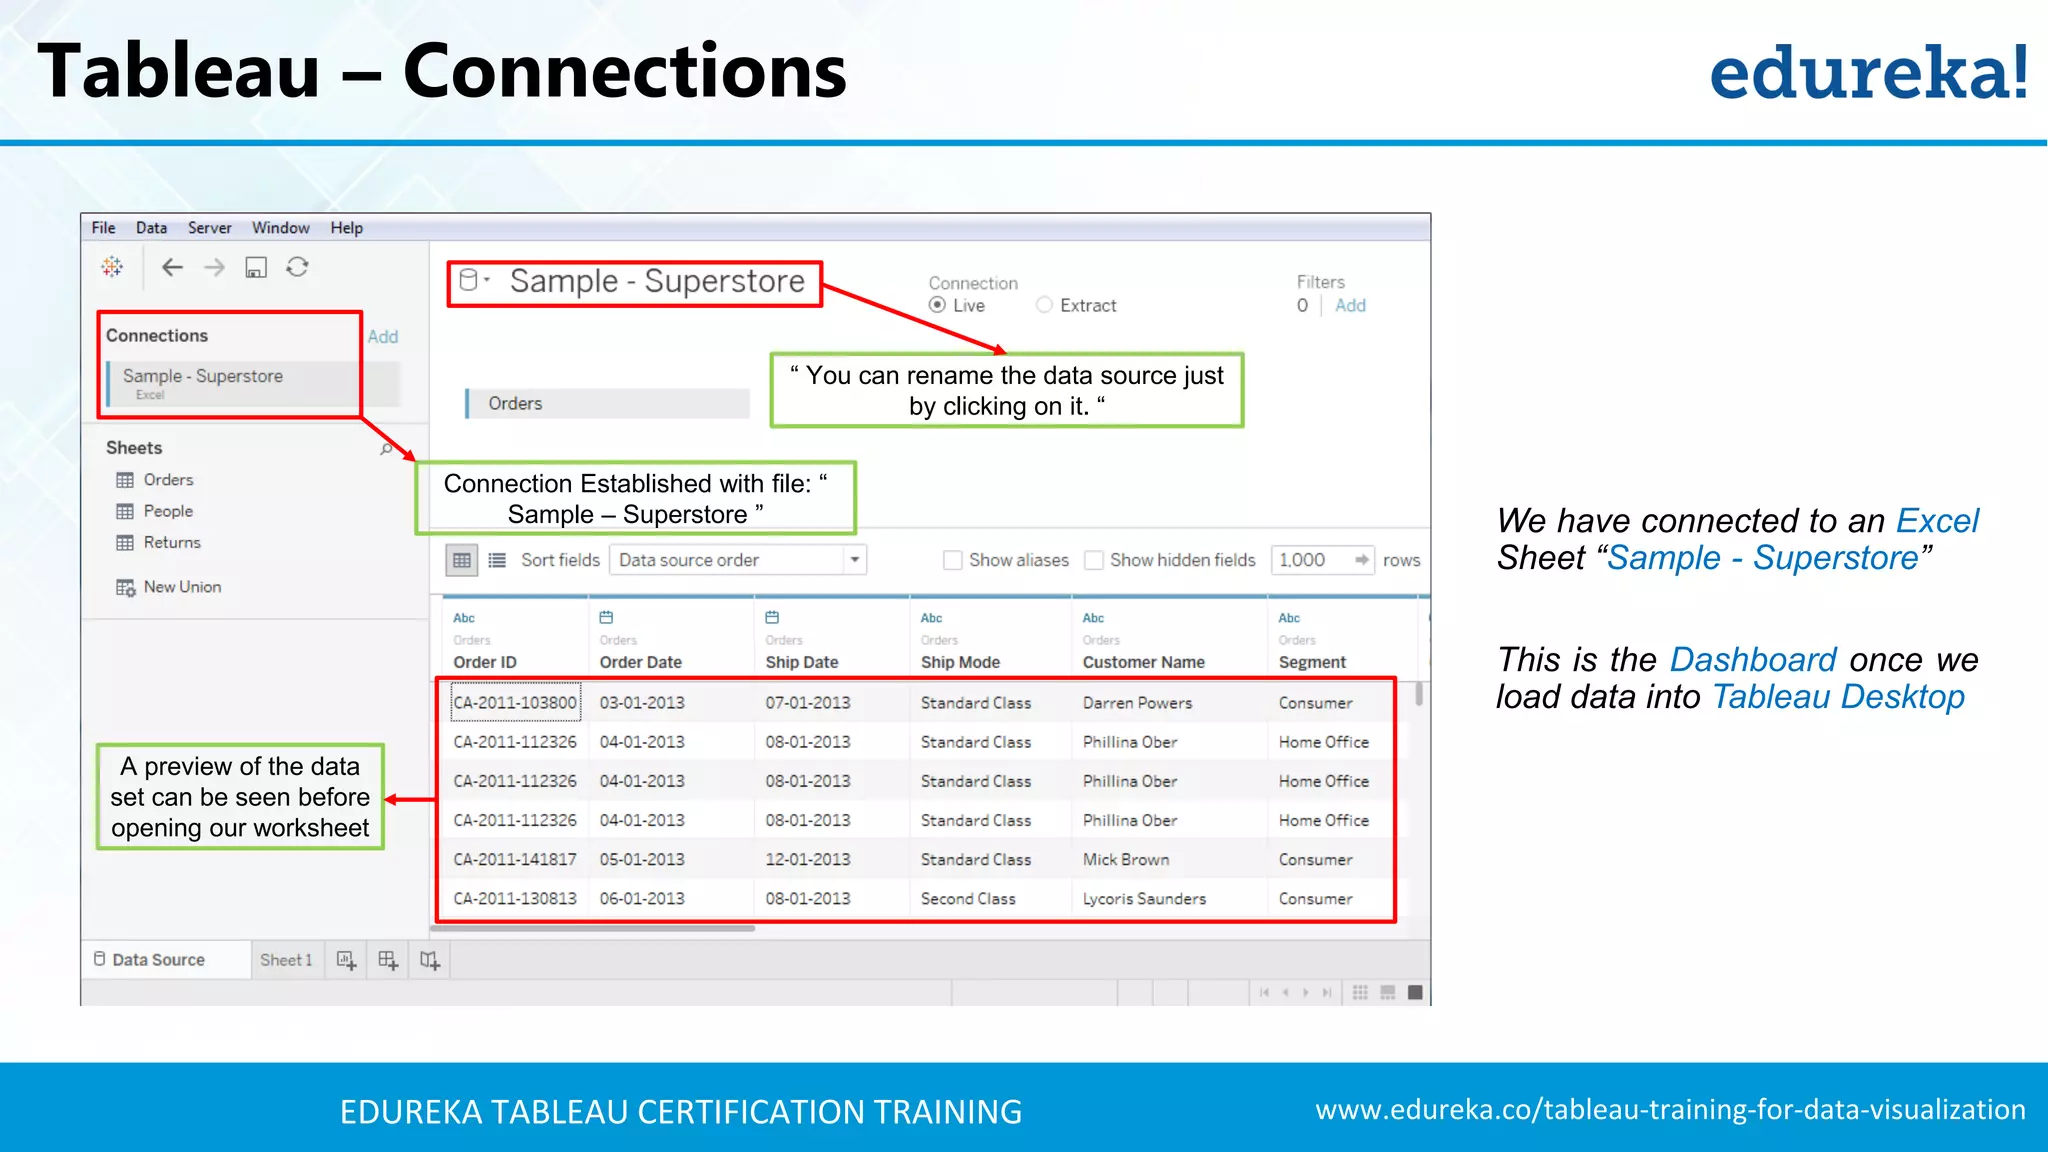
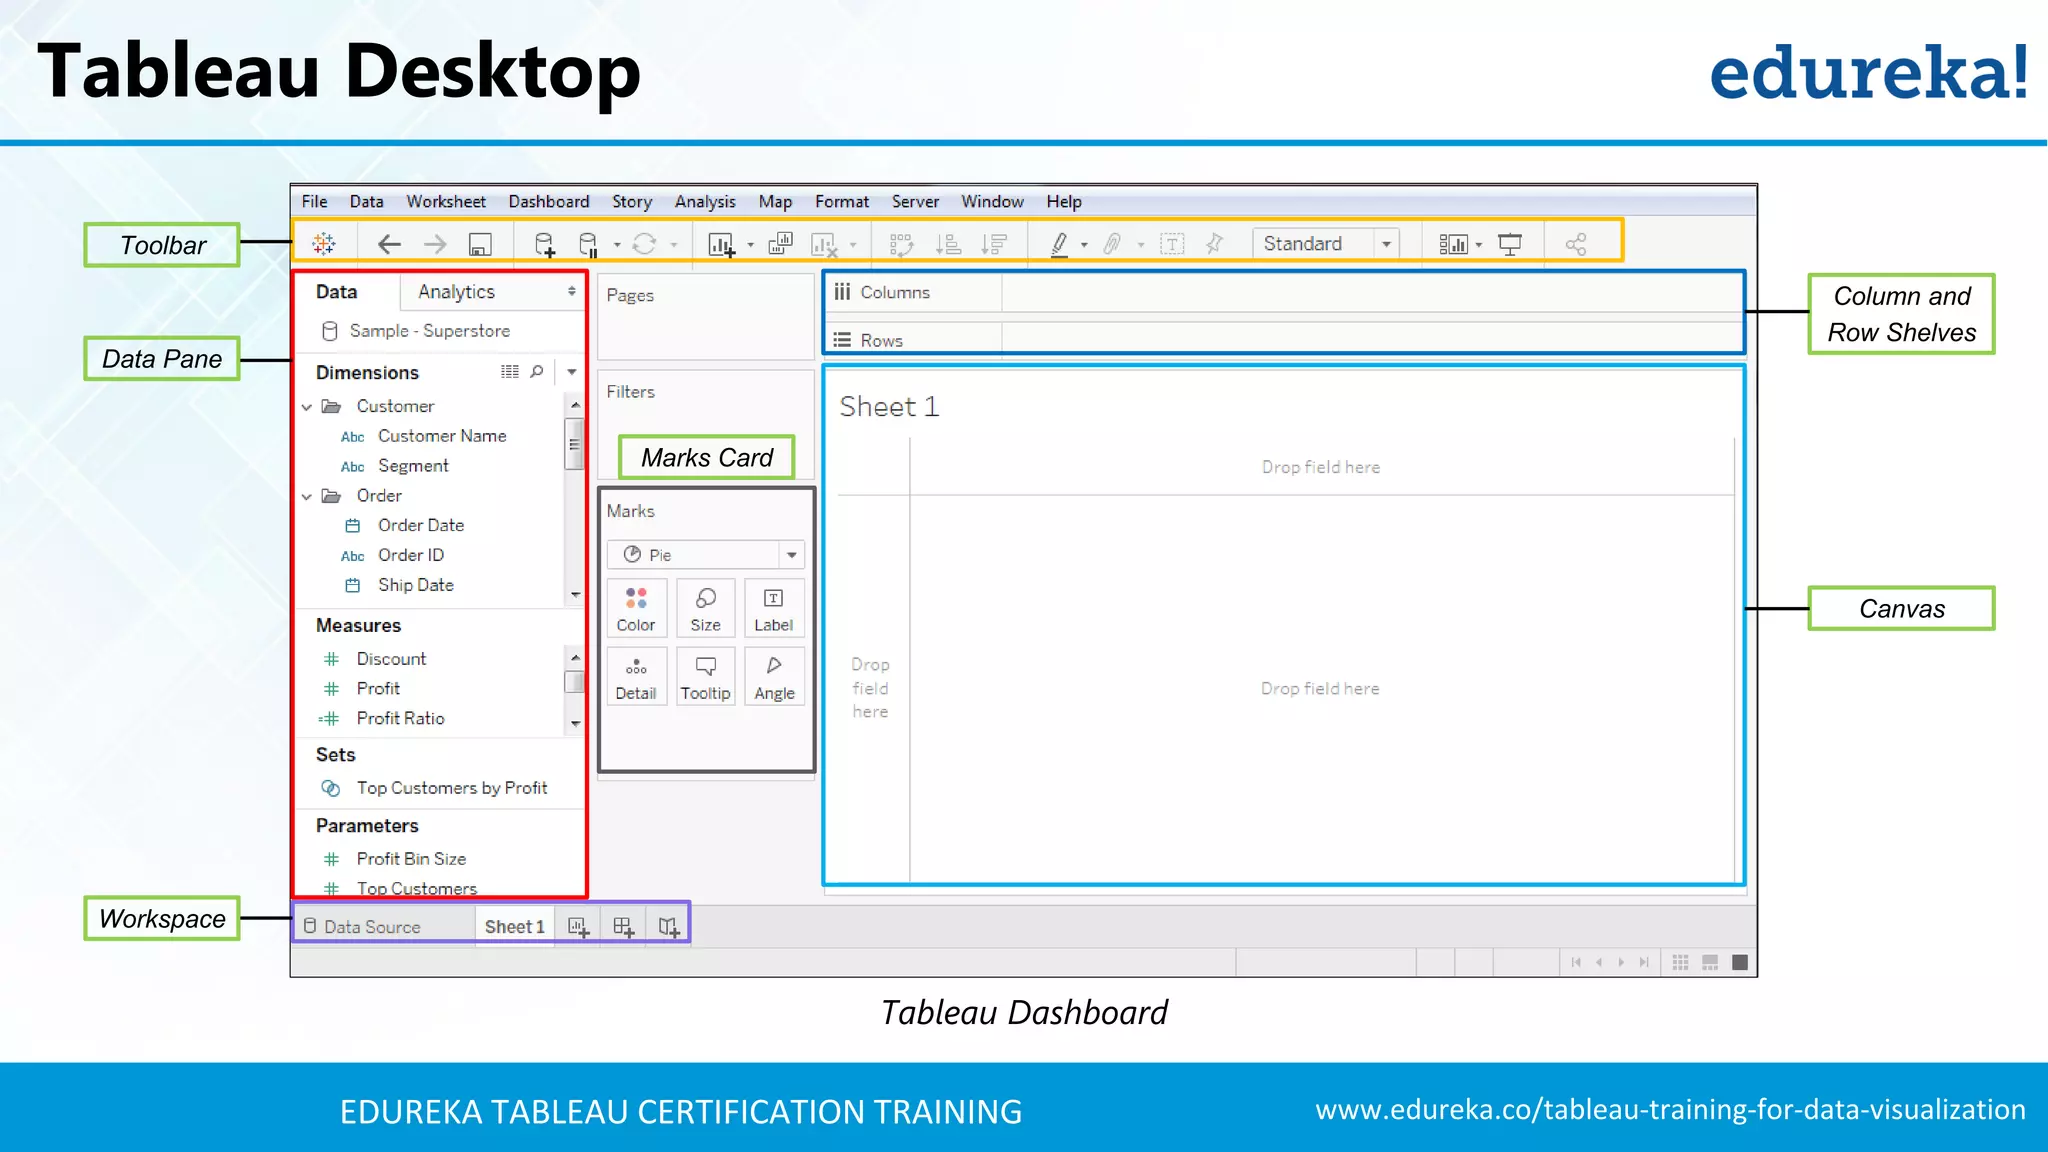
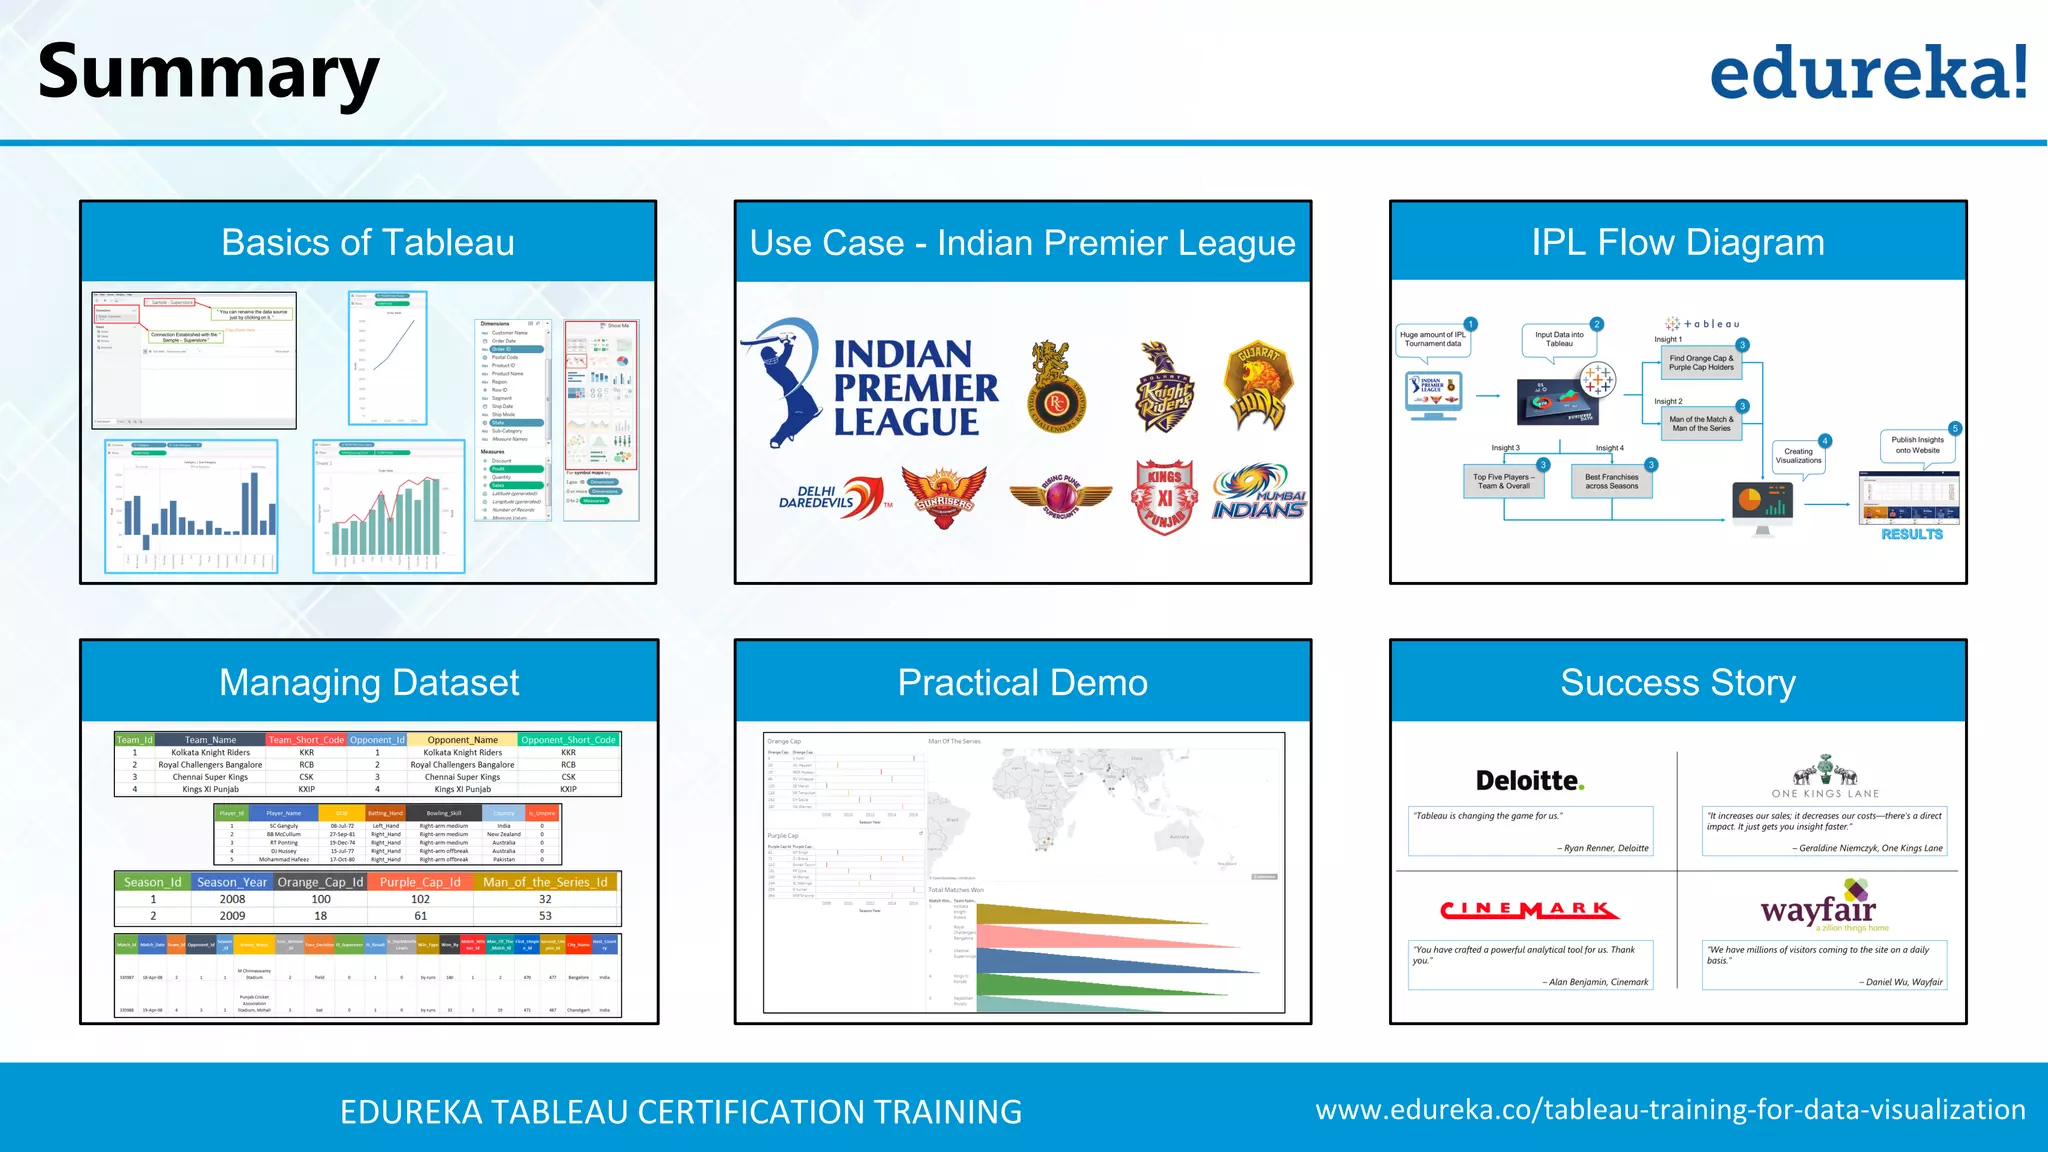
www.edureka.co/tableau-training-for-data-visualizationEDUREKA TABLEAU CERTIFICATION TRAINING
What to expect?
 Basics of Tableau
 Use Case – Indian Premier League
 IPL Flow Diagram
 Managing Dataset
 Practical Demo
 Success Story
www.edureka.co/tableau-training-for-data-visualizationEDUREKA TABLEAU CERTIFICATION TRAINING
Basics of Tableau
www.edureka.co/tableau-training-for-data-visualizationEDUREKA TABLEAU CERTIFICATION TRAINING
Tableau – Connections
We can connect to multiple file
formats and servers in Tableau
www.edureka.co/tableau-training-for-data-visualizationEDUREKA TABLEAU CERTIFICATION TRAINING
Tableau – Connections
“ You can rename the data source just
by clicking on it. “
Connection Established with file: “
Sample – Superstore ” We have connected to an Excel
Sheet “Sample - Superstore”
This is the Dashboard once we
load data into Tableau Desktop
A preview of the data
set can be seen before
opening our worksheet
www.edureka.co/tableau-training-for-data-visualizationEDUREKA TABLEAU CERTIFICATION TRAINING
Tableau Datatypes
True / False
Boolean
True / False
5
Number (Whole)
Whole Numbers
5.0000
Number (Decimal)
Decimal Numbers
Welcome to Tableau
Text / String
Text or String Values
December 31, 2016
Date
Date Values
December 31, 2016
01:00:00 AM
Date & Time
Date &
Timestamp Values
New York, France,
India, Beijing
Geographical
Values
Geographical Mapping
Icon Data type
Text (string) values
Date values
Date & Time values
Numerical values
Boolean values
Geographic values
www.edureka.co/tableau-training-for-data-visualizationEDUREKA TABLEAU CERTIFICATION TRAINING
Tableau Desktop
Tableau Dashboard
Data Pane
Marks Card
Toolbar
Canvas
Column and
Row Shelves
Workspace
www.edureka.co/tableau-training-for-data-visualizationEDUREKA TABLEAU CERTIFICATION TRAINING
Tableau – Dimensions & Measures
Once we connect to a data source in
Tableau, the columns get divided into
Dimensions and Measures.
A Dimension is a field that is an
independent variable.
A Measure is a field that is a Dependent
Variable and its value is a function of one
or more Dimensions.
www.edureka.co/tableau-training-for-data-visualizationEDUREKA TABLEAU CERTIFICATION TRAINING
Tableau UI – Show Me
Show Me in Tableau shows all the possible
visualizations available for our data source.
The visualizations that are highlighted are
the ones that are currently available for the
current selection of dimensions and
measures.
www.edureka.co/tableau-training-for-data-visualizationEDUREKA TABLEAU CERTIFICATION TRAINING
Use Case
Indian Premier League
www.edureka.co/tableau-training-for-data-visualizationEDUREKA TABLEAU CERTIFICATION TRAINING
Indian Premier League
www.edureka.co/tableau-training-for-data-visualizationEDUREKA TABLEAU CERTIFICATION TRAINING
Use Case – Flow Diagram
www.edureka.co/tableau-training-for-data-visualizationEDUREKA TABLEAU CERTIFICATION TRAINING
Use Case – Flow Diagram
Huge amount of IPL
Tournament data
1
Input Data into
Tableau
2
Creating
Visualizations
4 Publish Insights
onto Website
5
Man of the Match &
Man of the Series
Find Orange Cap &
Purple Cap Holders
Insight 1
Insight 2
3
3
Best Franchises
across Seasons
Top Five Players –
Team & Overall
Insight 3 Insight 4
33
www.edureka.co/tableau-training-for-data-visualizationEDUREKA TABLEAU CERTIFICATION TRAINING
Use Case – Flow Diagram
5
www.edureka.co/tableau-training-for-data-visualizationEDUREKA TABLEAU CERTIFICATION TRAINING
Let us have a look
at our Dataset
www.edureka.co/tableau-training-for-data-visualizationEDUREKA TABLEAU CERTIFICATION TRAINING
Dataset
Team Table – IPL (Indian Premier League) Dataset
www.edureka.co/tableau-training-for-data-visualizationEDUREKA TABLEAU CERTIFICATION TRAINING
Dataset
Player Table – IPL (Indian Premier League) Dataset
www.edureka.co/tableau-training-for-data-visualizationEDUREKA TABLEAU CERTIFICATION TRAINING
Dataset
Match Table – IPL (Indian Premier League) Dataset
www.edureka.co/tableau-training-for-data-visualizationEDUREKA TABLEAU CERTIFICATION TRAINING
Dataset
Player Match Table – IPL (Indian Premier League) Dataset
www.edureka.co/tableau-training-for-data-visualizationEDUREKA TABLEAU CERTIFICATION TRAINING
Dataset
Season Table – IPL (Indian Premier League) Dataset
www.edureka.co/tableau-training-for-data-visualizationEDUREKA TABLEAU CERTIFICATION TRAINING
Practical Demo
www.edureka.co/tableau-training-for-data-visualizationEDUREKA TABLEAU CERTIFICATION TRAINING
Tableau Success
www.edureka.co/tableau-training-for-data-visualizationEDUREKA TABLEAU CERTIFICATION TRAINING
Companies using Tableau
50,000+
Customers
Shubham
www.edureka.co/tableau-training-for-data-visualizationEDUREKA TABLEAU CERTIFICATION TRAINING
Tableau – Success Stories
“Tableau is changing the game for us. It's reduced the time
that they have to spend on lower-value-add activities.”
– Ryan Renner, Deloitte
“It increases our sales; it decreases our costs. There's a direct
impact. It just gets you insight faster.”
– Geraldine Niemczyk, One Kings Lane
“You have crafted a powerful analytical tool for us. Thank
you.”
– Alan Benjamin, Cinemark
“The impact was dramatic. That’s why we feel good about
completely redoing the way we do analytics. This is going to
help EOS and analytics to the next level.”
– Maile Hadley, Equal Opportunity Schools
www.edureka.co/tableau-training-for-data-visualizationEDUREKA TABLEAU CERTIFICATION TRAINING
Summary
www.edureka.co/tableau-training-for-data-visualizationEDUREKA TABLEAU CERTIFICATION TRAINING
Summary
Basics of Tableau
Practical DemoManaging Dataset
Use Case - Indian Premier League IPL Flow Diagram
Success Story
www.edureka.co/tableau-training-for-data-visualizationEDUREKA TABLEAU CERTIFICATION TRAINING
Thank You …
Questions/Queries/Feedback

Tableau Dashboard Tutorial | Tableau Training For Beginners | Tableau Tutorial | Edureka