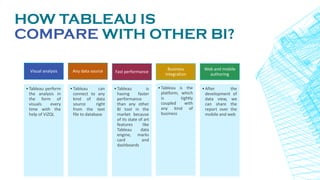
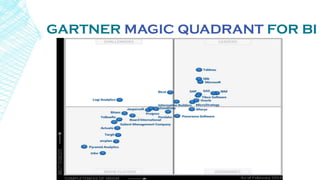
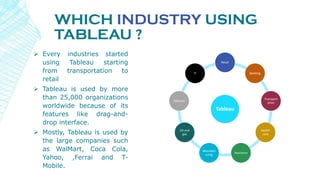
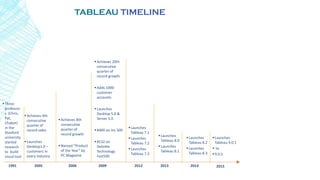
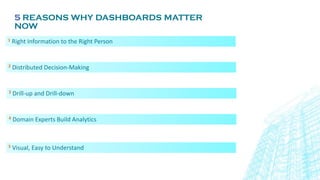
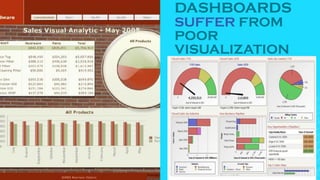
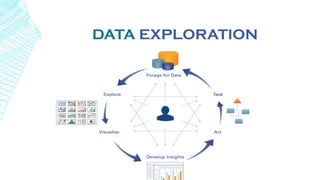
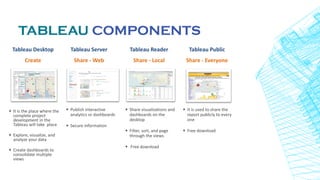
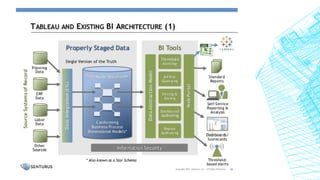
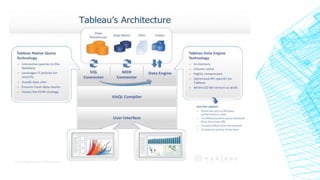
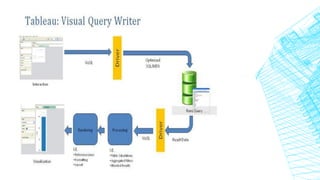
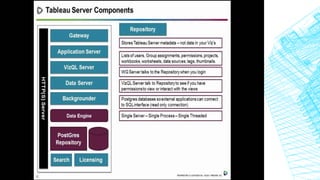
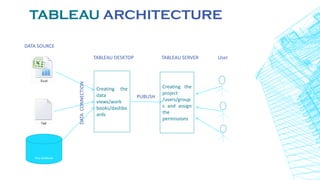
INTRODUCTION
Knowledgebee Trainings
DATA VISUALIZATION
• What is Tableau?
• Advantage of Tableau
• How Tableau is compare with other BI?
• Which Industry using Tableau?
• Tableau timeline
• 3 requirements for today’s dashboards
• Tableau components
• Tableau architecture
• How to work with Tableau?
 Data visualization is the presentation of data in a pictorial or
graphical format.
 A visual can communicate more information than a table in a much
smaller space.
 Businesses around the globe realize that the ability to visualize data
effectively leads directly to better understanding, insight and better
business decisions.
 Spreadsheets are hard to Understand
 Data visualization makes interpretation easier
DATA VISUALIZATION
WHAT IS TABLEAU?
 Tableau is the business intelligence software
 Any user can connect to the Tableau and
perform the analysis and reporting very
efficiently and accurately
 Tableau is easy to use as MS-excel, so that
any user can learn it without any
prerequisites and it is very powerful to solve
the most complex analytical problems
 Tableau is having its own patent query
language called as “ViZQL” (visualization
query language)
 ViZQL=SQL+ Visualization
ADVANTAGES OF TABLEAU
Beyond
Reporting
Step 3
See the
Answer
Step 2
User
Interface
Step 1Plug and play
Beyond
reporting
User Interface
See the
answer
HOW TABLEAU IS
COMPARE WITH OTHER BI?
Visual analysis
•Tableau perform
the analysis in
the form of
visuals every
time with the
help of ViZQL
Any data source
•Tableau can
connect to any
kind of data
source right
from the text
file to database
Fast performance
•Tableau is
having faster
performance
than any other
BI tool in the
market because
of its state of art
features like
Tableau data
engine, marks
card and
dashboards
Business
integration
•Tableau is the
platform, which
is tightly
coupled with
any kind of
business
Web and mobile
authoring
•After the
development of
data view, we
can share the
report over the
mobile and web
GARTNER MAGIC QUADRANT FOR BI
WHICH INDUSTRY USING
TABLEAU ?
 Every industries started
using Tableau starting
from transportation to
retail
 Tableau is used by more
than 25,000 organizations
worldwide because of its
features like drag-and-
drop interface.
 Mostly, Tableau is used by
the large companies such
as WalMart, Coca Cola,
Yahoo, ,Ferrai and T-
Mobile.
Tableau
Retail
Banking
Transport
ation
Health
care
Insurance
Manufact
uring
Oil and
gas
Telecom
IT
TABLEAU TIMELINE
2005 2006
Achieves 8th
consecutive
quarter of
record growth
Named “Product
of the Year” by
PC Magazine
Achieves 20th
consecutive
quarter of
record growth
Adds 1000
customer
accounts
Launches
Desktop 5.0 &
Server 5.0
#400 on Inc 500
#132 on
Deloitte
Technology
Fast500
20091991
Three
professor
s (Chris,
Pat,
Chabot)
in the
Stanford
university
started
research
to build
visual tool
Achieves 4th
consecutive
quarter of
record sales
Launches
Desktop1.0 –
customers in
every industry
2012
Launches
Tableau 8.0
Launches
Tableau 8.1
2013
Launches
Tableau 8.2
Launches
Tableau 8.3
Launches
Tableau 7.1
Launches
Tableau 7.2
Launches
Tableau 7.3
2014
Launches
Tableau 9.0.1
 to
9.0.5
2015
5 REASONS WHY DASHBOARDS MATTER
NOW
1 Right Information to the Right Person
2 Distributed Decision-Making
3 Drill-up and Drill-down
4 Domain Experts Build Analytics
5 Visual, Easy to Understand
DASHBOARDS
SUFFER FROM
POOR
VISUALIZATION
EVERYDAY
BUSINESS
INTELLIGENCE
DATA EXPLORATION
INTELLIGENT VISUALIZATION
ANALYTICS EVERYWHERE
TABLEAU COMPONENTS
Tableau Desktop
Create
Tableau Server
Share - Web
Tableau Reader
Share - Local
+ Publish interactive
analytics or dashboards
+ Secure information
+ Share visualizations and
dashboards on the
desktop
+ Filter, sort, and page
through the views
+ Free download
+ It is the place where the
complete project
development in the
Tableau will take place
+ Explore, visualize, and
analyze your data
+ Create dashboards to
consolidate multiple
views
Tableau Public
Share - Everyone
+ It is used to share the
report publicly to every
one
+ Free download
TABLEAU ARCHITECTURE
DATA SOURCE
TABLEAU DESKTOP TABLEAU SERVER User
Any database
Creating the
data
views/work
books/dashbo
ards
DATACONNECTION
PUBLISH
Creating the
project
/users/group
s and assign
the
permissions
HOW TO WORK WITH TABLEAU
1
•Connect to the data source
2
•Drag and drop the required dimensions
and KPI’s in to rows and columns
3
•Select the required chart in the “Show
me”
4
•Click on Abc
5
•Publish the data views or work book in to
the Tableau Server
TABLEAU DESKTOP START PAGE
TABLEAU FILE TYPES
Tableau Workbook (.twb)
Tableau's default way to save work
This includes Information to visualize the data
No source data saved with this file
Tableau Packaged Workbook (.twbx)
This file includes extracted data and workbook information to build visualizations
This file can be shared with others without access to source data
Tableau Data Source (.tds)
This file saves the server address, password, and other metadata related to data source
It will used to access frequently used data sources
Tableau Data Extract (.tde)
Get the data into tableau in memory data engine
This file includes the source data as filtered and aggregated.
It improves the performance and enables more functions
Tableau Bookmark (.tbm)
Sharing worksheets from one workbook to others
This file contains information to visualize and data source if the workbook is packaged workbook
TABLEAU DATA TYPES
Text values
Date values
Date and time values
Numerical values
Geographic values (latitude and longitude used for maps)
Boolean values (true/false conditions)
THANK YOU
Contact : Knowledgebee@beenovo.com

Data Visualization with Tableau - by Knowledgebee Trainings

  • 1.
  • 2.
    DATA VISUALIZATION • Whatis Tableau? • Advantage of Tableau • How Tableau is compare with other BI? • Which Industry using Tableau? • Tableau timeline • 3 requirements for today’s dashboards • Tableau components • Tableau architecture • How to work with Tableau?
  • 3.
     Data visualizationis the presentation of data in a pictorial or graphical format.  A visual can communicate more information than a table in a much smaller space.  Businesses around the globe realize that the ability to visualize data effectively leads directly to better understanding, insight and better business decisions.  Spreadsheets are hard to Understand  Data visualization makes interpretation easier DATA VISUALIZATION
  • 4.
    WHAT IS TABLEAU? Tableau is the business intelligence software  Any user can connect to the Tableau and perform the analysis and reporting very efficiently and accurately  Tableau is easy to use as MS-excel, so that any user can learn it without any prerequisites and it is very powerful to solve the most complex analytical problems  Tableau is having its own patent query language called as “ViZQL” (visualization query language)  ViZQL=SQL+ Visualization
  • 5.
    ADVANTAGES OF TABLEAU Beyond Reporting Step3 See the Answer Step 2 User Interface Step 1Plug and play Beyond reporting User Interface See the answer
  • 6.
    HOW TABLEAU IS COMPAREWITH OTHER BI? Visual analysis •Tableau perform the analysis in the form of visuals every time with the help of ViZQL Any data source •Tableau can connect to any kind of data source right from the text file to database Fast performance •Tableau is having faster performance than any other BI tool in the market because of its state of art features like Tableau data engine, marks card and dashboards Business integration •Tableau is the platform, which is tightly coupled with any kind of business Web and mobile authoring •After the development of data view, we can share the report over the mobile and web
  • 7.
  • 8.
    WHICH INDUSTRY USING TABLEAU?  Every industries started using Tableau starting from transportation to retail  Tableau is used by more than 25,000 organizations worldwide because of its features like drag-and- drop interface.  Mostly, Tableau is used by the large companies such as WalMart, Coca Cola, Yahoo, ,Ferrai and T- Mobile. Tableau Retail Banking Transport ation Health care Insurance Manufact uring Oil and gas Telecom IT
  • 9.
    TABLEAU TIMELINE 2005 2006 Achieves8th consecutive quarter of record growth Named “Product of the Year” by PC Magazine Achieves 20th consecutive quarter of record growth Adds 1000 customer accounts Launches Desktop 5.0 & Server 5.0 #400 on Inc 500 #132 on Deloitte Technology Fast500 20091991 Three professor s (Chris, Pat, Chabot) in the Stanford university started research to build visual tool Achieves 4th consecutive quarter of record sales Launches Desktop1.0 – customers in every industry 2012 Launches Tableau 8.0 Launches Tableau 8.1 2013 Launches Tableau 8.2 Launches Tableau 8.3 Launches Tableau 7.1 Launches Tableau 7.2 Launches Tableau 7.3 2014 Launches Tableau 9.0.1  to 9.0.5 2015
  • 10.
    5 REASONS WHYDASHBOARDS MATTER NOW 1 Right Information to the Right Person 2 Distributed Decision-Making 3 Drill-up and Drill-down 4 Domain Experts Build Analytics 5 Visual, Easy to Understand
  • 11.
  • 12.
  • 13.
  • 14.
  • 15.
  • 16.
    TABLEAU COMPONENTS Tableau Desktop Create TableauServer Share - Web Tableau Reader Share - Local + Publish interactive analytics or dashboards + Secure information + Share visualizations and dashboards on the desktop + Filter, sort, and page through the views + Free download + It is the place where the complete project development in the Tableau will take place + Explore, visualize, and analyze your data + Create dashboards to consolidate multiple views Tableau Public Share - Everyone + It is used to share the report publicly to every one + Free download
  • 21.
    TABLEAU ARCHITECTURE DATA SOURCE TABLEAUDESKTOP TABLEAU SERVER User Any database Creating the data views/work books/dashbo ards DATACONNECTION PUBLISH Creating the project /users/group s and assign the permissions
  • 22.
    HOW TO WORKWITH TABLEAU 1 •Connect to the data source 2 •Drag and drop the required dimensions and KPI’s in to rows and columns 3 •Select the required chart in the “Show me” 4 •Click on Abc 5 •Publish the data views or work book in to the Tableau Server
  • 23.
  • 24.
    TABLEAU FILE TYPES TableauWorkbook (.twb) Tableau's default way to save work This includes Information to visualize the data No source data saved with this file Tableau Packaged Workbook (.twbx) This file includes extracted data and workbook information to build visualizations This file can be shared with others without access to source data Tableau Data Source (.tds) This file saves the server address, password, and other metadata related to data source It will used to access frequently used data sources Tableau Data Extract (.tde) Get the data into tableau in memory data engine This file includes the source data as filtered and aggregated. It improves the performance and enables more functions Tableau Bookmark (.tbm) Sharing worksheets from one workbook to others This file contains information to visualize and data source if the workbook is packaged workbook
  • 25.
    TABLEAU DATA TYPES Textvalues Date values Date and time values Numerical values Geographic values (latitude and longitude used for maps) Boolean values (true/false conditions)
  • 26.
    THANK YOU Contact :Knowledgebee@beenovo.com