Downloaded 1,009 times


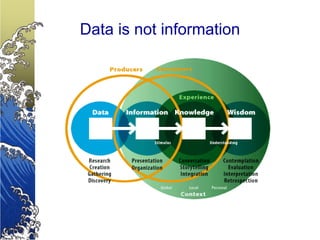


- Corporate data is growing rapidly at 100% every year and data generated in the past 3 years is equivalent to the previous 30 years. - With increasing data, organizations need tools to manage data and turn it into useful information for strategic decision making. - Business intelligence provides interactive tools for analyzing large amounts of data from different sources and transforming it into insightful reports and dashboards to help organizations make better business decisions.