The document provides an overview of business intelligence (BI), its methodologies, and the use of Tableau as a data visualization tool. It covers features of Tableau, integration options, types of data, and practical hands-on exercises related to creating visualizations, reports, and dashboards. Additionally, resources and references for further learning are mentioned.

![What is BI?
Business intelligence (BI) is a set of theories,
methodologies, architectures, and technologies that
transform raw data into meaningful and useful information
for business purposes. [Gnosis]
Business intelligence (BI) is an umbrella term that includes
the applications, infrastructure and tools, and best practices
that enable access to and analysis of information to
improve and optimize decisions and performance.
[Gartner]
4](https://image.slidesharecdn.com/tableauworkshopicctac-180220185525/85/Tableau-workshop-during-ICCTAC-2018-4-320.jpg)
![What is BI? Contd..
A set of methodologies, processes, architectures, and
technologies that leverage the output of information
management processes for analysis, reporting,
performance management, and information delivery. [
Forrester]
Business Intelligence (BI) comprises the strategies and
technologies used by enterprises for the data analysis of
business information. BI technologies provide historical,
current and predictive views of business operations. [
Wikipedia]
5](https://image.slidesharecdn.com/tableauworkshopicctac-180220185525/85/Tableau-workshop-during-ICCTAC-2018-5-320.jpg)
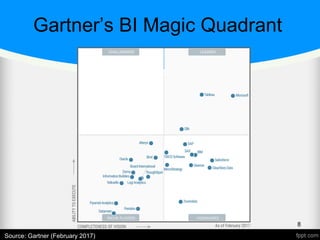
![A word about Gartner
• Gartner is the world's leading information
technology research and advisory
company.
“We deliver the technology-related insight
necessary for our clients to make the right
decisions, every day” [Gartner]
7](https://image.slidesharecdn.com/tableauworkshopicctac-180220185525/85/Tableau-workshop-during-ICCTAC-2018-7-320.jpg)