
Recommended
More Related Content
What's hot
What's hot (20)
Similar to 2016 Texas Presidential Race Demographics Analysis in 40 Characters
Similar to 2016 Texas Presidential Race Demographics Analysis in 40 Characters (20)
Recently uploaded
Recently uploaded (20)
2016 Texas Presidential Race Demographics Analysis in 40 Characters
- 1. 2016 Texas Presidential Race Demographic Analysis
- 2. 2016 Texas Presidential Race Voting Results for Entire State and a Function of Population Density Democrat Republican Libertarian Green Entire State Rural vs Urban Rural Suburban Urban Democrat Republican Other (Lib & Grn) Total Voting Age Pop Observations: Democrats lost by ~790,000 votes. (~9% of total votes) Rural areas represent about 1/3 of the voting age population and went strongly for Trump. Trump lost support as population density increased. Rural areas voted in higher numbers. * Data from State websites and ESRI; analysis property of D Tolman Interests LLC
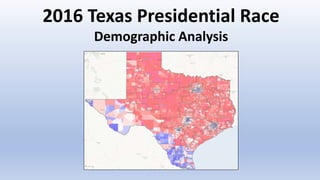
- 3. 2016 Texas Presidential Election Map Democrat/Republican Voting Ratio (calculated for each “Voting Tabulation District) • More Red = higher Republican Margin (Trump) • More Blue = higher Democrat Margin (Clinton) • White = Close to 50/50 Also shown are the US House District outlines and their current occupant * Data from State websites and ESRI; analysis property of D Tolman Interests LLC
- 4. Population Density 2010 This map shows the population density for SW Houston as of the 2010 census. Note the growing suburbs in the eastern portion of Fort Bend County. Red = Dense Suburban to Urban (>3000 people/sq mi) Yellow/Orange = Suburban (1000-3000 people/sq mi) Green = Rural (< 1000 people/sq mi) Pete Olson District 22 Al Green District 9 Fort Bend Co * Data from State websites and ESRI; analysis property of D Tolman Interests LLC 59 90 6 8 99 288
- 5. Population Growth 2010-16 The same SW Houston map showing the population growth during the past six years the suburbs continued to expand westward, potentially changing the makeup of District 22. Pink = Highest growth rate White = No growth Pete Olson District 22 Al Green District 9 Fort Bend Co * Data from State websites and ESRI; analysis property of D Tolman Interests LLC 59 90 6 8 99 288
- 6. SW Houston 2016 Presidential Race Democrat / Republican Ratio Note that many of the rapidly growing suburbs are characterized by close races at the presidential level. Has this demographic transition altered the District 22 race? Pete Olson District 22 Al Green District 9 Fort Bend Co 59 90 6 8 99 288 * Data from State websites and ESRI; analysis property of D Tolman Interests LLC
- 7. 2016 Presidential Race – Detailed View of the Sugar Land Area Democrat/Republican Results by Voting Tabulation District (tie=.5) * Data from State websites and ESRI; analysis property of D Tolman Interests LLC 59 90 6 8 99
- 8. Analysis Details 2016 Presidential Voting Trends in Texas as they relate to Two Key Demographic factors: Racial Diversity & Population Density (Rural vs Urban)
- 9. Voting trends by Pop Density (Rural vs Urban) Voting trends by Race (% Anglo) Red = cumulative sum of voters Rural Suburban Urban Change in variables with Increasing % Anglo Black = cumulative sum of Dem margin +=winning -=losing Blue = cumulative sum of voting age population Change in variables with Increasing population density Selected Demographic Analysis of 2016 Texas Presidential Race Trump vs Clinton Voting Trends relative to Urban vs Rural and Racial Trends Observations: Country vs City • Rural voters (<1000/sq mi) comprise about 33% of Texas voters and voted strongly for Trump. • Urban voters favored Clinton (but not as strongly as rural voters favored Trump). • Suburbia is the current battleground, with the more open, less dense suburbs trending to Trump and the more densely packed neighborhoods trending to Clinton. Anglo vs Minorities • Minorities voted strongly for Clinton, but with increasing white percentages, voting blocks tended more strongly for Trump. The breakeven point is ~45% white. • Minorities also tend to vote in smaller numbers as evidenced by the divergence of cumulative voters from the cumulative population line. Trump beats Clinton by ~794,000 votes VoteMargin Population 0 0 Dem ahead Rep ahead Dem ahead Rep ahead VoteMargin ~33% of voters * Data from State websites and ESRI; analysis property of D Tolman Interests LLC
- 10. Selected Demographic Analysis of 2016 Presidential Race Presidential Voting Trends for District 22 (Pete Olson) and District 9 (Al Green) Voting trends by Pop Density (Rural vs Urban) Voting trends by Race (% Anglo) Dem Rep Red = cumulative sum of voters Rural Suburban Urban Increasing % Anglo Black = cumulative sum of Dem margin Blue = cumulative sum of voting age population Increasing population density AlGreenPeteOlson * Data from State websites and ESRI; analysis property of D Tolman Interests LLC
- 11. Cumulative Sum of 2016 Texas Dem/Rep Presidential Margin by US District Incumbent Rural Suburban Urban Increasing population densityVoteMargin Dem ahead Rep ahead * Data from State websites and ESRI; analysis property of D Tolman Interests LLC