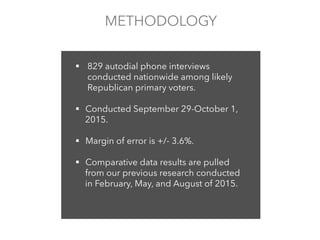
This document summarizes the results of a nationwide survey of 829 likely Republican primary voters conducted from September 29 to October 1, 2015. Key findings include:
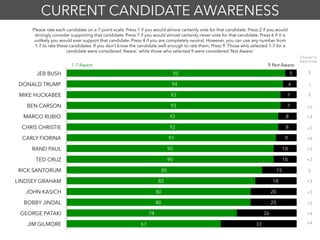
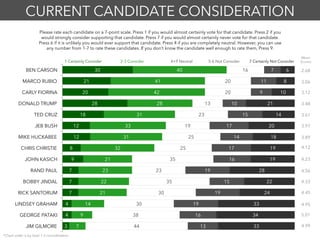
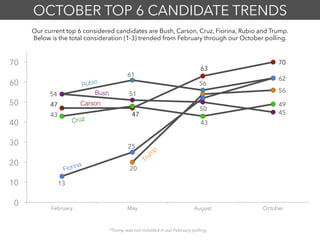
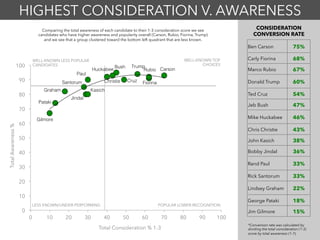
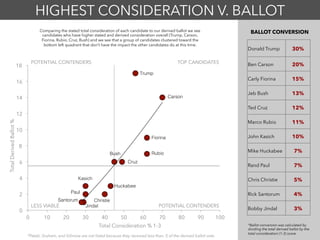
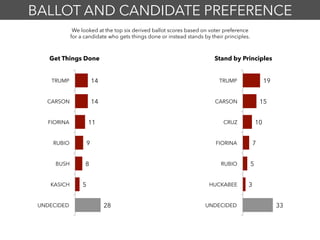
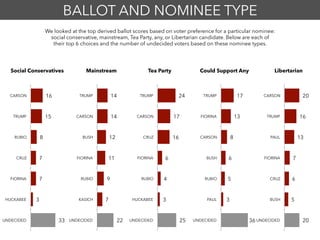
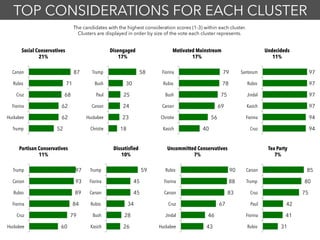
- Donald Trump and Ben Carson are leading the field in name recognition and consideration, followed by Marco Rubio, Carly Fiorina, and others.
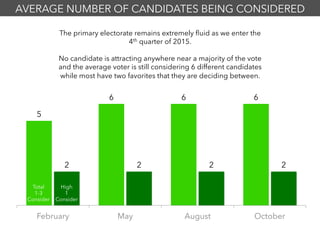
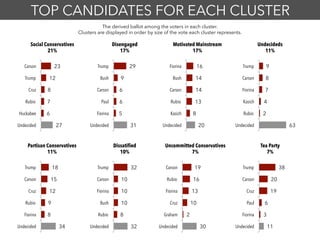
- No candidate has a majority support yet and voters are still considering an average of 6 candidates.
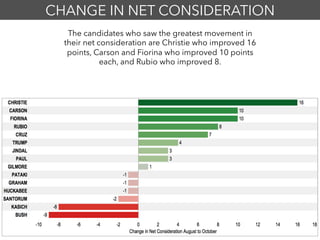
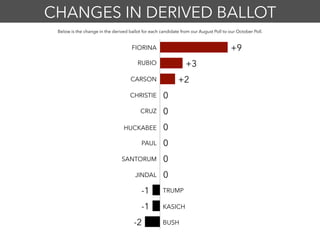
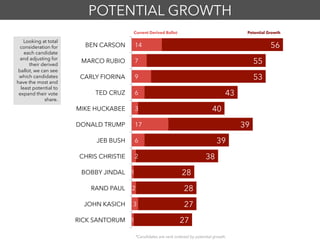
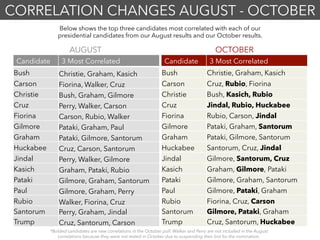
- Trump saw the largest increase in support over prior months, followed by gains for Carson, Fiorina, and Rubio.
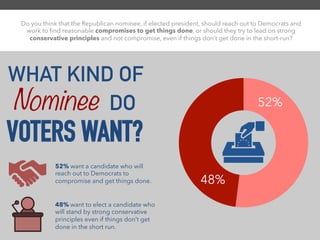
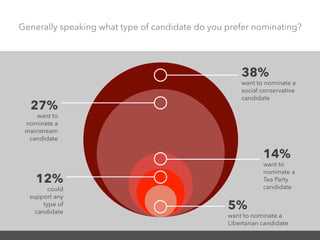
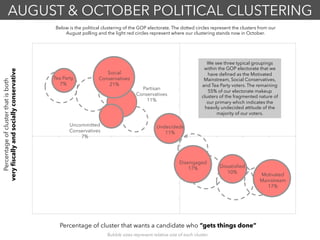
- A majority of voters want a nominee who will reach out to compromise, though views on the preferred type of candidate are mixed.