Download as PDF, PPTX
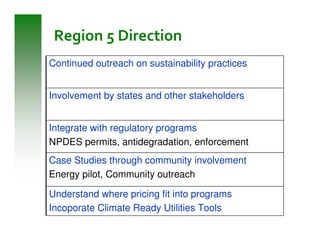
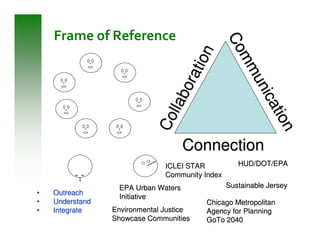

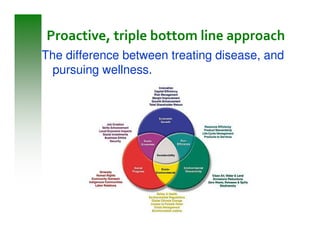
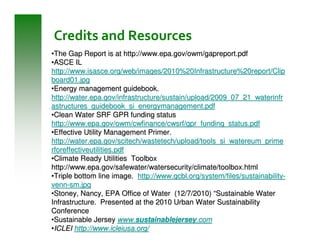


This document summarizes sustainable water infrastructure practices promoted by the EPA, including green infrastructure, asset management, energy efficiency, water efficiency, and financing incentives. It provides information on challenges and opportunities for implementing these practices, and resources available from the EPA to support state initiatives in adopting sustainable approaches. The goal is to help regions and states navigate infrastructure replacement needs in a sustainable and cost-effective manner.