Download as PDF, PPTX


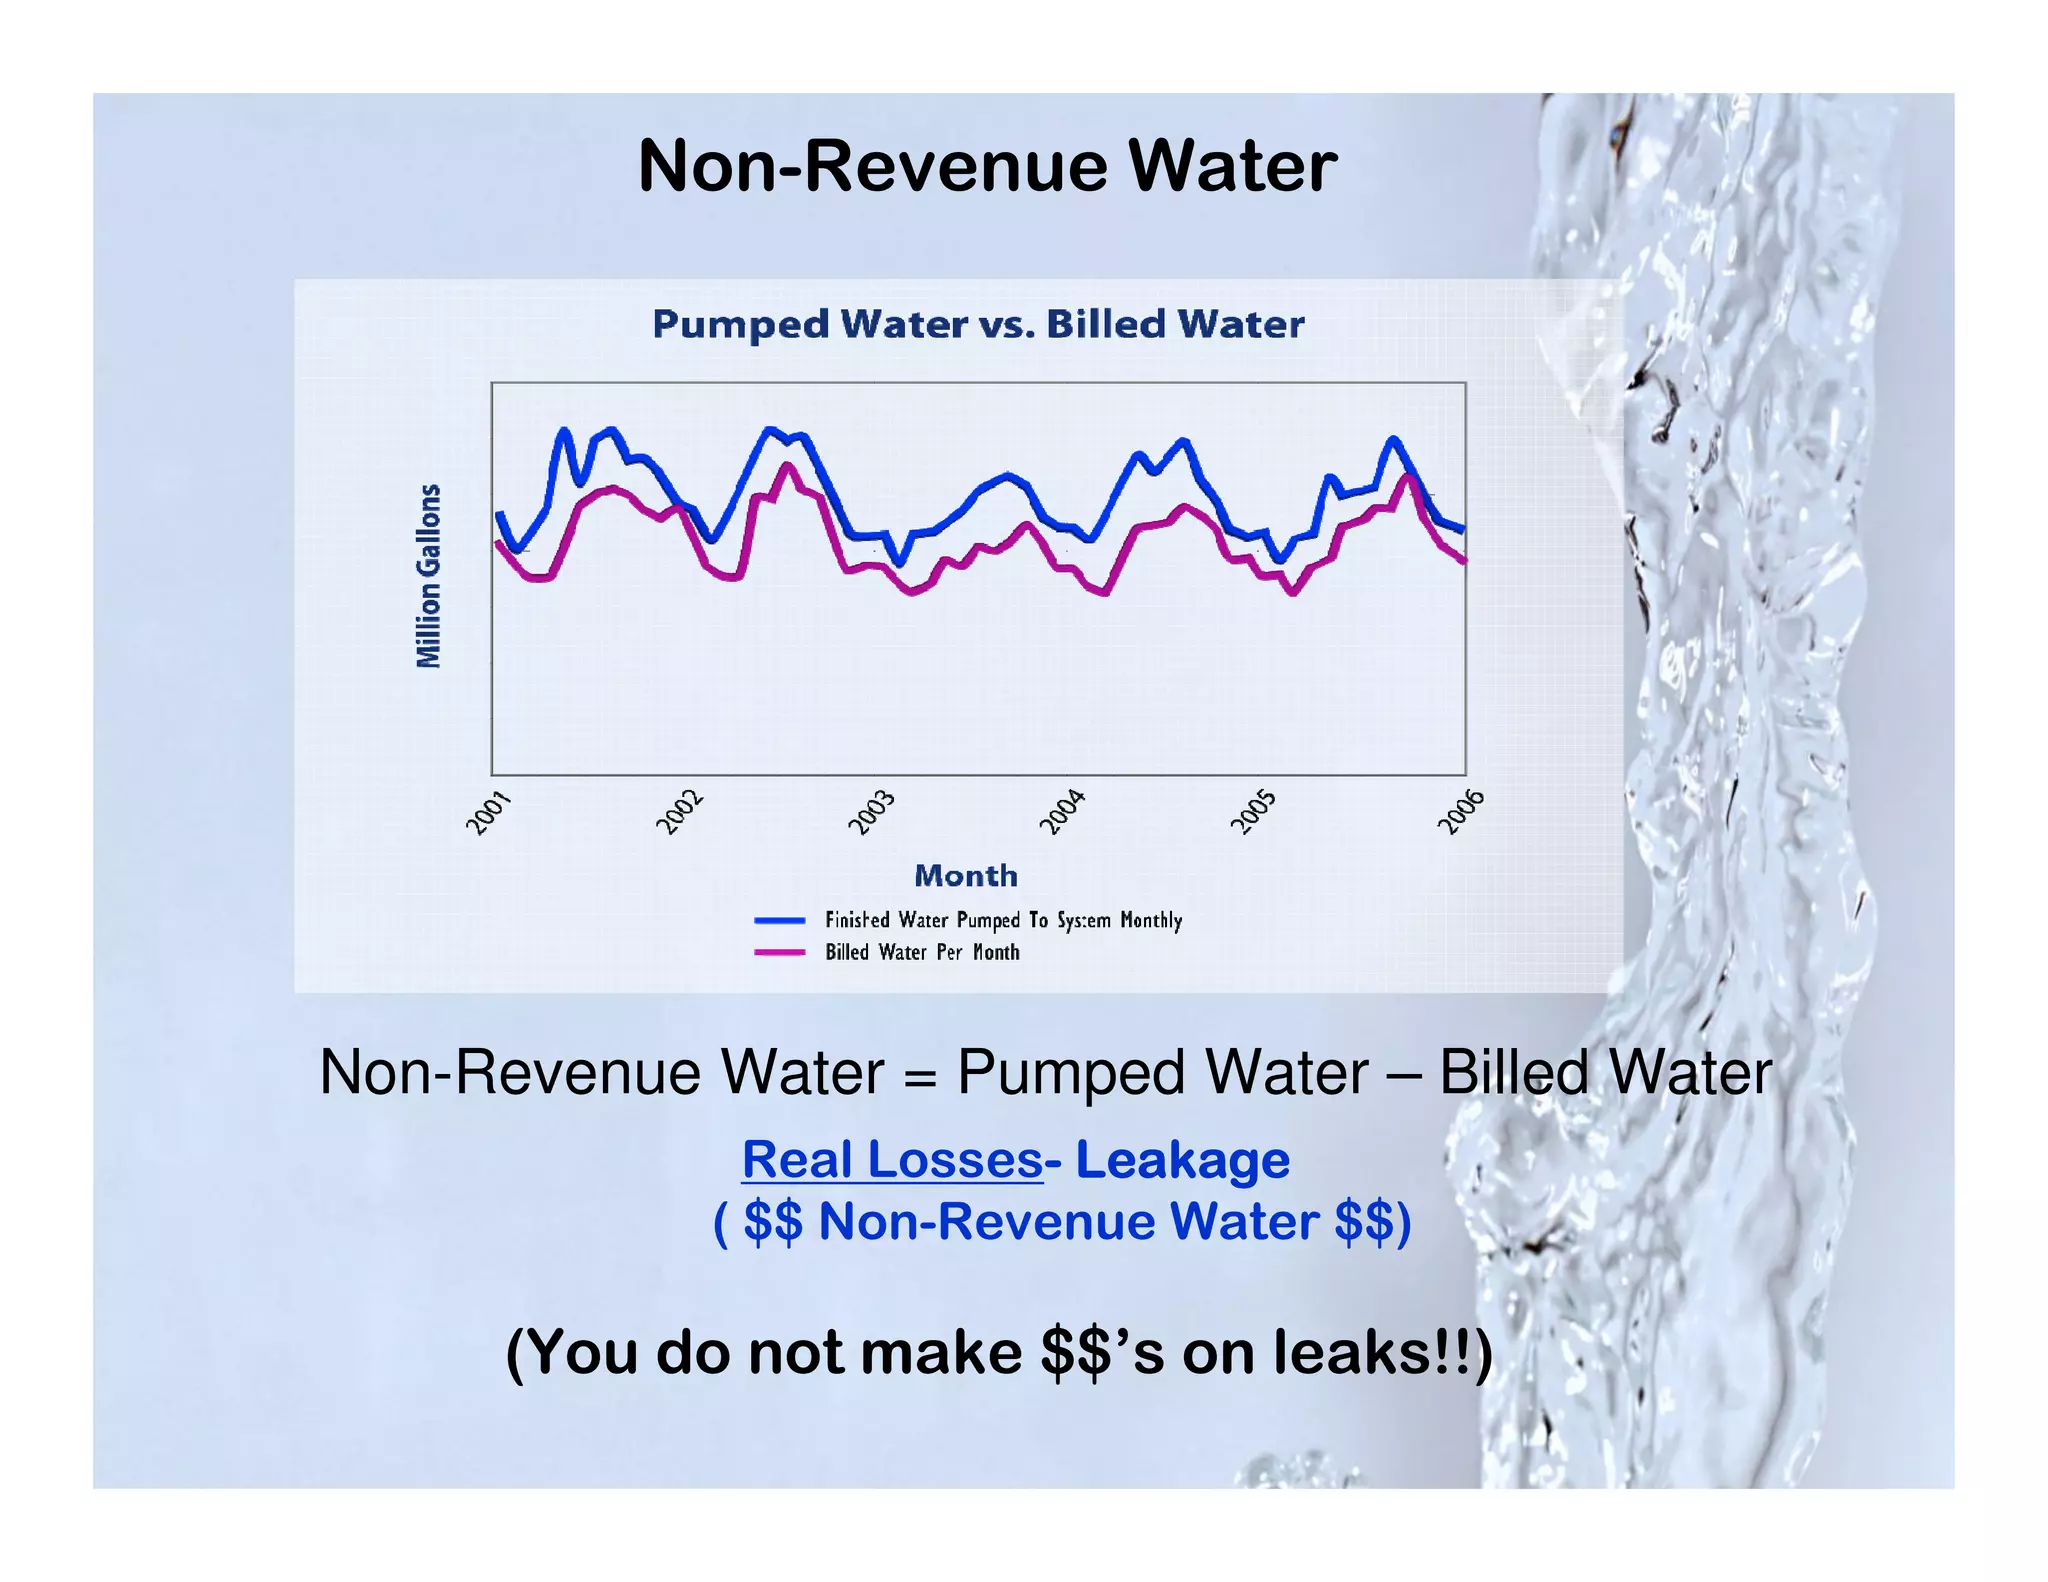


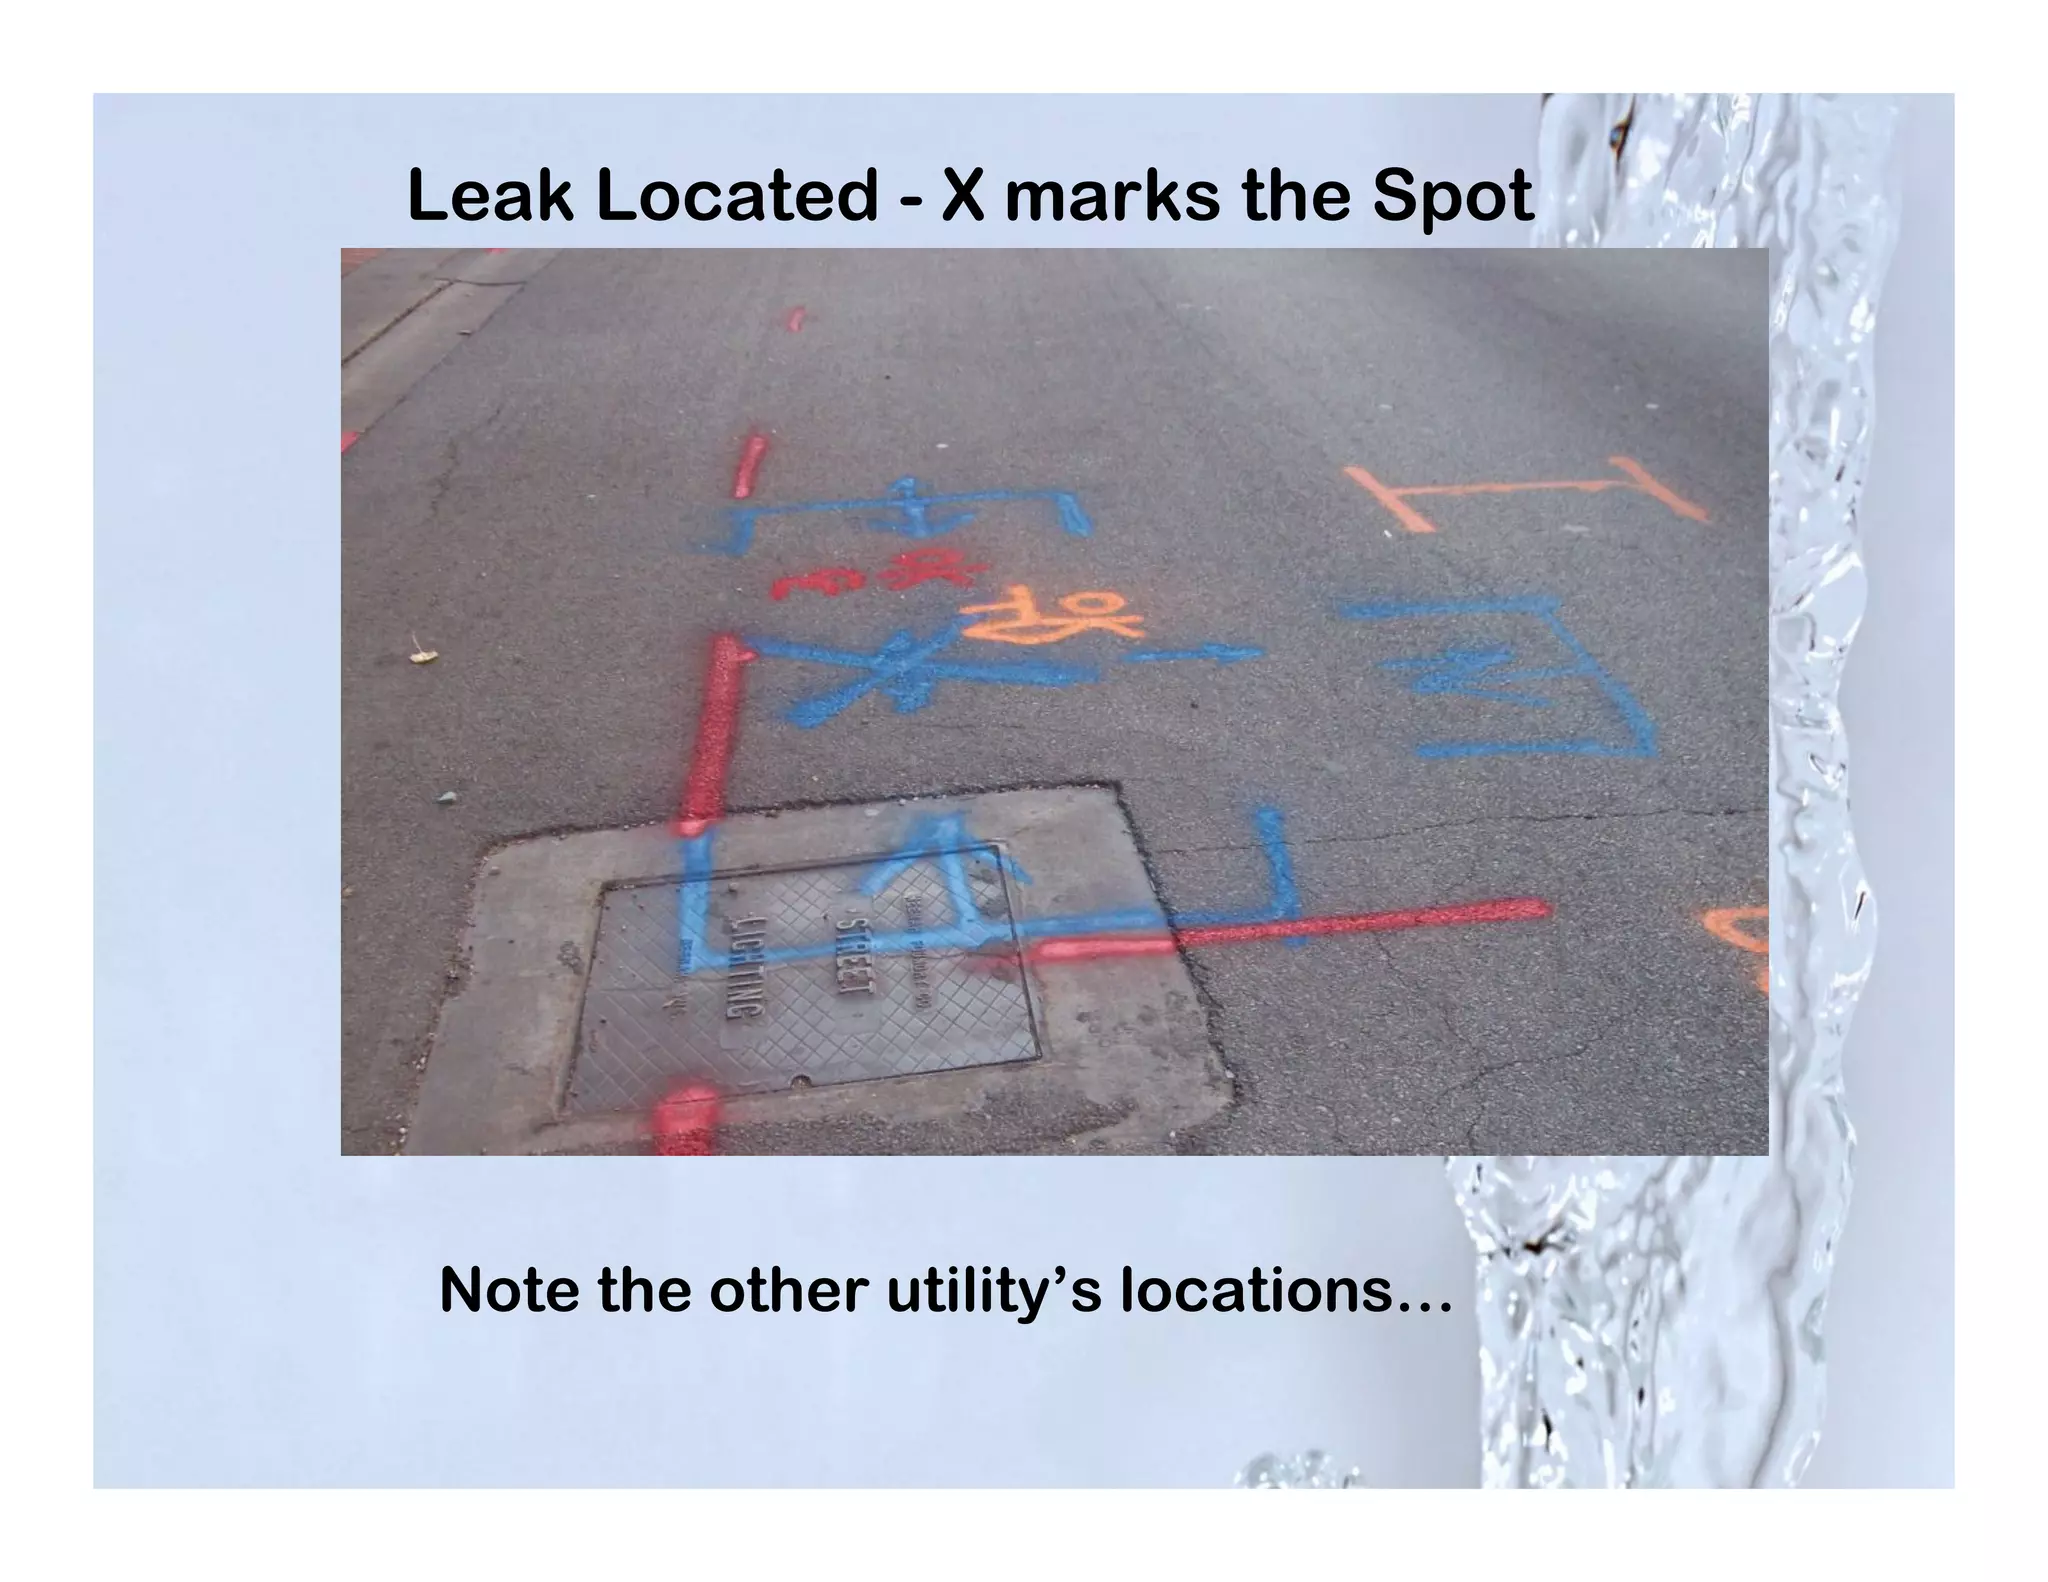


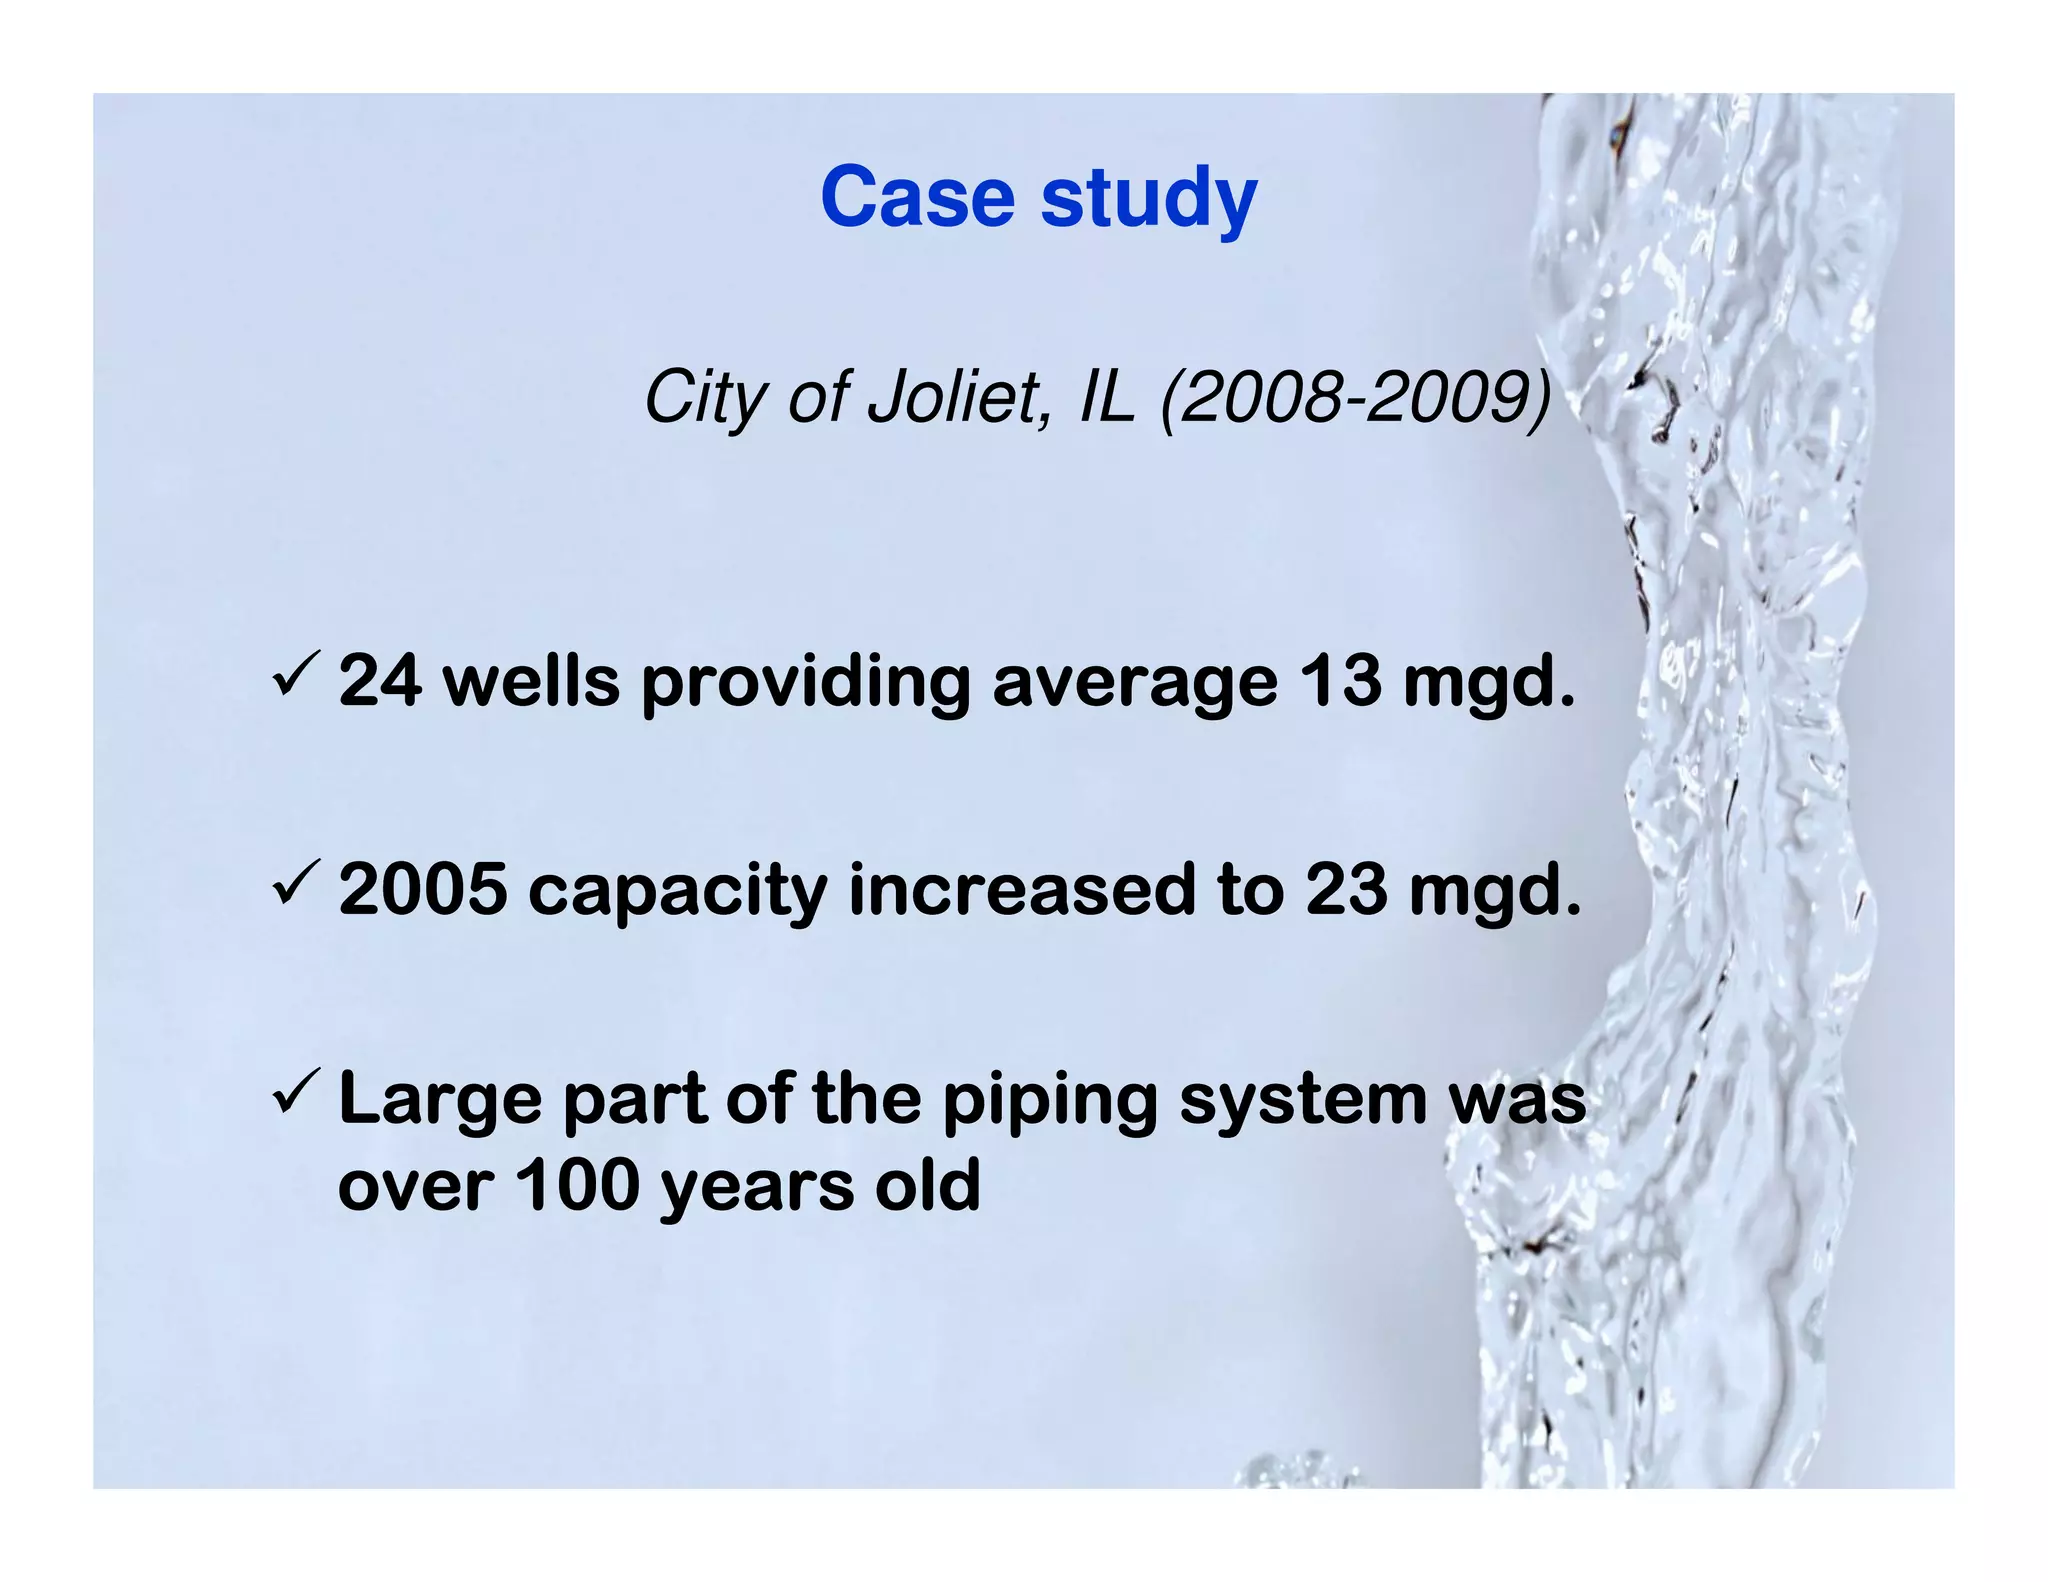


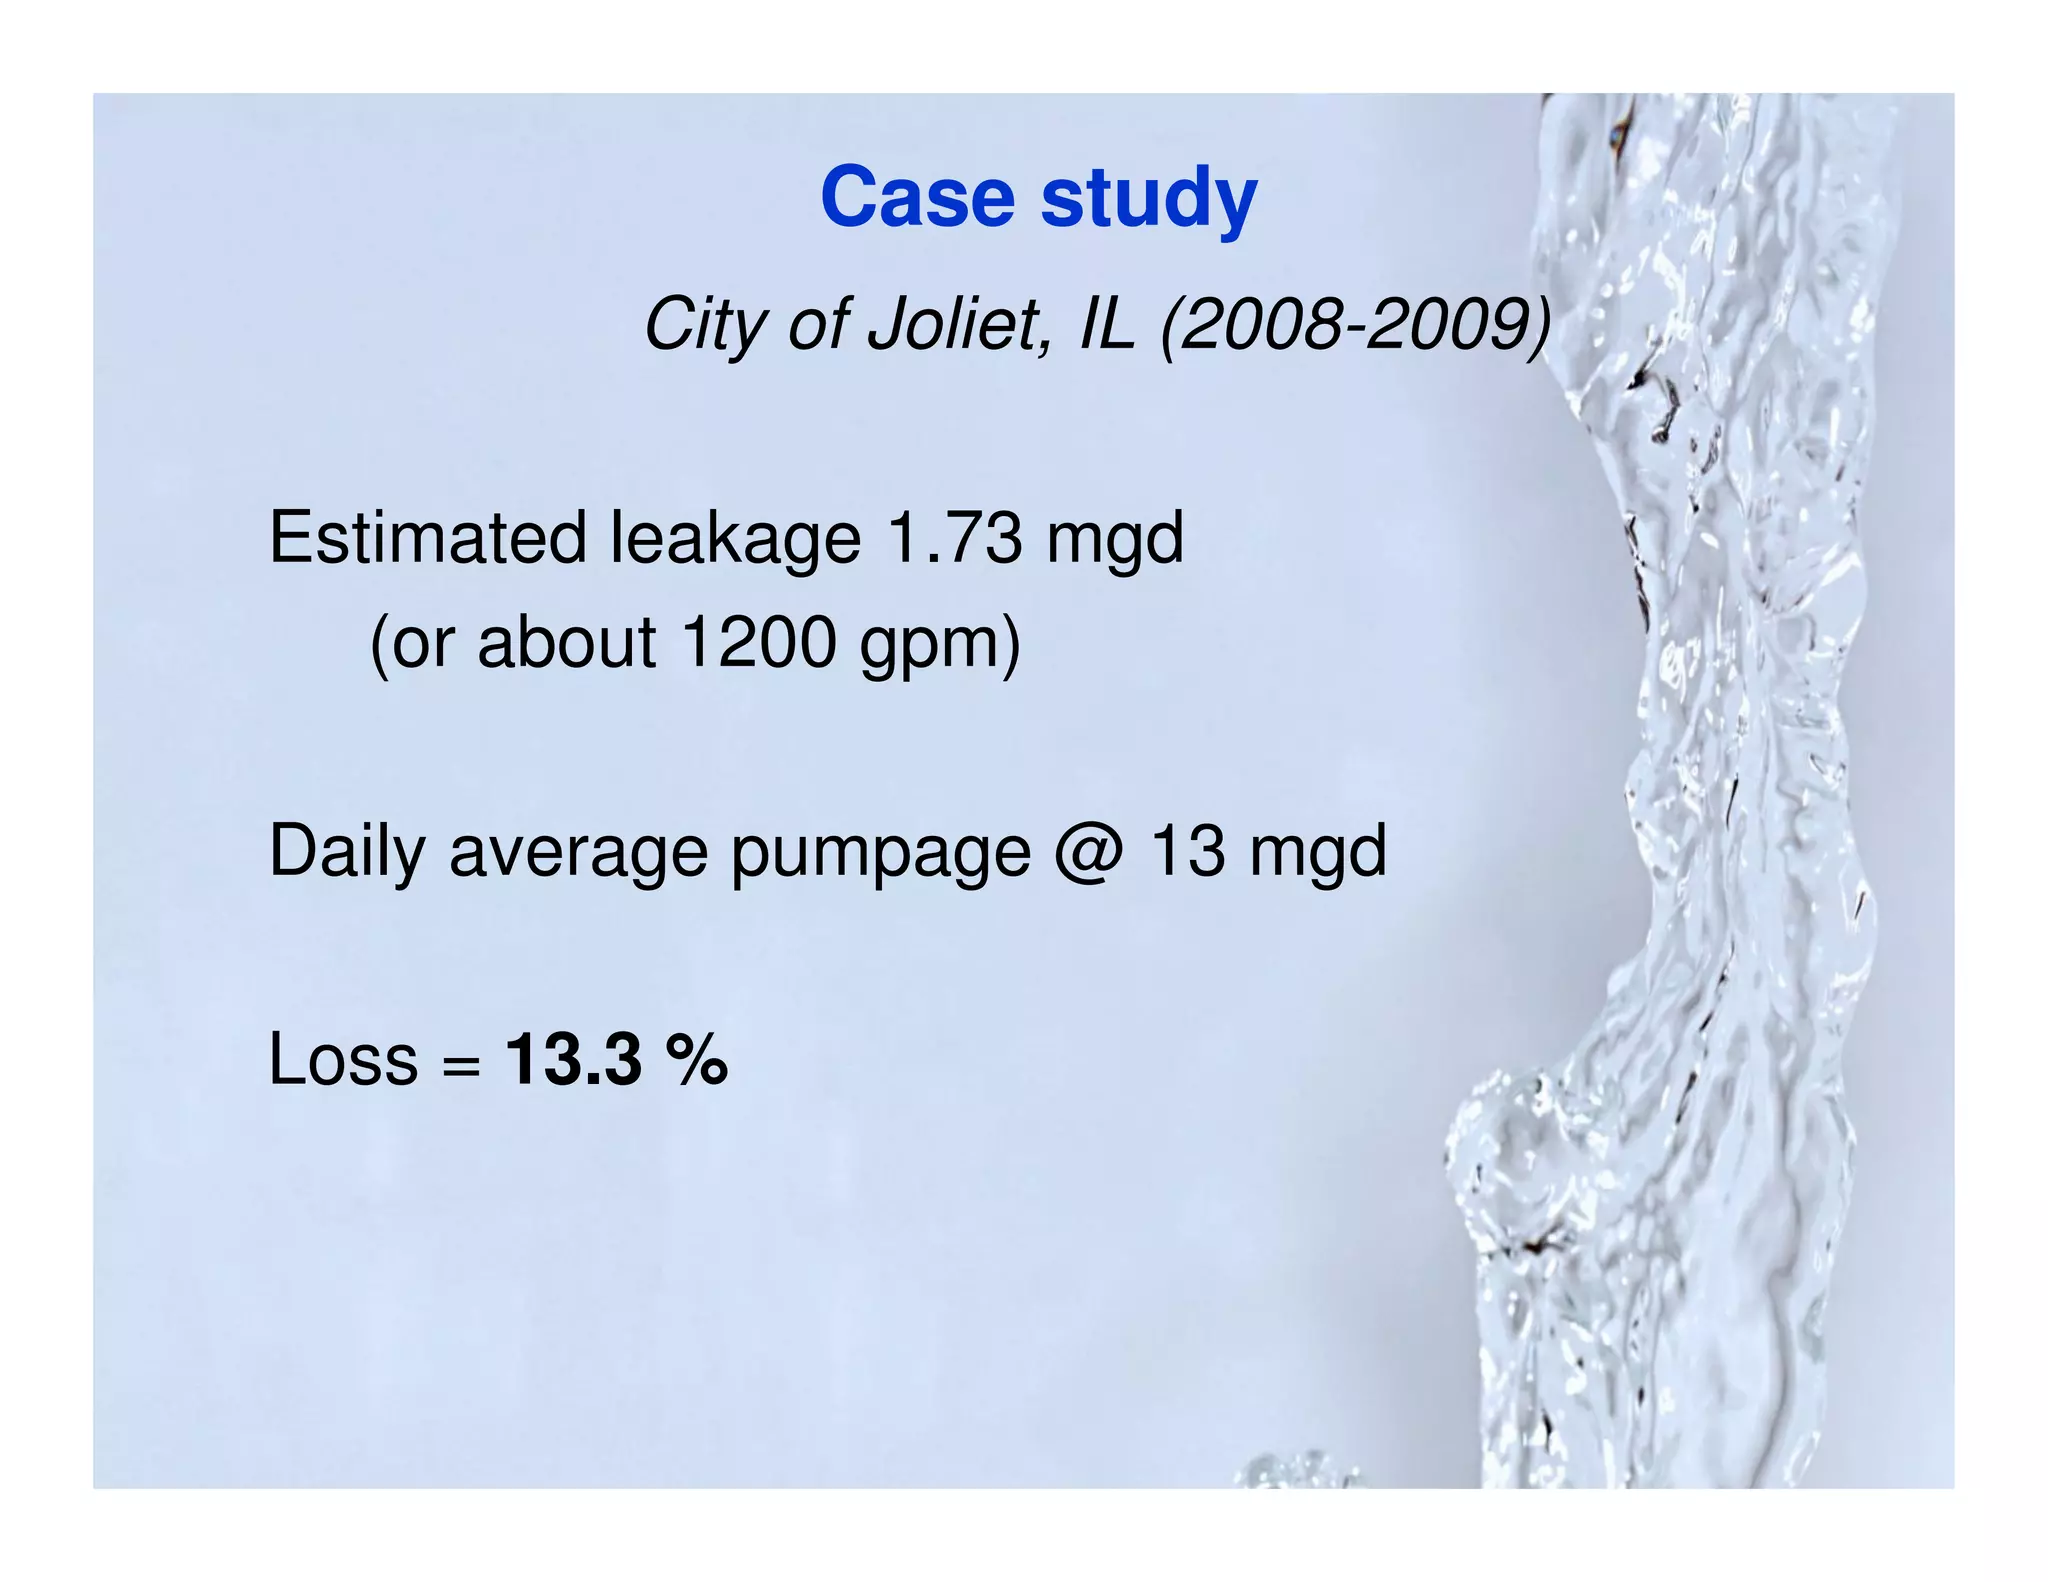

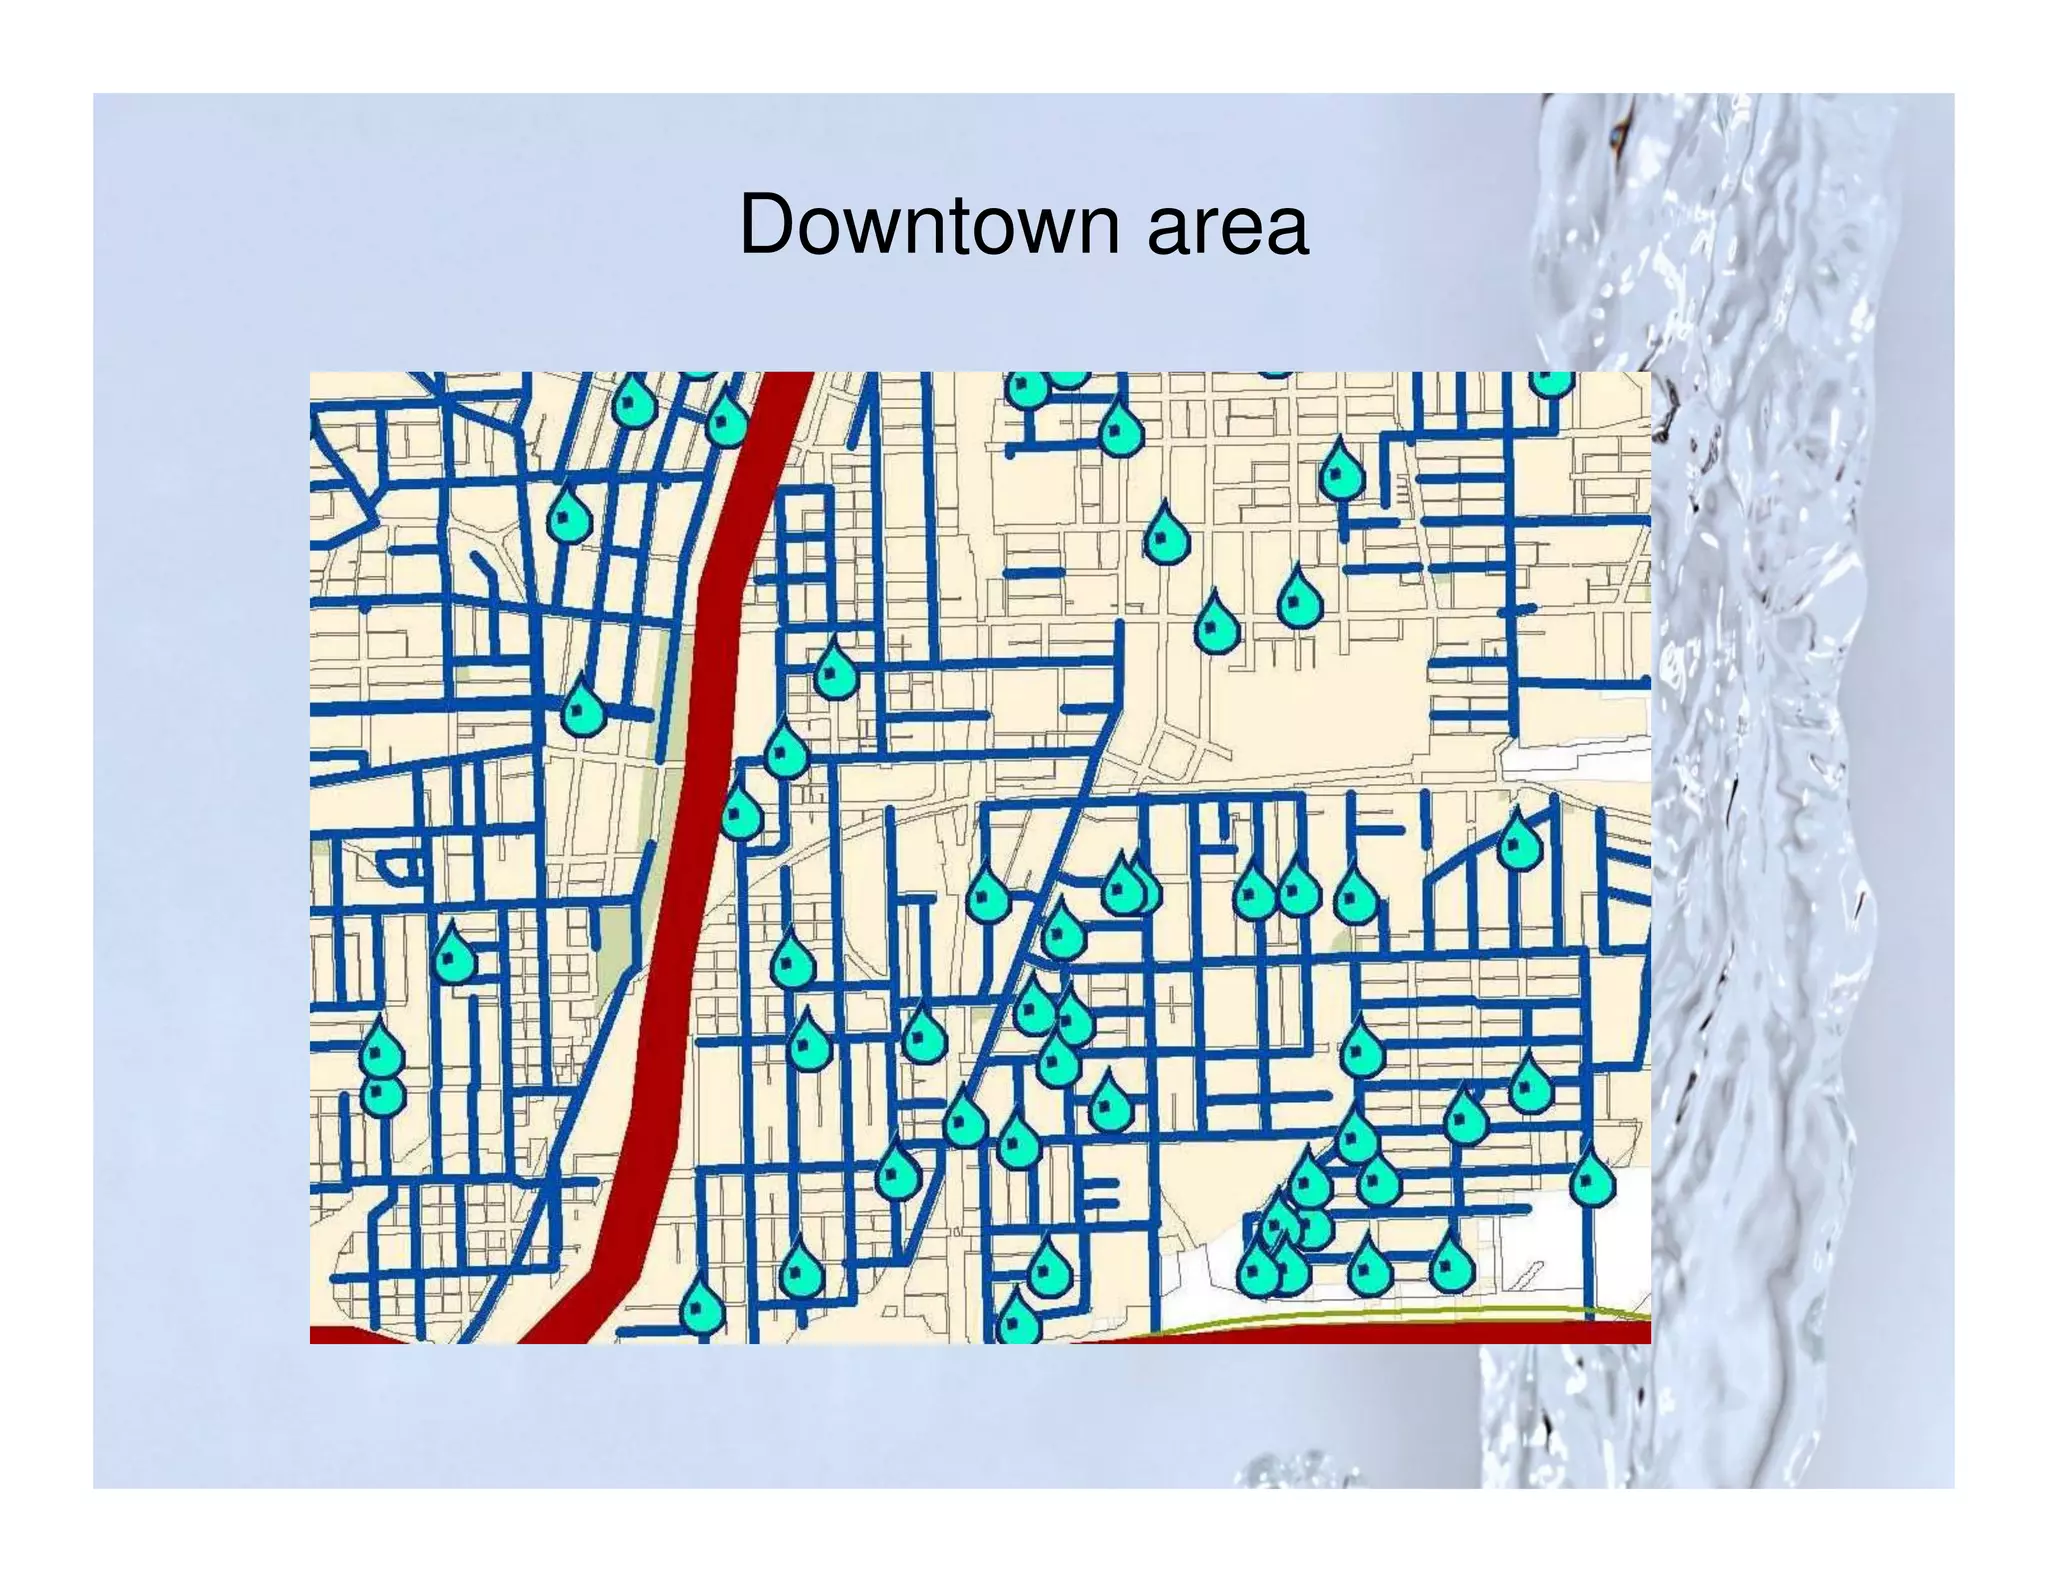


The document discusses water loss control through leak detection in Joliet, Illinois. It summarizes that initial leak detection surveys in 180 miles of mains found 149 leaks reducing losses by 1.73 million gallons per day. Subsequent surveys in 150 more miles found 69 leaks reducing losses by an additional 0.26 million gallons. In total, the surveys are estimated to save over $1 million annually in wholesale water costs through repaired leaks. The case study demonstrates how leak detection can significantly reduce real water losses and recover costs.