Download to read offline
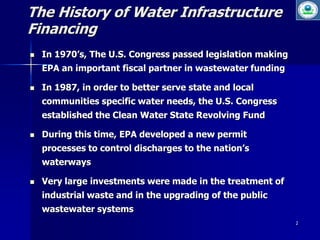
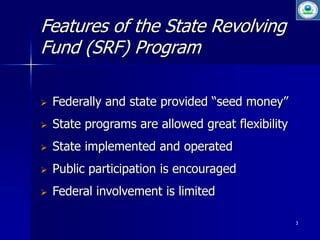
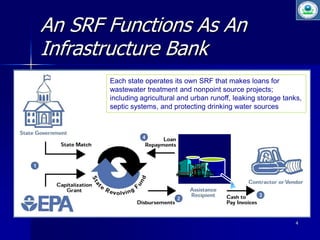
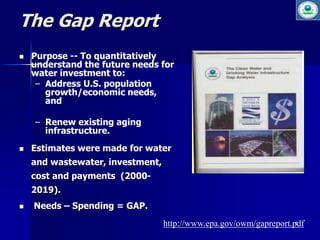
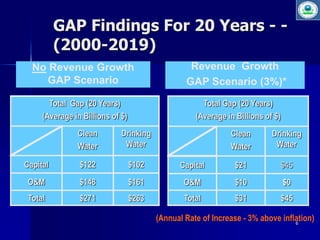

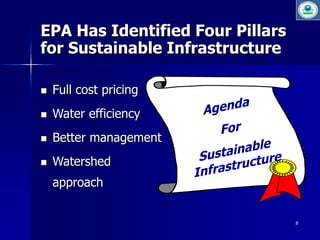


The document discusses the history and importance of sustainable water infrastructure financing in the U.S., highlighting the Clean Water State Revolving Fund and its flexibility for state implementation. It outlines the current challenges in funding to address population growth and aging infrastructure, citing the estimated financial gaps for water investment from 2000 to 2019. The document concludes with the EPA's four pillars for sustainable infrastructure: full cost pricing, water efficiency, better management, and a watershed approach.


