Download to read offline


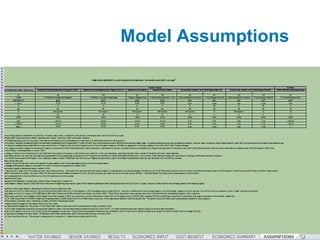

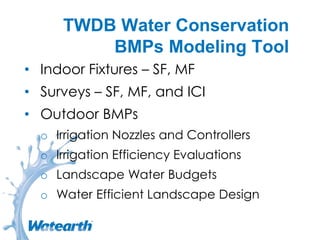
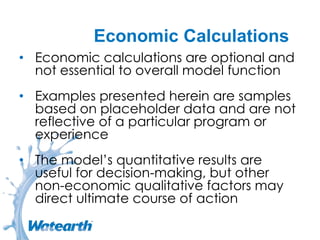
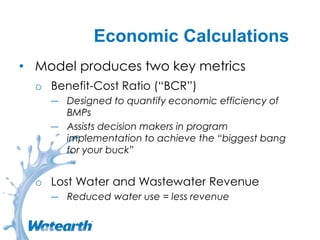
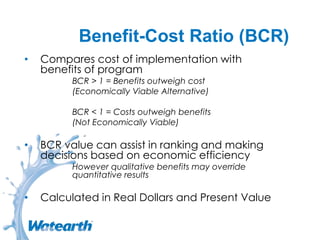
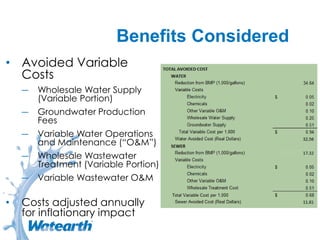
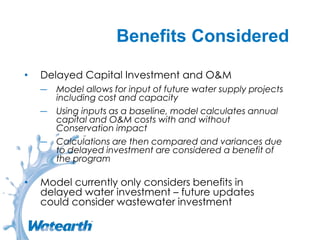
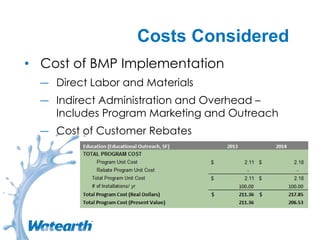
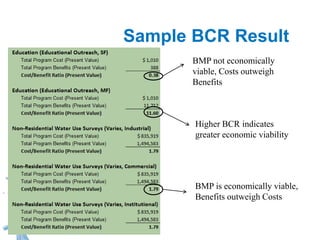
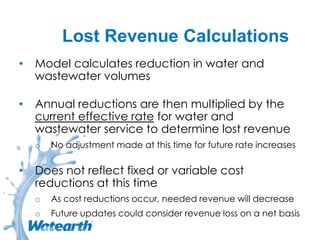
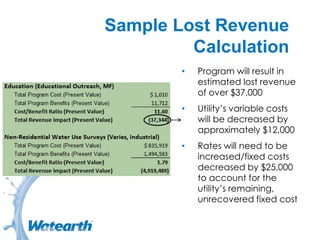

The Texas Water Development Board invites participants to a webinar on a modeling tool designed to analyze the cost-benefit and demand savings of municipal water conservation efforts. The tool evaluates 32 best management practices (BMPs) for water conservation, focusing on economic analyses including benefit-cost ratios to assess the viability of programs. It highlights the importance of considering both quantitative economic results and qualitative benefits in decision-making regarding water conservation investments.