Download as PDF, PPTX


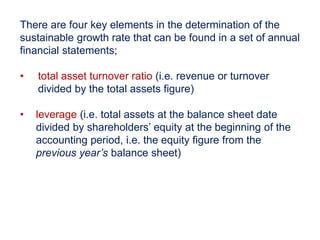
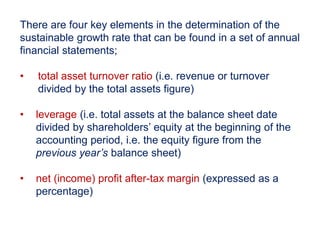
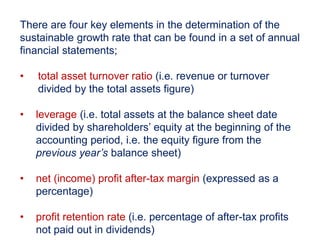
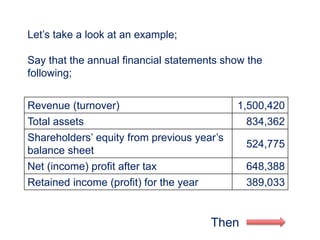
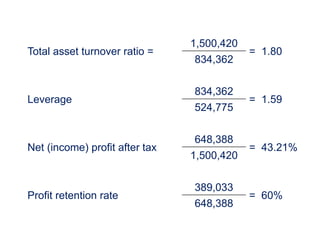
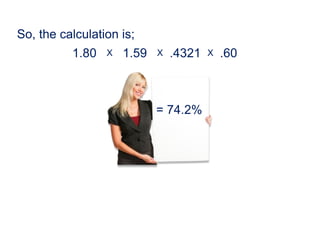
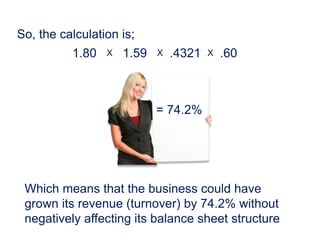

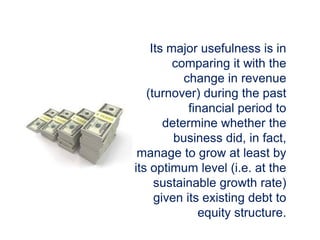


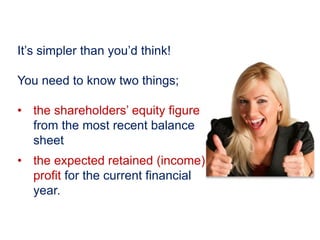
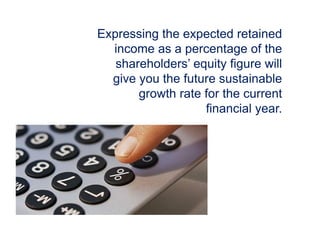
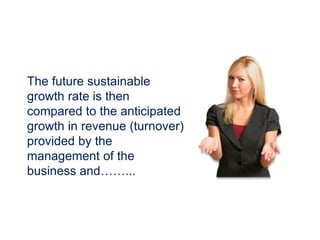


The sustainable growth rate (SGR) is pivotal for businesses to understand how fast they can grow sales without harming their financial structure, with growth often tied to debt. Key elements influencing SGR are total asset turnover, leverage, net profit margin, and profit retention rate, which are derived from financial statements. A company's future SGR can be predicted by analyzing equity and expected retained profits, providing insights into whether the business can sustain its projected growth.


![Promacs ppt Tamplate 2022[53] - Read-Only.pptx](https://cdn.slidesharecdn.com/ss_thumbnails/promacsppttamplate202253-read-only-221218182756-a524ca6f-thumbnail.jpg?width=640&height=640&fit=bounds)


