The document discusses the significance of thoughtful forecasting in business performance evaluation, emphasizing that forecasts are not infallible and should account for unexpected events. It outlines key principles for effective financial forecasting, including understanding financial relationships, industry realities, and cognitive biases, while also providing practical examples. Additionally, it highlights the importance of using financial ratios to model future performance and encourages a nuanced approach that blends quantitative and qualitative analysis.
![weaknesses
This technical note was prepared by Professor Michael J. Schill.
Special thanks go to Vladimir Kolcin for data-collection
assistance and to Lee Ann Long-Tyler and Ray Nedzel for
technical assistance. Copyright © 2015 by the University of
Virginia Darden School Foundation, Charlottesville, VA. All
rights reserved. To order copies, send an e-mail to
[email protected] No part of this publication may be
reproduced, stored in a retrieval system, used in a spreadsheet,
or transmitted in any form or by any means—electronic,
mechanical, photocopying, recording, or otherwise—without the
permission of the Darden School Foundation.
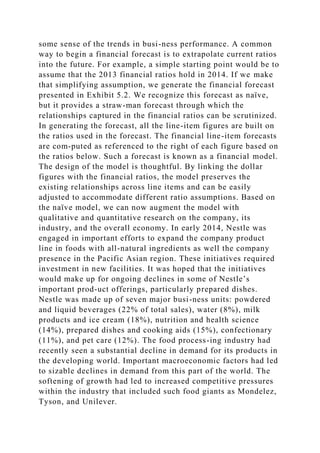
Part TwoFinancial Analysis and Forecasting
across a broad spectrum of business activities. The income
statement (also known as the profit-and-loss statement)
measures flows of costs, revenue, and profits over a defined
period of time, such as a year. The balance sheet provides a
snapshot of business invest-ment and financing at a particular
point in time, such as the end of a year. Both state-ments
combine to provide a rich picture of a business’s financial
performance. The analysis of financial statements is one
important way of understanding the mechanics of the systems
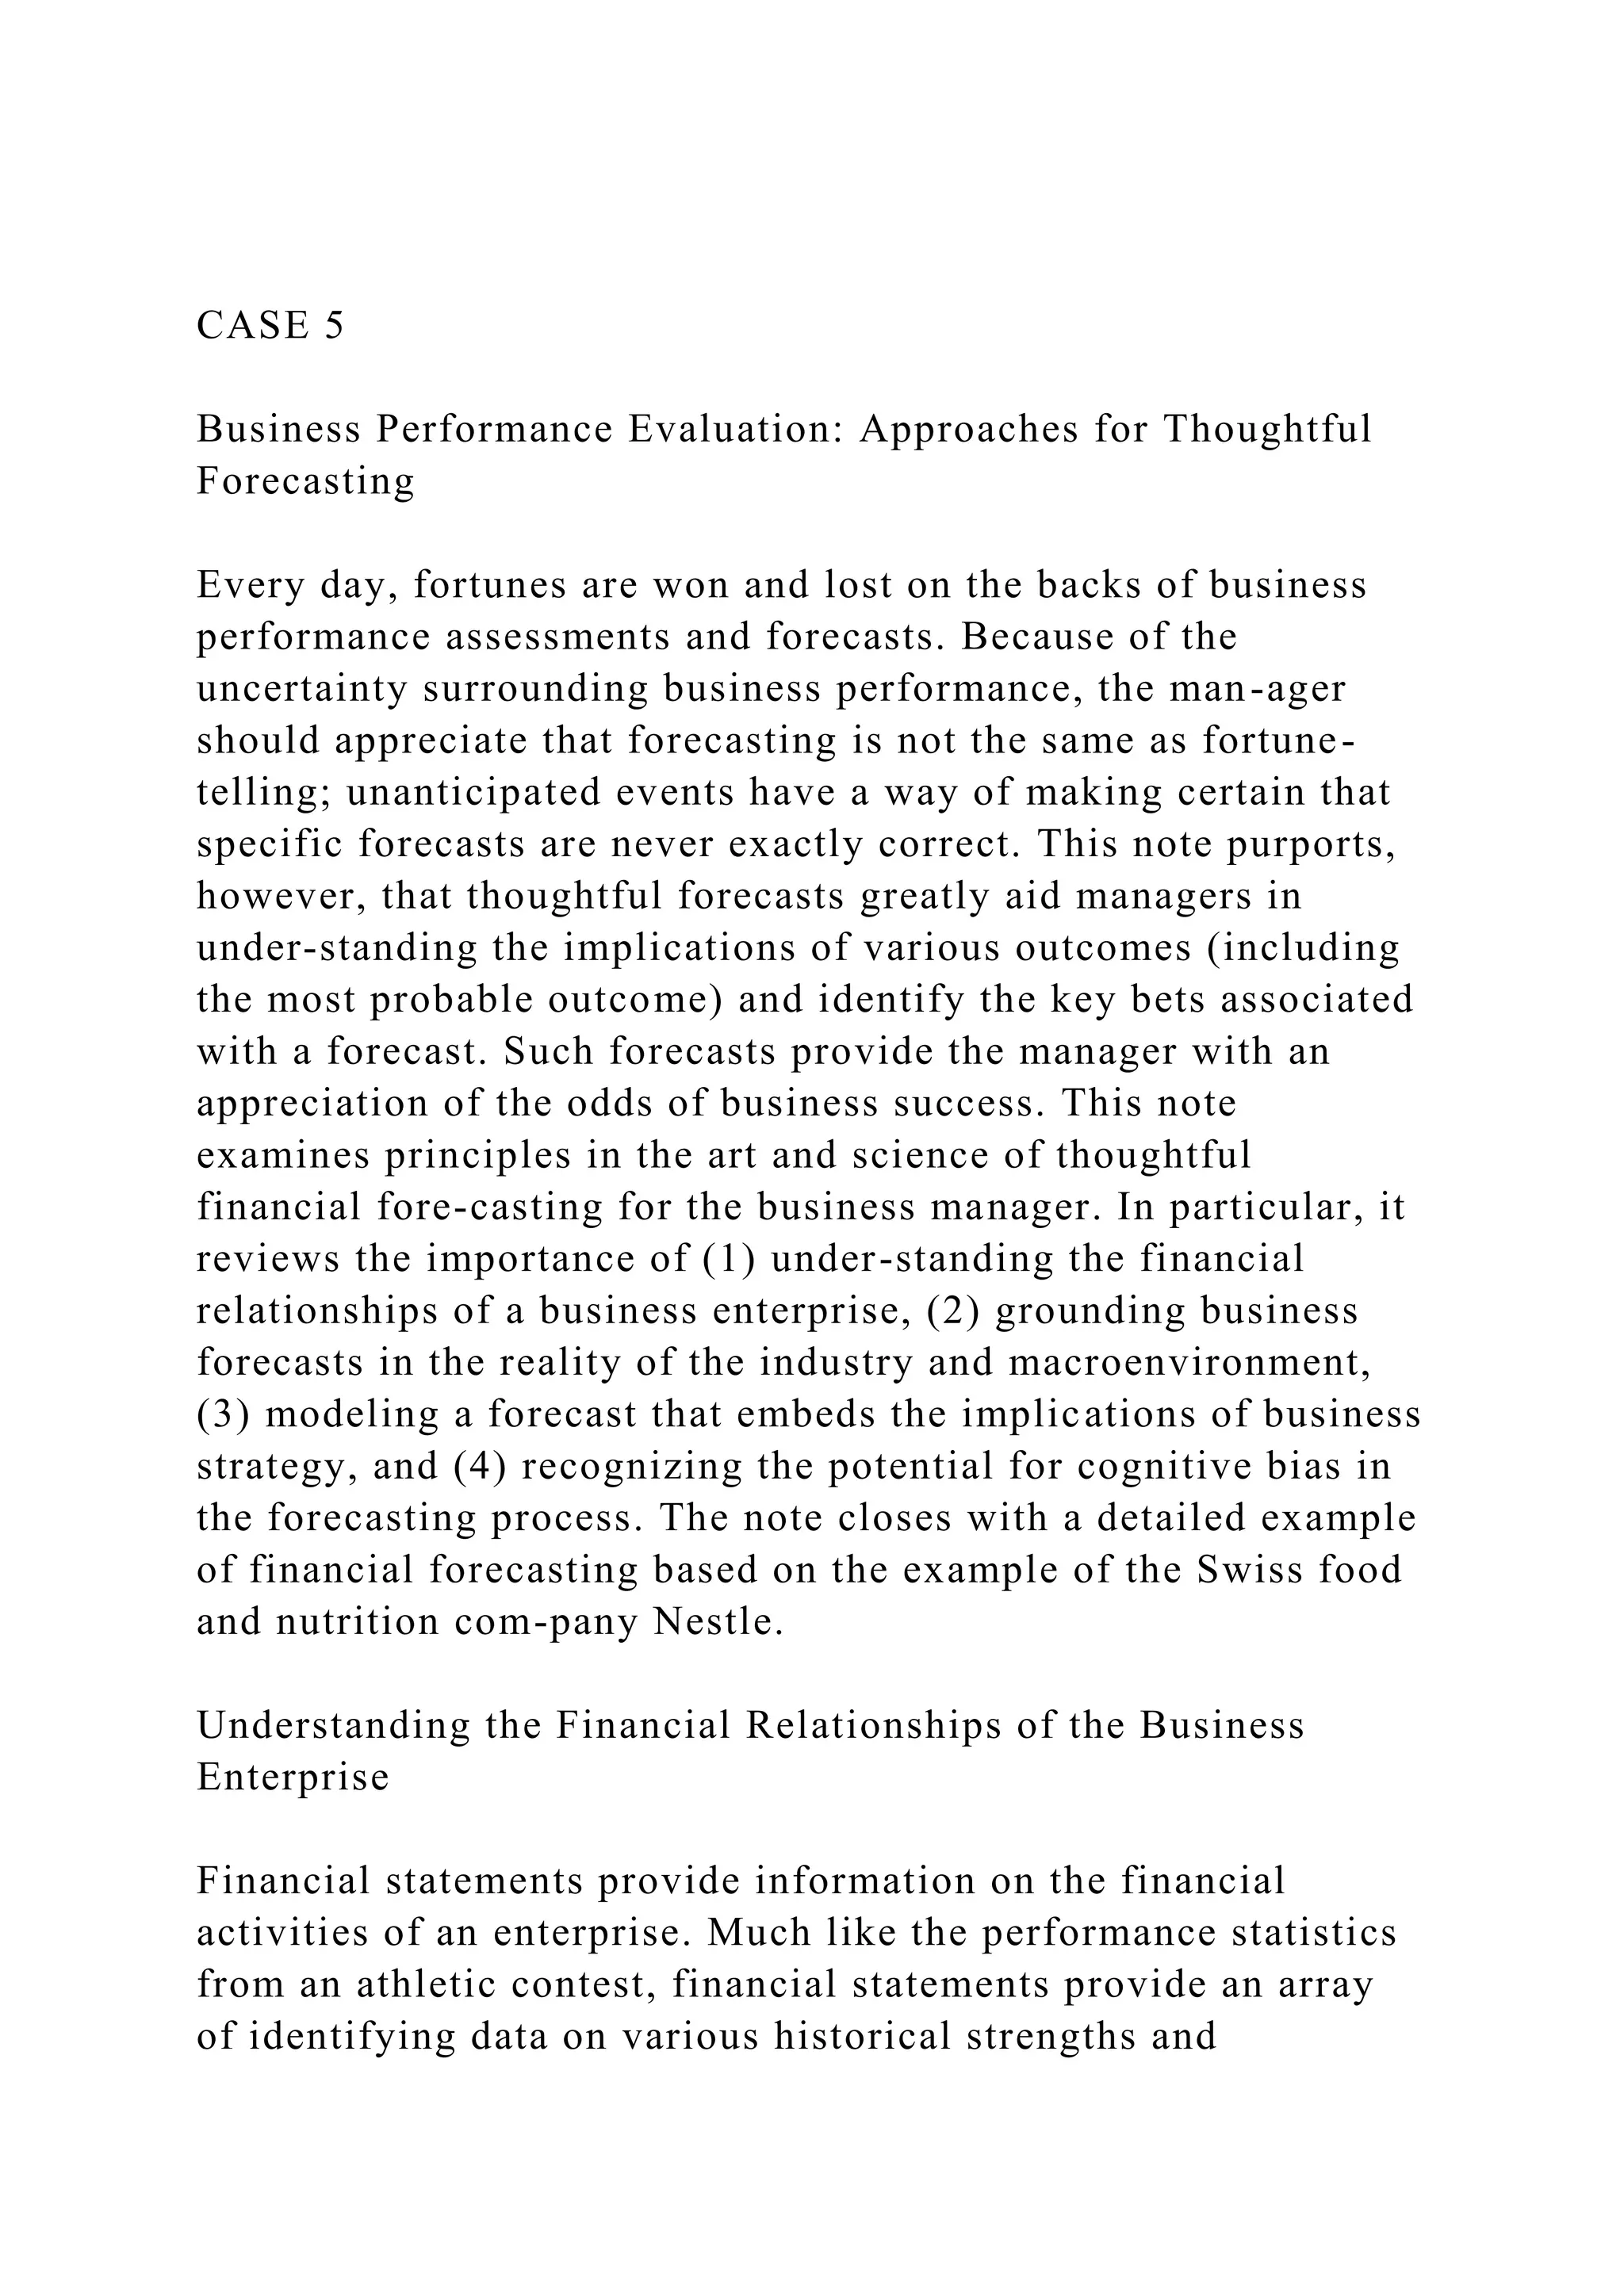
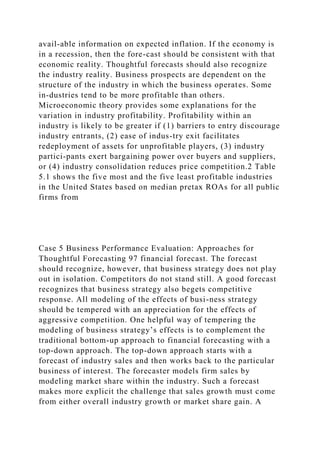
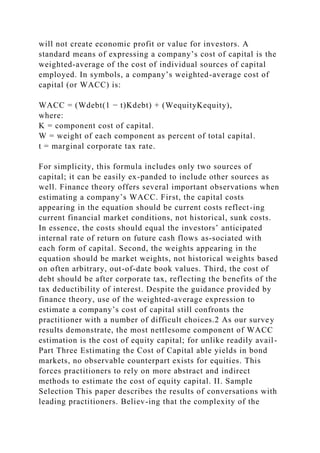
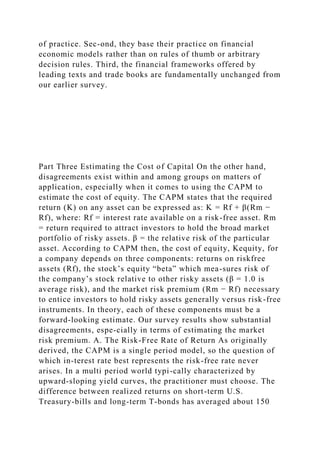
that make up business operations. Interpreting Financial Ratios
Financial ratios provide a useful way to identify and compare
relationships across finan-cial statement line items.1 Trends in
the relationships captured by financial ratios are particularly
helpful in modeling a financial forecast. The comparison of
ratios across time or with similar firms provides diagnostic
tools for assessing the health of the vari-ous systems in the
enterprise. These tools and the assessments obtained with them
provide the foundation for financial forecasting. We review
common financial ratios for examining business operating](https://image.slidesharecdn.com/case5businessperformanceevaluationapproachesforthoughtf-221224154508-ec046d2b/85/CASE-5Business-Performance-Evaluation-Approaches-for-Thoughtf-docx-2-320.jpg)
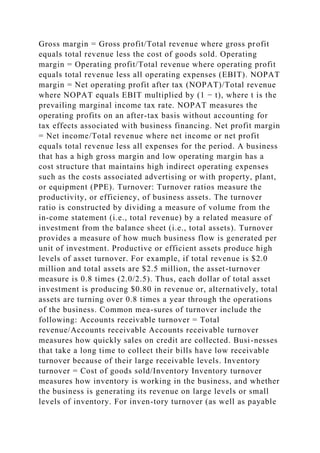
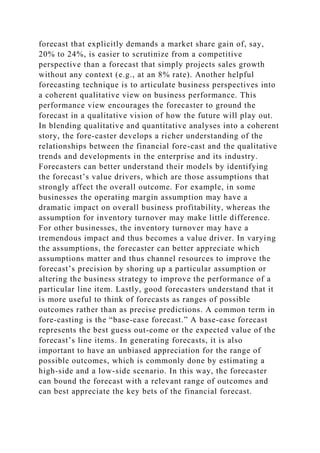
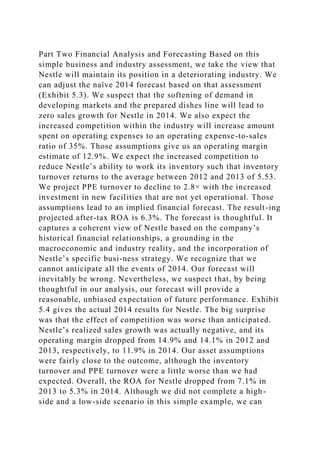
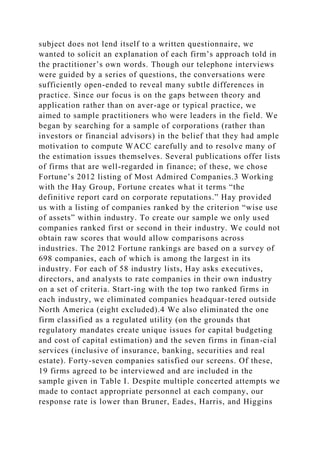
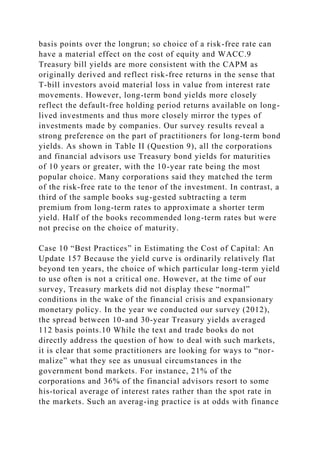
![performance. It is worth noting that there is wide variation in
the definition of financial ratios. A mea-sure such as return on
assets is computed many different ways in the business world.
Although the precise definitions may vary, there is greater
consensus on the interpreta-tion and implication of each ratio.
This note presents one such definition and reviews the
interpretation. Growth rates: Growth rates capture the year-on-
year percentage change in a particu-lar line item. For example,
if total revenue for a business increases from $1.8 million to
$2.0 million, the total revenue growth for the business is said to
be 11.1% [(2.0 − 1.8)/1.8]. Total revenue growth can be further
decomposed into two other growth measures: unit growth (the
growth in revenue due to an increase in units sold) and price
growth (the growth in revenue due to an increase in the price of
each unit). In the above example, if unit growth for the business
is 5.0%, the remaining 6.1% of total growth can be attributed to
increases in prices or price growth. Margins: Margin ratios
capture the percentage of revenue that flows into profit or,
alternatively, the percentage of revenue not consumed by
business costs. Business profits can be defined in many ways.
Gross profit reports the gains to revenue after subtracting the
direct expenses. Operating profit reports the gains to revenue
after subtracting all associated operating expenses. Operating
profit is also commonly re-ferred to as earnings before interest
and taxes (EBIT). Net profit reports the gains to revenue after
subtracting all associated expenses, including financing
expenses and taxes. Each of these measures of profits have an
associated margin. For example, if operating profit is $0.2
million and total revenue is $2.0 milli
Case 5 Business Performance Evaluation: Approaches for
Thoughtful Forecasting 91 margin is 10% (0.2/2.0). Thus, for
each revenue dollar, an operating profit of $0.10 is generated
and $0.90 is consumed by operating expenses. The margin
provides the analyst with a sense of the cost structure of the
business. Common definitions of mar-gin include the following:](https://image.slidesharecdn.com/case5businessperformanceevaluationapproachesforthoughtf-221224154508-ec046d2b/85/CASE-5Business-Performance-Evaluation-Approaches-for-Thoughtf-docx-3-320.jpg)
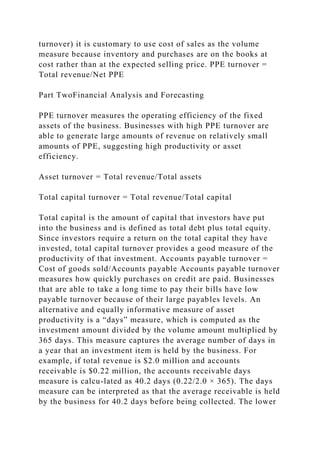
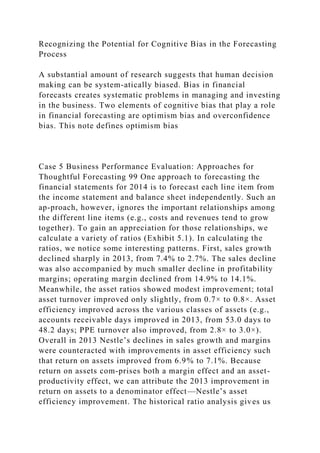
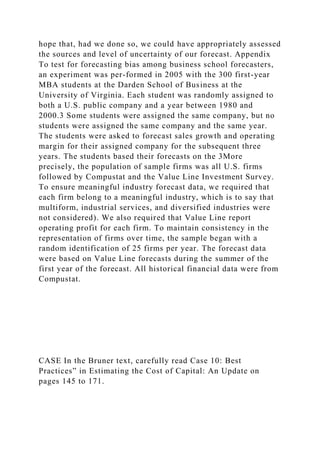
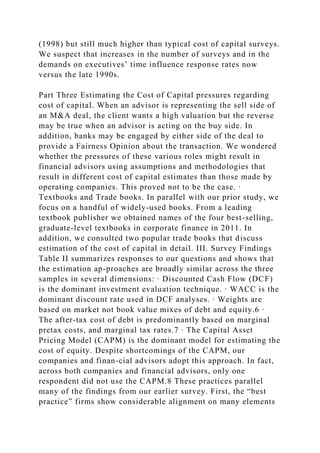
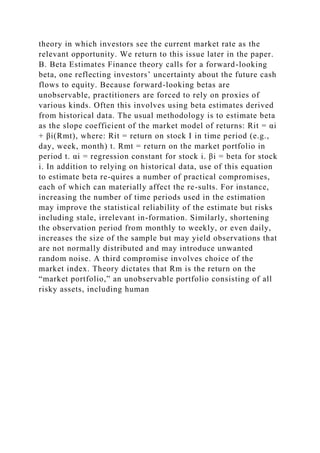
![current year’s revenue, and then use the gross margin rate to
yield an implicit dollar forecast for gross profit. As an example,
if we estimate revenue growth at 5% and operating margin at
24%, we can apply those ratios to last year’s total revenue of
$2.0 million to derive an implicit gross profit fore-cast of $0.5
million [2.0 × (1 + 0.05) × 0.24]. Given some familiarity with
the financial ratios of a business, the ratios are generally easier
to forecast with accuracy than are the expected dollar values.
The approach to forecasting is thus to model future financial
statements based on assumptions about future financial ratios.
Financial models based on financial ratios can be helpful in
identifying the impact of particular assumptions on the forecast.
For example, models can easily allow one to see the financial
impact on dollar profits of a difference of one percentage point
in op-erating margin. To facilitate such a scenario analysis,
financial models are commonly built in electronic spreadsheet
packages such as Microsoft Excel. Good financial fore-cast
models make the forecast assumptions highly transparent. To
achieve transparency, assumption cells for the forecast should
be prominently displayed in the spreadsheet (e.g., total revenue
growth rate assumption cell, operating margin assumption cell),
and then those cells should be referenced in the generation of
the forecast. In this way, it becomes easy not only to vary the
assumptions for different forecast scenarios, but also to
scrutinize the forecast assumptions. Grounding Business
Forecasts in the Reality of the Industry and Macroenvironment
Good financial forecasts recognize the impact of the business
environment on the per-formance of the business. Financial
forecasting should be grounded in an appreciation for industry-
and economy-wide pressures. Because business performance
tends to be correlated across the economy, information
regarding macroeconomic business trends should be
incorporated into a business’s financial forecast. If, for
example, price in-creases for a business are highly correlated
with economy-wide inflation trends, the financial forecast
should incorporate price growth assumptions that capture the](https://image.slidesharecdn.com/case5businessperformanceevaluationapproachesforthoughtf-221224154508-ec046d2b/85/CASE-5Business-Performance-Evaluation-Approaches-for-Thoughtf-docx-8-320.jpg)
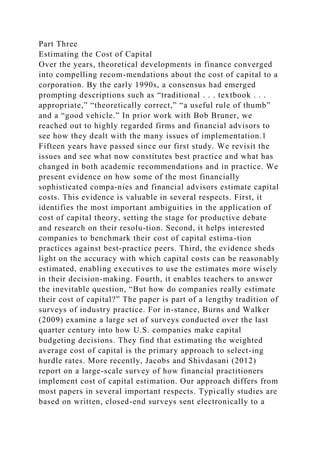
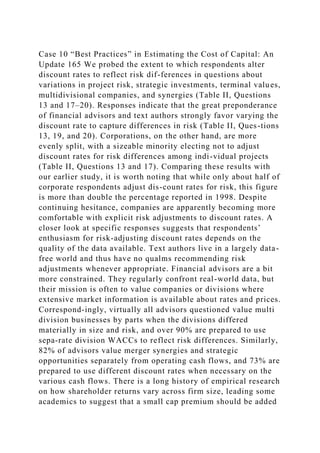
![natural test of respondents’ com-mitment to existing cost of
capital estimation methodologies and applications. When
confronted with a major external shock, did companies make
wholesale changes or did they keep to existing practices? When
we asked companies and advisors if financial market conditions
in 2008–2009 caused them to change the way they estimate and
use the cost of capital (Table II, Question 15), over three-fifths
replied “No.” In the main, then, there was not a wholesale
change in methods. That said, a number of respondents noted
discomfort with cost of capital estimation in recent years. Some
singled out high volatility in markets. Others pointed to the low
interest rate environment resulting from Federal Reserve
policies to stimulate the U.S. economy. Combining low interest
rates and typical historical risk premiums created capital cost
estimates that some practitio-ners viewed as “too low.” One
company was so distrustful of market signals that it placed an
arbitrary eight percent floor under any cost of capital estimate,
noting that “since 2008, as rates have decreased so drastically,
we don’t feel that [the estimate] represents a long-term cost of
capital. Now we don’t report anything below 8% as a minimum
[cost of capital].” Among the minority who did revise their
estimation procedures to cope with these market forces, one
change was to put more reliance on historical numbers when
estimating interest rates as indicated in Table XI. This is in
sharp contrast to both finance theory and what we found in our
prior study. Such rejection of spot rates in favor of historical
averages or arbitrary numbers is inconsistent with the academic
view that historical data do not accurately reflect current
attitudes in competitive markets. The academic challenge today
is to better articulate the extent to which the superiority of spot
rates still applies when markets are highly volatile and when
gov-ernments are aggressively attempting to lower rates through
such initiatives as quan-titative easing. Another change in
estimation methods since our earlier study is reflected in the
fact that more companies are using forward-looking risk
premiums as we reported earlier and illustrated in Table VII.](https://image.slidesharecdn.com/case5businessperformanceevaluationapproachesforthoughtf-221224154508-ec046d2b/85/CASE-5Business-Performance-Evaluation-Approaches-for-Thoughtf-docx-25-320.jpg)