Downloaded 318 times
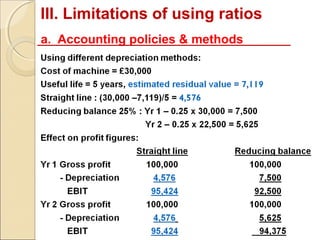
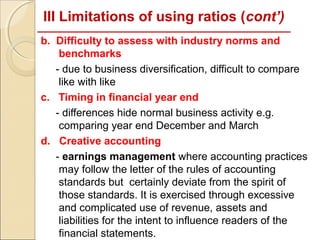
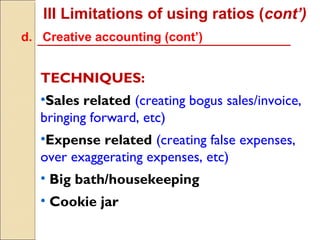


This document discusses limitations of ratio analysis and problems with benchmarking ratios. It explains that ratios are used instead of absolute numbers to simplify analysis and control for factors like company size. However, ratios have limitations due to accounting policies, difficulty assessing industry norms, and creative accounting techniques used to manage earnings. Benchmarking ratios against peers or over time also has problems due to non-comparable data, structural changes in companies, and changes in accounting methods.


